How to Master plt.subplots_adjust in Matplotlib
plt.subplots_adjust is a powerful function in Matplotlib that allows you to fine-tune the layout of your subplots. This comprehensive guide will explore the various aspects of plt.subplots_adjust, providing detailed explanations and practical examples to help you master this essential tool for creating polished and professional-looking visualizations.
Understanding the Basics of plt.subplots_adjust
plt.subplots_adjust is a function that adjusts the spacing between and around subplots in a Matplotlib figure. It provides precise control over the layout of your plots, allowing you to customize the positioning and spacing to achieve the desired visual effect.
Let’s start with a basic example to illustrate how plt.subplots_adjust works:
import matplotlib.pyplot as plt
import numpy as np

# Create a figure with two subplots
fig, (ax1, ax2) = plt.subplots(1, 2, figsize=(10, 4))

# Plot some data
x = np.linspace(0, 10, 100)
ax1.plot(x, np.sin(x), label='Sin(x)')
ax2.plot(x, np.cos(x), label='Cos(x)')

# Add labels and titles
ax1.set_title('Sine Wave - how2matplotlib.com')
ax2.set_title('Cosine Wave - how2matplotlib.com')
ax1.set_xlabel('X-axis')
ax2.set_xlabel('X-axis')
ax1.set_ylabel('Y-axis')
ax2.set_ylabel('Y-axis')

# Adjust the spacing between subplots
plt.subplots_adjust(wspace=0.4)

plt.show()
Output:
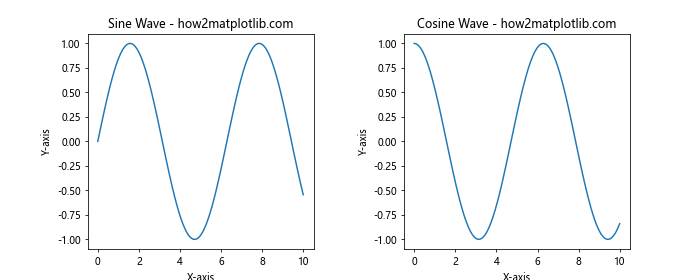
In this example, we create a figure with two subplots side by side. We use plt.subplots_adjust to increase the spacing between the subplots by setting wspace=0.4. This adjustment creates a more visually appealing layout by adding some breathing room between the plots.
Exploring the Parameters of plt.subplots_adjust
plt.subplots_adjust offers several parameters that allow you to control different aspects of the subplot layout. Let’s examine each of these parameters in detail:
left: The left side of the subplots of the figureright: The right side of the subplots of the figurebottom: The bottom of the subplots of the figuretop: The top of the subplots of the figurewspace: The width of the padding between subplots, as a fraction of the average axis widthhspace: The height of the padding between subplots, as a fraction of the average axis height
Let’s create an example that demonstrates the use of all these parameters:
import matplotlib.pyplot as plt
import numpy as np

# Create a figure with four subplots
fig, ((ax1, ax2), (ax3, ax4)) = plt.subplots(2, 2, figsize=(10, 8))

# Plot some data
x = np.linspace(0, 10, 100)
ax1.plot(x, np.sin(x), label='Sin(x)')
ax2.plot(x, np.cos(x), label='Cos(x)')
ax3.plot(x, np.tan(x), label='Tan(x)')
ax4.plot(x, np.exp(x), label='Exp(x)')

# Add labels and titles
ax1.set_title('Sine Wave - how2matplotlib.com')
ax2.set_title('Cosine Wave - how2matplotlib.com')
ax3.set_title('Tangent Wave - how2matplotlib.com')
ax4.set_title('Exponential Function - how2matplotlib.com')

# Adjust the spacing between and around subplots
plt.subplots_adjust(left=0.1, right=0.95, bottom=0.1, top=0.95, wspace=0.3, hspace=0.4)

plt.show()
Output:
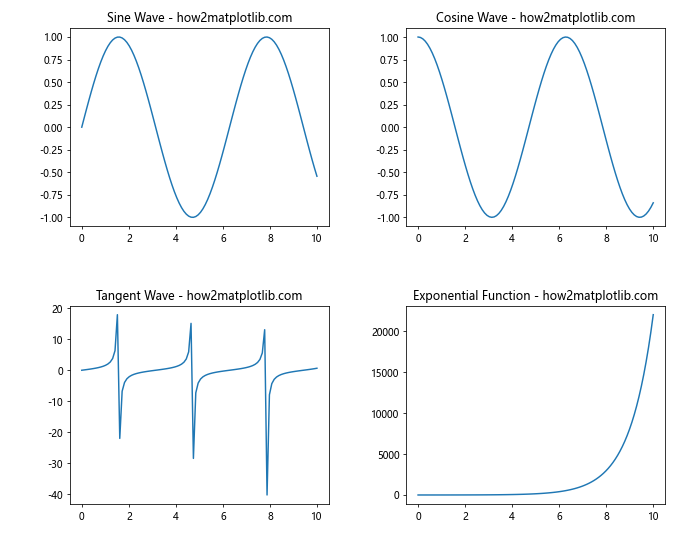
In this example, we create a 2×2 grid of subplots and use plt.subplots_adjust to customize the layout. We set the left, right, bottom, and top parameters to control the overall positioning of the subplots within the figure. The wspace and hspace parameters are used to adjust the horizontal and vertical spacing between the subplots, respectively.
Fine-tuning Subplot Margins with plt.subplots_adjust
One of the most common uses of plt.subplots_adjust is to fine-tune the margins around subplots. This can be particularly useful when you need to accommodate long axis labels or titles, or when you want to create a more compact layout.
Let’s look at an example that demonstrates how to adjust margins to accommodate long titles:
import matplotlib.pyplot as plt
import numpy as np

# Create a figure with two subplots
fig, (ax1, ax2) = plt.subplots(2, 1, figsize=(8, 10))

# Plot some data
x = np.linspace(0, 10, 100)
ax1.plot(x, np.sin(x), label='Sin(x)')
ax2.plot(x, np.cos(x), label='Cos(x)')

# Add labels and long titles
ax1.set_title('Sine Wave with a Very Long Title - how2matplotlib.com')
ax2.set_title('Cosine Wave with Another Very Long Title - how2matplotlib.com')
ax1.set_xlabel('X-axis')
ax2.set_xlabel('X-axis')
ax1.set_ylabel('Y-axis')
ax2.set_ylabel('Y-axis')

# Adjust the top margin to accommodate long titles
plt.subplots_adjust(top=0.9)

plt.show()
Output:
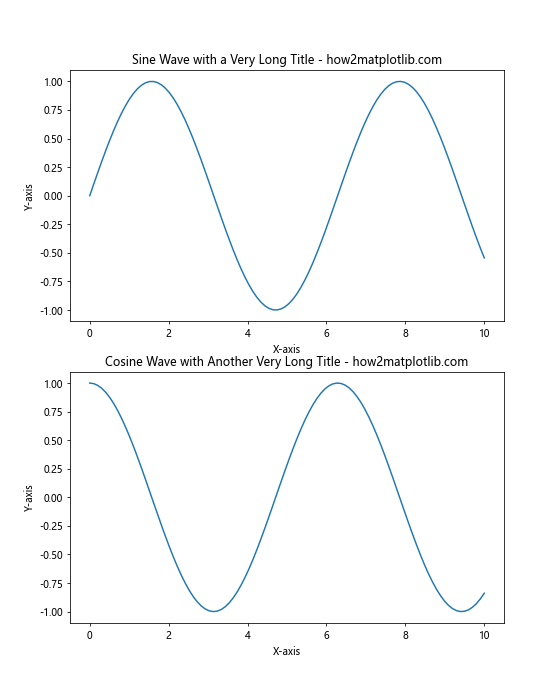
In this example, we create two subplots stacked vertically. The titles for these subplots are intentionally long, which can cause them to overlap with the figure boundaries. By using plt.subplots_adjust(top=0.9), we increase the space at the top of the figure, allowing the long titles to fit comfortably without being cut off.
Using plt.subplots_adjust for Tight Layouts
Sometimes, you may want to create a very compact layout with minimal space between subplots. plt.subplots_adjust can help you achieve this by allowing you to reduce the spacing between subplots to create a tight, efficient layout.
Here’s an example that demonstrates how to create a tight layout using plt.subplots_adjust:
import matplotlib.pyplot as plt
import numpy as np

# Create a figure with four subplots
fig, ((ax1, ax2), (ax3, ax4)) = plt.subplots(2, 2, figsize=(8, 8))

# Plot some data
x = np.linspace(0, 10, 100)
ax1.plot(x, np.sin(x))
ax2.plot(x, np.cos(x))
ax3.plot(x, np.tan(x))
ax4.plot(x, np.exp(x))

# Add titles
ax1.set_title('Sin(x) - how2matplotlib.com')
ax2.set_title('Cos(x) - how2matplotlib.com')
ax3.set_title('Tan(x) - how2matplotlib.com')
ax4.set_title('Exp(x) - how2matplotlib.com')

# Create a tight layout
plt.subplots_adjust(left=0.05, right=0.95, bottom=0.05, top=0.95, wspace=0.2, hspace=0.3)

plt.show()
Output:
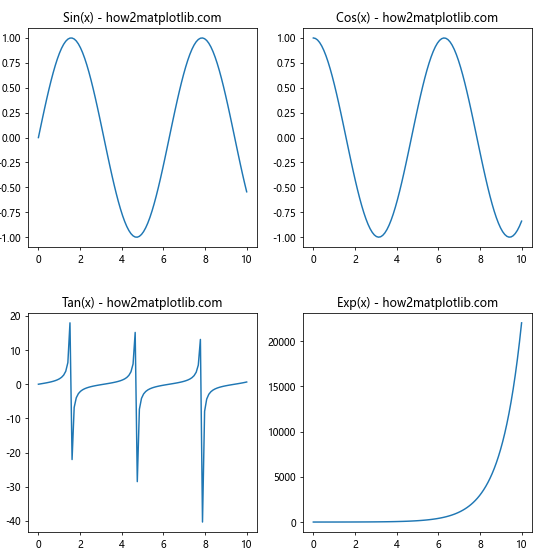
In this example, we create a 2×2 grid of subplots and use plt.subplots_adjust to create a tight layout. By setting small values for left, bottom, and wspace, and large values for right and top, we minimize the space around and between the subplots, resulting in a compact and efficient use of the figure space.
Combining plt.subplots_adjust with plt.tight_layout()
While plt.subplots_adjust gives you fine-grained control over subplot spacing, Matplotlib also provides a convenient function called plt.tight_layout() that automatically adjusts subplot parameters to give specified padding. You can combine these two functions to achieve even more precise control over your layouts.
Here’s an example that demonstrates how to use plt.subplots_adjust in combination with plt.tight_layout():
import matplotlib.pyplot as plt
import numpy as np

# Create a figure with four subplots
fig, ((ax1, ax2), (ax3, ax4)) = plt.subplots(2, 2, figsize=(10, 8))

# Plot some data
x = np.linspace(0, 10, 100)
ax1.plot(x, np.sin(x))
ax2.plot(x, np.cos(x))
ax3.plot(x, np.tan(x))
ax4.plot(x, np.exp(x))

# Add titles and labels
ax1.set_title('Sin(x) - how2matplotlib.com')
ax2.set_title('Cos(x) - how2matplotlib.com')
ax3.set_title('Tan(x) - how2matplotlib.com')
ax4.set_title('Exp(x) - how2matplotlib.com')
ax1.set_xlabel('X-axis')
ax2.set_xlabel('X-axis')
ax3.set_xlabel('X-axis')
ax4.set_xlabel('X-axis')
ax1.set_ylabel('Y-axis')
ax2.set_ylabel('Y-axis')
ax3.set_ylabel('Y-axis')
ax4.set_ylabel('Y-axis')

# Apply tight_layout first
plt.tight_layout()

# Then fine-tune with subplots_adjust
plt.subplots_adjust(wspace=0.3, hspace=0.3)

plt.show()
Output:
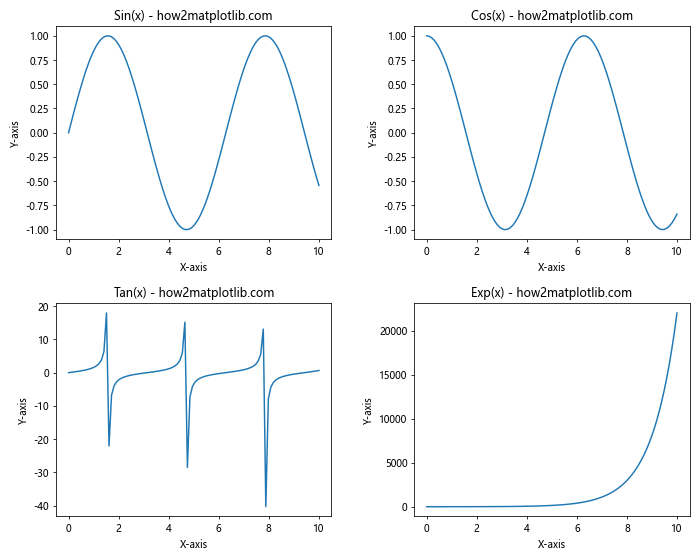
In this example, we first apply plt.tight_layout() to automatically adjust the subplot parameters. Then, we use plt.subplots_adjust to fine-tune the horizontal and vertical spacing between subplots. This combination allows us to benefit from the automatic adjustments of tight_layout while still having the flexibility to make manual adjustments where needed.
Using plt.subplots_adjust with Different Subplot Sizes
plt.subplots_adjust can be particularly useful when working with subplots of different sizes. In such cases, you may need to adjust the spacing to ensure that all subplots are visible and properly aligned.
Let’s look at an example that demonstrates how to use plt.subplots_adjust with subplots of different sizes:
import matplotlib.pyplot as plt
import numpy as np

# Create a figure with subplots of different sizes
fig = plt.figure(figsize=(12, 8))
ax1 = plt.subplot2grid((3, 3), (0, 0), colspan=2)
ax2 = plt.subplot2grid((3, 3), (0, 2), rowspan=3)
ax3 = plt.subplot2grid((3, 3), (1, 0), colspan=2)
ax4 = plt.subplot2grid((3, 3), (2, 0))
ax5 = plt.subplot2grid((3, 3), (2, 1))

# Plot some data
x = np.linspace(0, 10, 100)
ax1.plot(x, np.sin(x))
ax2.plot(x, np.cos(x))
ax3.plot(x, np.tan(x))
ax4.plot(x, np.exp(x))
ax5.plot(x, np.log(x))

# Add titles
ax1.set_title('Sin(x) - how2matplotlib.com')
ax2.set_title('Cos(x) - how2matplotlib.com')
ax3.set_title('Tan(x) - how2matplotlib.com')
ax4.set_title('Exp(x) - how2matplotlib.com')
ax5.set_title('Log(x) - how2matplotlib.com')

# Adjust the spacing between subplots
plt.subplots_adjust(left=0.05, right=0.95, bottom=0.05, top=0.95, wspace=0.3, hspace=0.3)

plt.show()
Output:
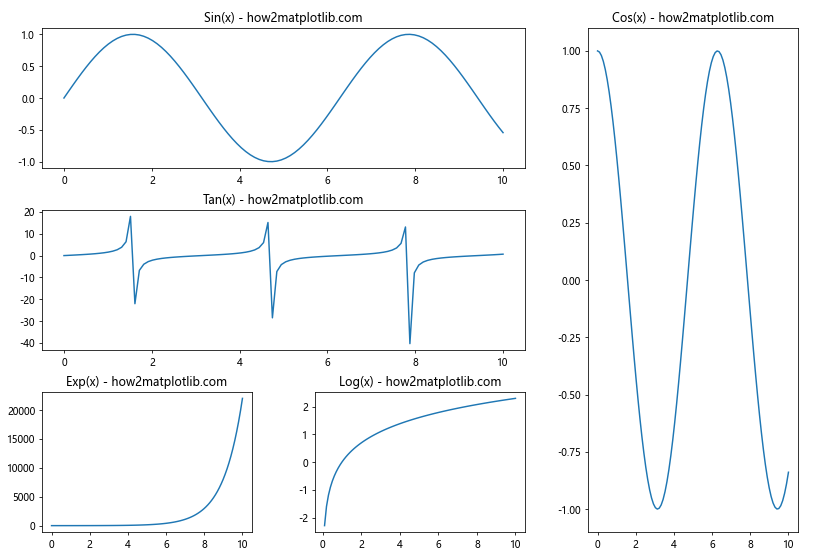
In this example, we create a figure with subplots of different sizes using plt.subplot2grid. We then use plt.subplots_adjust to fine-tune the spacing between these differently sized subplots. By adjusting the left, right, bottom, top, wspace, and hspace parameters, we ensure that all subplots are visible and properly spaced within the figure.
Adjusting Subplot Spacing for Better Readability
When creating complex visualizations with multiple subplots, it’s important to ensure that the spacing between subplots allows for easy readability. plt.subplots_adjust can help you achieve this by allowing you to fine-tune the spacing to prevent overlapping labels or cramped layouts.
Here’s an example that demonstrates how to use plt.subplots_adjust to improve the readability of a multi-subplot figure:
import matplotlib.pyplot as plt
import numpy as np

# Create a figure with six subplots
fig, ((ax1, ax2, ax3), (ax4, ax5, ax6)) = plt.subplots(2, 3, figsize=(15, 10))

# Plot some data
x = np.linspace(0, 10, 100)
ax1.plot(x, np.sin(x))
ax2.plot(x, np.cos(x))
ax3.plot(x, np.tan(x))
ax4.plot(x, np.exp(x))
ax5.plot(x, np.log(x))
ax6.plot(x, x**2)

# Add titles and labels
ax1.set_title('Sin(x) - how2matplotlib.com')
ax2.set_title('Cos(x) - how2matplotlib.com')
ax3.set_title('Tan(x) - how2matplotlib.com')
ax4.set_title('Exp(x) - how2matplotlib.com')
ax5.set_title('Log(x) - how2matplotlib.com')
ax6.set_title('X^2 - how2matplotlib.com')

for ax in (ax1, ax2, ax3, ax4, ax5, ax6):
    ax.set_xlabel('X-axis')
    ax.set_ylabel('Y-axis')

# Adjust the spacing for better readability
plt.subplots_adjust(left=0.08, right=0.98, bottom=0.08, top=0.92, wspace=0.3, hspace=0.4)

plt.show()
Output:
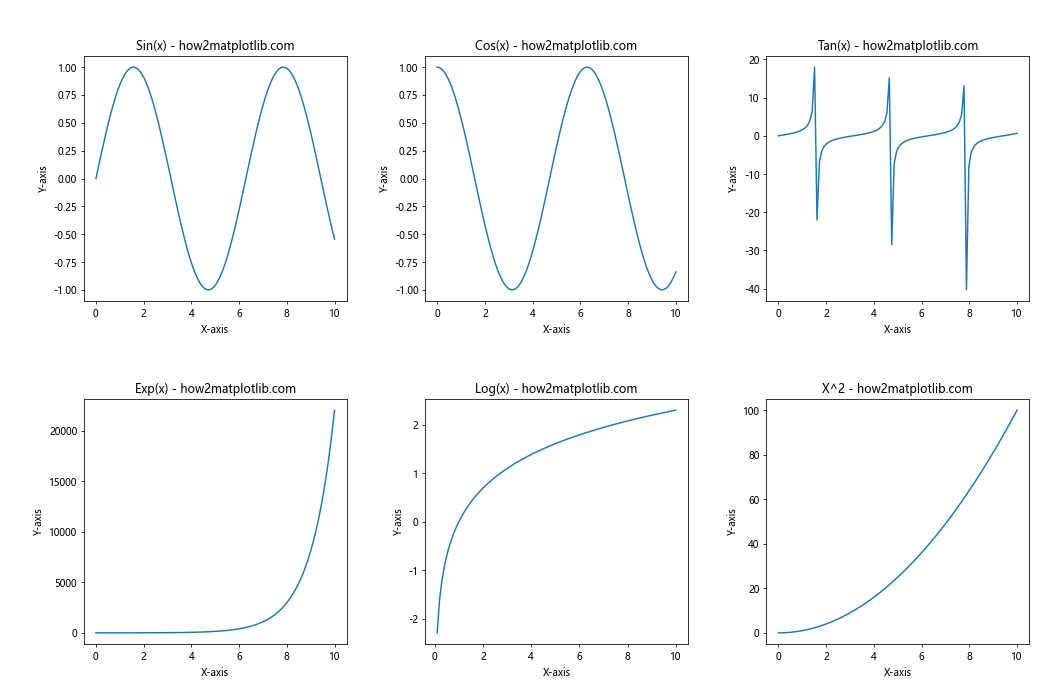
In this example, we create a figure with six subplots arranged in a 2×3 grid. We use plt.subplots_adjust to increase the spacing between subplots (wspace and hspace) and adjust the overall positioning of the subplots within the figure (left, right, bottom, and top). These adjustments ensure that there’s enough space for all labels and titles, improving the overall readability of the figure.
Using plt.subplots_adjust for Asymmetric Layouts
plt.subplots_adjust can also be used to create asymmetric layouts, where the spacing between subplots is not uniform. This can be useful when you want to emphasize certain subplots or create a more dynamic visual composition.
Here’s an example that demonstrates how to create an asymmetric layout using plt.subplots_adjust:
import matplotlib.pyplot as plt
import numpy as np

# Create a figure with four subplots
fig = plt.figure(figsize=(12, 8))
ax1 = fig.add_subplot(221)
ax2 = fig.add_subplot(222)
ax3 = fig.add_subplot(223)
ax4 = fig.add_subplot(224)

# Plot some data
x = np.linspace(0, 10, 100)
ax1.plot(x, np.sin(x))
ax2.plot(x, np.cos(x))
ax3.plot(x, np.tan(x))
ax4.plot(x, np.exp(x))

# Add titles
ax1.set_title('Sin(x) - how2matplotlib.com')
ax2.set_title('Cos(x) - how2matplotlib.com')
ax3.set_title('Tan(x) - how2matplotlib.com')
ax4.set_title('Exp(x) - how2matplotlib.com')

# Create an asymmetric layout
plt.subplots_adjust(left=0.1, right=0.95, bottom=0.1, top=0.9, wspace=0.4, hspace=0.3)

plt.show()
Output:
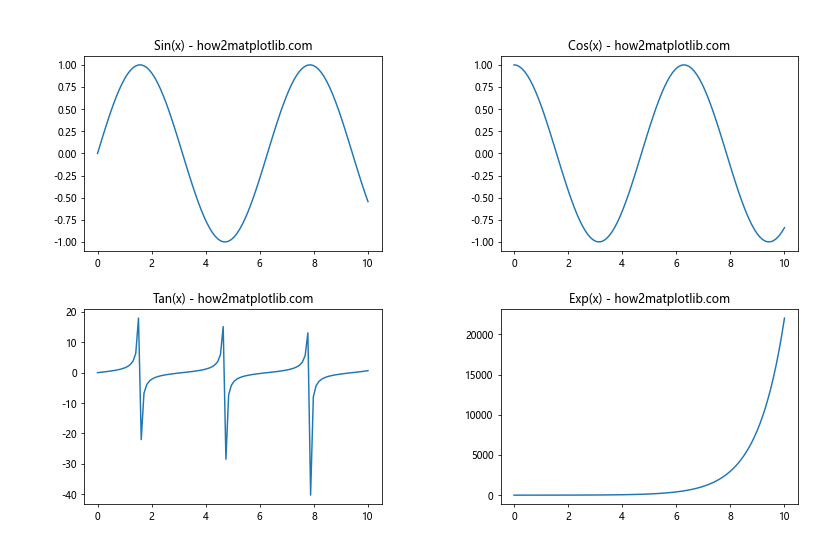
In this example, we create four subplots and use plt.subplots_adjust to create an asymmetric layout. By setting different values for wspace and hspace, we create more space between the columns than between the rows. This asymmetric spacing can be used to guide the viewer’s attention or to accommodate subplots with different aspect ratios.
Dynamically Adjusting Subplot Spacing
Sometimes, you may need to adjust the subplot spacing dynamically based on the content of your plots. plt.subplots_adjust can be used in conjunction with conditional statements to achieve this.
Here’s an example that demonstrates how to dynamically adjust subplot spacing based on the presence of long titles:
import matplotlib.pyplot as plt
import numpy as np

# Create a figure with two subplots
fig, (ax1, ax2) = plt.subplots(1, 2, figsize=(12, 5))

# Plot some data
x = np.linspace(0, 10, 100)
ax1.plot(x, np.sin(x))
ax2.plot(x, np.cos(x))

# Add titles
short_title = 'Sin(x) - how2matplotlib.com'
long_title = 'Cosine Function with a Very Long Title - how2matplotlib.com'

ax1.set_title(short_title)
ax2.set_title(long_title)

# Dynamically adjust spacing based on title length
if len(long_title) > 30:
    plt.subplots_adjust(top=0.85, wspace=0.3)
else:
    plt.subplots_adjust(top=0.9, wspace=0.2)

plt.show()
Output:
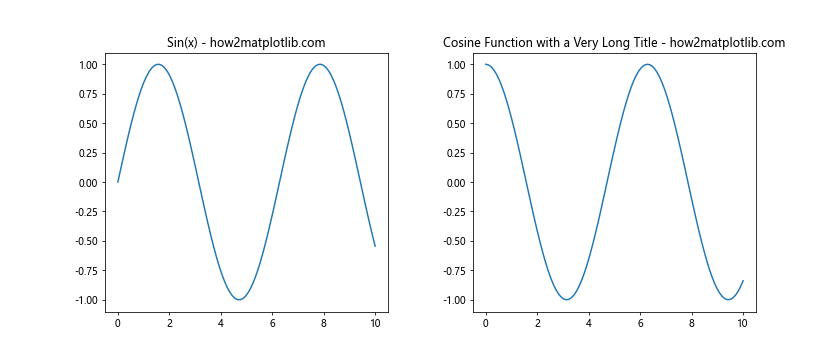
In this example, we check the length of the longer title and adjust the top and wspace parameters accordingly. If the title is longer than 30 characters, we increase the top margin and the space between subplots to accommodate the longer text.
Using plt.subplots_adjust with Colorbar
When adding a colorbar to your plots, you may need to adjust the subplot spacing to make room for it. plt.subplots_adjust can be used in combination with the make_axes_locatable function from mpl_toolkits.axes_grid1 to achieve this.
Here’s an example that demonstrates how to use plt.subplots_adjust when adding a colorbar:
import matplotlib.pyplot as plt
import numpy as np
from mpl_toolkits.axes_grid1 import make_axes_locatable

# Create a figure with two subplots
fig, (ax1, ax2) = plt.subplots(1, 2, figsize=(12, 5))

# Create some data
x = np.linspace(-5, 5, 100)
y = np.linspace(-5, 5, 100)
X, Y = np.meshgrid(x, y)
Z1 = np.sin(np.sqrt(X**2 + Y**2))
Z2 = np.cos(np.sqrt(X**2 + Y**2))

# Create the plots
im1 = ax1.imshow(Z1, extent=[-5, 5, -5, 5], origin='lower', cmap='viridis')
im2 = ax2.imshow(Z2, extent=[-5, 5, -5, 5], origin='lower', cmap='plasma')

# Add colorbars
divider1 = make_axes_locatable(ax1)
cax1 = divider1.append_axes("right", size="5%", pad=0.05)
plt.colorbar(im1, cax=cax1)

divider2 = make_axes_locatable(ax2)
cax2 = divider2.append_axes("right", size="5%", pad=0.05)
plt.colorbar(im2, cax=cax2)

# Add titles
ax1.set_title('Sin(r) - how2matplotlib.com')
ax2.set_title('Cos(r) - how2matplotlib.com')

# Adjust subplot spacing to accommodate colorbars
plt.subplots_adjust(left=0.1, right=0.9, wspace=0.4)

plt.show()
Output:
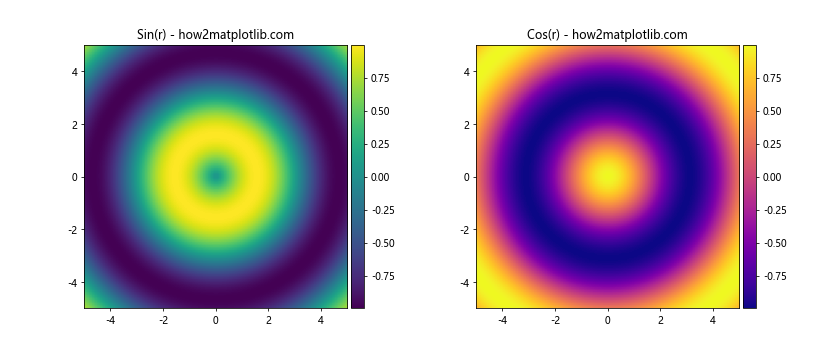
In this example, we create two subplots with image plots and add colorbars to each. We use make_axes_locatable to create space for the colorbars, and then use plt.subplots_adjust to fine-tune the overall layout, ensuring that there’s enough space for the colorbars without overlapping.
Adjusting Subplot Spacing for Different Screen Sizes
When creating visualizations that need to work on different screen sizes, you may want to adjust the subplot spacing dynamically based on the figure size. plt.subplots_adjust can be used in combination with the figure’s size to achieve this.
Here’s an example that demonstrates how to adjust subplot spacing based on the figure size:
import matplotlib.pyplot as plt
import numpy as np

def create_plot(figsize):
    # Create a figure with four subplots
    fig, ((ax1, ax2), (ax3, ax4)) = plt.subplots(2, 2, figsize=figsize)

    # Plot some data
    x = np.linspace(0, 10, 100)
    ax1.plot(x, np.sin(x))
    ax2.plot(x, np.cos(x))
    ax3.plot(x, np.tan(x))
    ax4.plot(x, np.exp(x))

    # Add titles
    ax1.set_title('Sin(x) - how2matplotlib.com')
    ax2.set_title('Cos(x) - how2matplotlib.com')
    ax3.set_title('Tan(x) - how2matplotlib.com')
    ax4.set_title('Exp(x) - how2matplotlib.com')

    # Calculate spacing based on figure size
    width, height = figsize
    wspace = 0.2 + (10 - width) * 0.02
    hspace = 0.3 + (8 - height) * 0.02

    # Adjust subplot spacing
    plt.subplots_adjust(wspace=wspace, hspace=hspace)

    plt.show()

# Create plots with different figure sizes
create_plot((8, 6))  # Smaller figure
create_plot((12, 9))  # Larger figure
In this example, we define a function create_plot that takes a figure size as an argument. Inside this function, we calculate the wspace and hspace values based on the figure size. For smaller figures, we increase the spacing to prevent overcrowding, while for larger figures, we can afford to have less space between subplots.
Using plt.subplots_adjust with Annotations
When adding annotations to your plots, you may need to adjust the subplot spacing to ensure that the annotations don’t overlap with other elements. plt.subplots_adjust can help you create space for annotations.
Here’s an example that demonstrates how to use plt.subplots_adjust when adding annotations:
import matplotlib.pyplot as plt
import numpy as np

# Create a figure with two subplots
fig, (ax1, ax2) = plt.subplots(1, 2, figsize=(12, 5))

# Plot some data
x = np.linspace(0, 10, 100)
ax1.plot(x, np.sin(x))
ax2.plot(x, np.cos(x))

# Add titles
ax1.set_title('Sin(x) - how2matplotlib.com')
ax2.set_title('Cos(x) - how2matplotlib.com')

# Add annotations
ax1.annotate('Peak', xy=(np.pi/2, 1), xytext=(np.pi/2, 1.5),
             arrowprops=dict(facecolor='black', shrink=0.05))
ax2.annotate('Trough', xy=(np.pi, -1), xytext=(np.pi, -1.5),
             arrowprops=dict(facecolor='black', shrink=0.05))

# Adjust subplot spacing to accommodate annotations
plt.subplots_adjust(top=0.85, bottom=0.15, wspace=0.3)

plt.show()
Output:
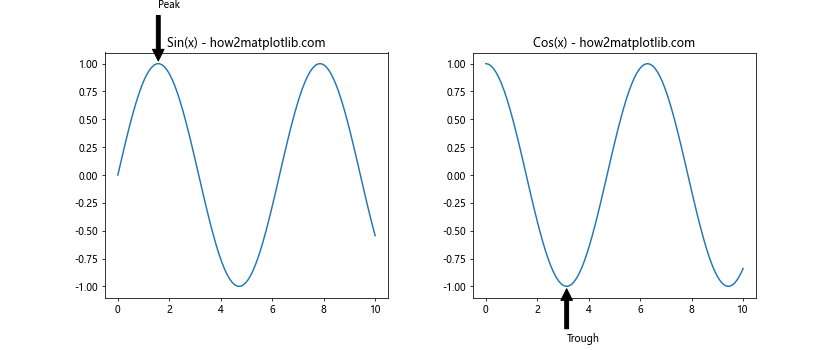
In this example, we add annotations to both subplots. To ensure that these annotations don’t get cut off, we use plt.subplots_adjust to increase the top and bottom margins of the figure. We also increase the wspace to provide more horizontal space between the subplots.
Combining plt.subplots_adjust with GridSpec
For more complex layouts, you can combine plt.subplots_adjust with GridSpec, which allows for even more flexible subplot arrangements. plt.subplots_adjust can be used to fine-tune the overall spacing of the GridSpec layout.
Here’s an example that demonstrates how to use plt.subplots_adjust with GridSpec:
import matplotlib.pyplot as plt
import numpy as np
from matplotlib.gridspec import GridSpec

# Create a figure and GridSpec
fig = plt.figure(figsize=(12, 8))
gs = GridSpec(3, 3, figure=fig)

# Create subplots with different sizes
ax1 = fig.add_subplot(gs[0, :2])
ax2 = fig.add_subplot(gs[0, 2])
ax3 = fig.add_subplot(gs[1:, :2])
ax4 = fig.add_subplot(gs[1, 2])
ax5 = fig.add_subplot(gs[2, 2])

# Plot some data
x = np.linspace(0, 10, 100)
ax1.plot(x, np.sin(x))
ax2.plot(x, np.cos(x))
ax3.plot(x, np.tan(x))
ax4.plot(x, np.exp(x))
ax5.plot(x, np.log(x))

# Add titles
ax1.set_title('Sin(x) - how2matplotlib.com')
ax2.set_title('Cos(x) - how2matplotlib.com')
ax3.set_title('Tan(x) - how2matplotlib.com')
ax4.set_title('Exp(x) - how2matplotlib.com')
ax5.set_title('Log(x) - how2matplotlib.com')

# Adjust the overall spacing of the GridSpec layout
plt.subplots_adjust(left=0.1, right=0.95, bottom=0.1, top=0.95, wspace=0.3, hspace=0.3)

plt.show()
Output:
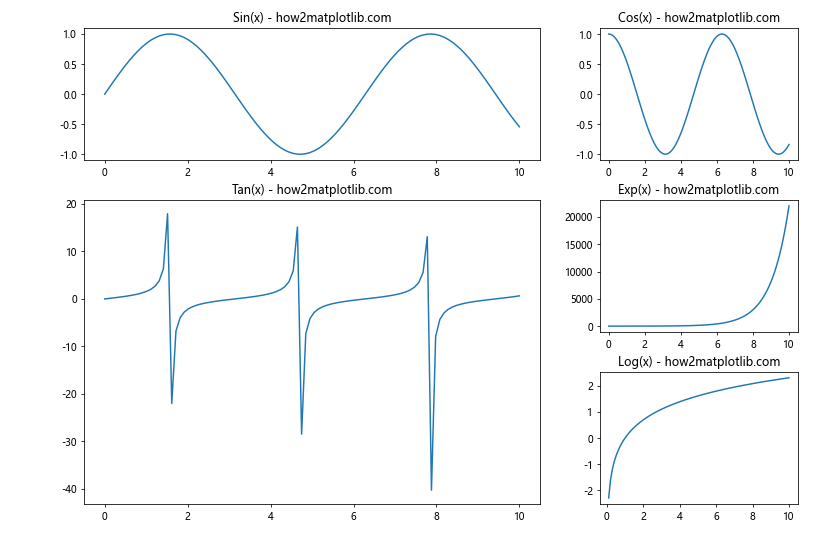
In this example, we use GridSpec to create a complex layout with subplots of different sizes. We then use plt.subplots_adjust to fine-tune the overall spacing of the layout, ensuring that all subplots are visible and properly spaced.
plt.subplots_adjust Conclusion
plt.subplots_adjust is a powerful tool in Matplotlib that allows you to fine-tune the layout of your subplots. By adjusting parameters such as left, right, bottom, top, wspace, and hspace, you can create polished and professional-looking visualizations that effectively communicate your data.
Throughout this guide, we’ve explored various aspects of plt.subplots_adjust, including:
- Understanding the basic usage and parameters
- Fine-tuning subplot margins
- Creating tight layouts
- Combining plt.subplots_adjust with plt.tight_layout()
- Working with subplots of different sizes
- Adjusting spacing for better readability
- Creating asymmetric layouts
- Dynamically adjusting spacing based on content
- Using plt.subplots_adjust with colorbars
- Adapting to different screen sizes
- Accommodating annotations
- Combining plt.subplots_adjust with GridSpec for complex layouts