How to Generate a Heatmap in MatPlotLib Using a Scatter Dataset
Generate a Heatmap in MatPlotLib Using a Scatter Dataset is a powerful visualization technique that allows you to represent the density of data points in a two-dimensional space. This article will explore various methods and techniques to generate heatmaps using scatter datasets in MatPlotLib, providing detailed explanations and code examples to help you master this visualization tool.
Understanding Heatmaps and Scatter Datasets
Before we dive into generating heatmaps in MatPlotLib using scatter datasets, it’s essential to understand what heatmaps and scatter datasets are and how they relate to each other.
A heatmap is a graphical representation of data where individual values are represented as colors. In the context of scatter data, a heatmap can be used to visualize the density of data points in a two-dimensional space. The color intensity in the heatmap corresponds to the concentration of data points in that particular region.
A scatter dataset, on the other hand, consists of individual data points plotted on a two-dimensional plane. Each point in a scatter plot represents two variables, typically represented by the x and y coordinates.
When we generate a heatmap using a scatter dataset, we’re essentially converting the discrete points of the scatter plot into a continuous representation of data density. This can be particularly useful when dealing with large datasets where individual points may overlap or become difficult to distinguish.
Setting Up Your Environment
To generate a heatmap in MatPlotLib using a scatter dataset, you’ll need to have Python installed on your system along with the following libraries:
- MatPlotLib
- NumPy
You can install these libraries using pip:
pip install matplotlib numpy
Once you have these libraries installed, you’re ready to start generating heatmaps using scatter datasets in MatPlotLib.
Basic Heatmap Generation
Let’s start with a basic example of how to generate a heatmap in MatPlotLib using a scatter dataset. We’ll create a simple scatter dataset and then convert it into a heatmap.
import matplotlib.pyplot as plt
import numpy as np

# Generate a scatter dataset
np.random.seed(42)
x = np.random.normal(0, 1, 1000)
y = np.random.normal(0, 1, 1000)

# Create a 2D histogram
hist, xedges, yedges = np.histogram2d(x, y, bins=20)

# Create a heatmap
plt.imshow(hist.T, origin='lower', extent=[xedges[0], xedges[-1], yedges[0], yedges[-1]])
plt.colorbar(label='Count')
plt.title('Generate a Heatmap in MatPlotLib Using a Scatter Dataset')
plt.xlabel('X-axis')
plt.ylabel('Y-axis')
plt.text(0, 0, 'how2matplotlib.com', fontsize=10, ha='center')
plt.show()
Output:
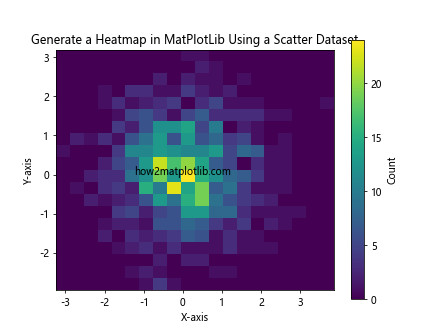
In this example, we first generate a scatter dataset using NumPy’s random normal distribution. We then use np.histogram2d() to create a 2D histogram of the data, which essentially bins the scatter points into a grid. Finally, we use plt.imshow() to display the histogram as a heatmap.
The origin='lower' parameter ensures that the heatmap is oriented correctly, with the origin at the bottom-left corner. The extent parameter is used to set the limits of the heatmap to match the original data range.
Customizing Heatmap Colors
One of the key aspects of generating an effective heatmap is choosing the right color scheme. MatPlotLib offers a wide range of colormaps that you can use to customize the appearance of your heatmap. Let’s explore how to apply different colormaps to our heatmap.
import matplotlib.pyplot as plt
import numpy as np

# Generate a scatter dataset
np.random.seed(42)
x = np.random.normal(0, 1, 1000)
y = np.random.normal(0, 1, 1000)

# Create a 2D histogram
hist, xedges, yedges = np.histogram2d(x, y, bins=20)

# Create a heatmap with a custom colormap
plt.imshow(hist.T, origin='lower', extent=[xedges[0], xedges[-1], yedges[0], yedges[-1]], cmap='viridis')
plt.colorbar(label='Count')
plt.title('Generate a Heatmap in MatPlotLib Using a Scatter Dataset (Viridis Colormap)')
plt.xlabel('X-axis')
plt.ylabel('Y-axis')
plt.text(0, 0, 'how2matplotlib.com', fontsize=10, ha='center')
plt.show()
Output:
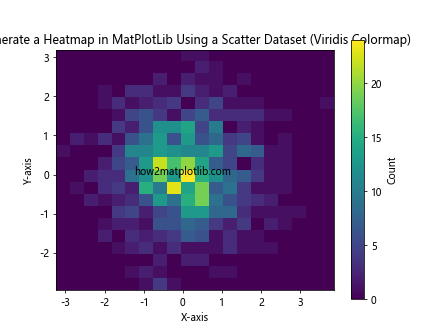
In this example, we’ve used the ‘viridis’ colormap, which is a perceptually uniform colormap that works well for heatmaps. You can experiment with other colormaps such as ‘hot’, ‘cool’, ‘plasma’, or ‘inferno’ to find the one that best represents your data.
Adding Contours to Heatmaps
To enhance the visualization of data density in your heatmap, you can add contour lines. Contour lines help to delineate regions of similar density, making it easier to interpret the heatmap. Here’s how you can add contours to your heatmap:
import matplotlib.pyplot as plt
import numpy as np

# Generate a scatter dataset
np.random.seed(42)
x = np.random.normal(0, 1, 1000)
y = np.random.normal(0, 1, 1000)

# Create a 2D histogram
hist, xedges, yedges = np.histogram2d(x, y, bins=20)

# Create a heatmap with contours
plt.imshow(hist.T, origin='lower', extent=[xedges[0], xedges[-1], yedges[0], yedges[-1]], cmap='YlOrRd')
plt.colorbar(label='Count')
plt.contour(hist.T, extent=[xedges[0], xedges[-1], yedges[0], yedges[-1]], colors='black', alpha=0.5)
plt.title('Generate a Heatmap in MatPlotLib Using a Scatter Dataset with Contours')
plt.xlabel('X-axis')
plt.ylabel('Y-axis')
plt.text(0, 0, 'how2matplotlib.com', fontsize=10, ha='center')
plt.show()
Output:
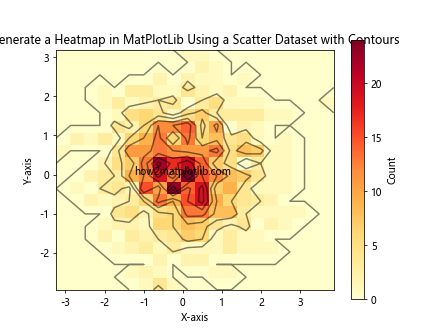
In this example, we’ve added contour lines using plt.contour(). The colors='black' parameter sets the color of the contour lines, while alpha=0.5 makes them semi-transparent so they don’t obscure the underlying heatmap.
Logarithmic Scaling for Heatmaps
When dealing with scatter datasets that have a wide range of densities, a linear scale may not effectively represent the data. In such cases, using a logarithmic scale can help to better visualize the full range of data densities. Here’s how you can create a heatmap with logarithmic scaling:
import matplotlib.pyplot as plt
import numpy as np

# Generate a scatter dataset with varying densities
np.random.seed(42)
x = np.concatenate([np.random.normal(0, 1, 1000), np.random.normal(3, 0.5, 5000)])
y = np.concatenate([np.random.normal(0, 1, 1000), np.random.normal(3, 0.5, 5000)])

# Create a 2D histogram
hist, xedges, yedges = np.histogram2d(x, y, bins=50)

# Create a heatmap with logarithmic scaling
plt.imshow(np.log1p(hist.T), origin='lower', extent=[xedges[0], xedges[-1], yedges[0], yedges[-1]], cmap='viridis')
plt.colorbar(label='Log(Count + 1)')
plt.title('Generate a Heatmap in MatPlotLib Using a Scatter Dataset (Log Scale)')
plt.xlabel('X-axis')
plt.ylabel('Y-axis')
plt.text(0, 0, 'how2matplotlib.com', fontsize=10, ha='center')
plt.show()
Output:
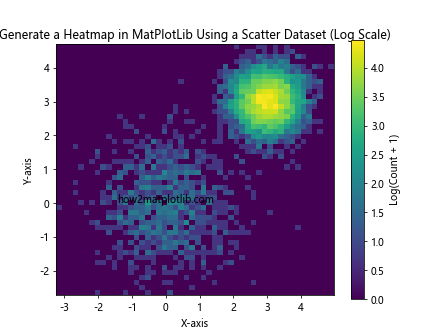
In this example, we’ve used np.log1p() to apply a logarithmic transformation to the histogram data. This function computes log(1 + x), which is useful for handling zero values in the histogram. The resulting heatmap will better represent the full range of data densities, making it easier to identify patterns in both high and low-density regions.
Smoothing Heatmaps
When generating a heatmap from a scatter dataset, the resulting visualization can sometimes appear blocky or pixelated, especially if the number of bins is small. To create a smoother, more visually appealing heatmap, you can apply various smoothing techniques. One common approach is to use a Gaussian filter. Here’s an example of how to create a smoothed heatmap:
import matplotlib.pyplot as plt
import numpy as np
from scipy.ndimage import gaussian_filter

# Generate a scatter dataset
np.random.seed(42)
x = np.random.normal(0, 1, 1000)
y = np.random.normal(0, 1, 1000)

# Create a 2D histogram
hist, xedges, yedges = np.histogram2d(x, y, bins=20)

# Apply Gaussian smoothing
sigma = 1.5
smoothed_hist = gaussian_filter(hist, sigma)

# Create a smoothed heatmap
plt.imshow(smoothed_hist.T, origin='lower', extent=[xedges[0], xedges[-1], yedges[0], yedges[-1]], cmap='viridis')
plt.colorbar(label='Smoothed Count')
plt.title('Generate a Smoothed Heatmap in MatPlotLib Using a Scatter Dataset')
plt.xlabel('X-axis')
plt.ylabel('Y-axis')
plt.text(0, 0, 'how2matplotlib.com', fontsize=10, ha='center')
plt.show()
Output:
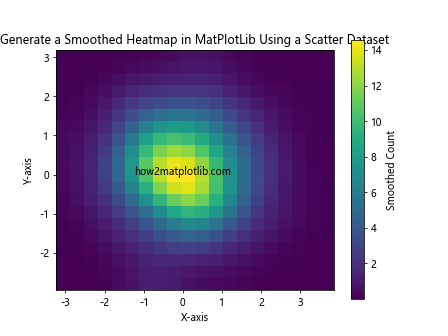
In this example, we’ve used scipy.ndimage.gaussian_filter() to apply Gaussian smoothing to the histogram data before creating the heatmap. The sigma parameter controls the amount of smoothing; higher values result in a smoother heatmap but may also blur important details.
Combining Scatter Plot with Heatmap
Sometimes, it can be informative to overlay the original scatter plot on top of the heatmap. This allows you to see both the individual data points and the overall density distribution. Here’s how you can create a heatmap with the original scatter points overlaid:
import matplotlib.pyplot as plt
import numpy as np

# Generate a scatter dataset
np.random.seed(42)
x = np.random.normal(0, 1, 1000)
y = np.random.normal(0, 1, 1000)

# Create a 2D histogram
hist, xedges, yedges = np.histogram2d(x, y, bins=20)

# Create a heatmap with scatter points
plt.imshow(hist.T, origin='lower', extent=[xedges[0], xedges[-1], yedges[0], yedges[-1]], cmap='YlOrRd', alpha=0.7)
plt.colorbar(label='Count')
plt.scatter(x, y, alpha=0.1, color='blue')
plt.title('Generate a Heatmap in MatPlotLib Using a Scatter Dataset with Points')
plt.xlabel('X-axis')
plt.ylabel('Y-axis')
plt.text(0, 0, 'how2matplotlib.com', fontsize=10, ha='center')
plt.show()
Output:
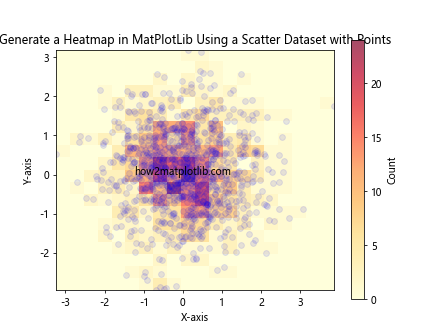
In this example, we first create the heatmap using plt.imshow() with reduced opacity (alpha=0.7). Then, we overlay the original scatter points using plt.scatter() with a low alpha value to prevent overcrowding the visualization.
Creating a 3D Heatmap
While 2D heatmaps are common, you can also create 3D heatmaps to provide a different perspective on your scatter dataset. Here’s an example of how to generate a 3D heatmap using MatPlotLib:
import matplotlib.pyplot as plt
import numpy as np
from mpl_toolkits.mplot3d import Axes3D

# Generate a scatter dataset
np.random.seed(42)
x = np.random.normal(0, 1, 1000)
y = np.random.normal(0, 1, 1000)

# Create a 2D histogram
hist, xedges, yedges = np.histogram2d(x, y, bins=20)

# Create X and Y coordinates for the histogram
X, Y = np.meshgrid(xedges[:-1] + 0.5 * (xedges[1] - xedges[0]),
                   yedges[:-1] + 0.5 * (yedges[1] - yedges[0]))

# Create a 3D heatmap
fig = plt.figure()
ax = fig.add_subplot(111, projection='3d')
surf = ax.plot_surface(X, Y, hist.T, cmap='viridis')
fig.colorbar(surf, label='Count')
ax.set_title('Generate a 3D Heatmap in MatPlotLib Using a Scatter Dataset')
ax.set_xlabel('X-axis')
ax.set_ylabel('Y-axis')
ax.set_zlabel('Count')
ax.text(0, 0, 0, 'how2matplotlib.com', fontsize=10, ha='center')
plt.show()
Output:
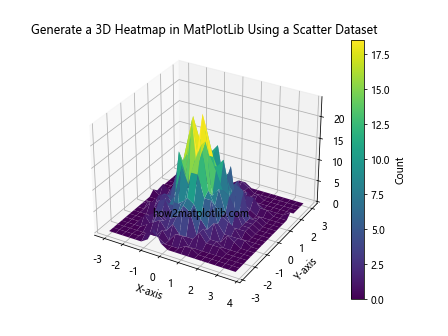
In this example, we use the mpl_toolkits.mplot3d module to create a 3D surface plot of the histogram data. The height of the surface represents the density of points in each bin.
Hexbin Plots: An Alternative to Traditional Heatmaps
While traditional heatmaps use rectangular bins, hexbin plots use hexagonal bins to represent data density. This can sometimes provide a more visually appealing and less blocky representation of the data. Here’s how you can create a hexbin plot in MatPlotLib:
import matplotlib.pyplot as plt
import numpy as np

# Generate a scatter dataset
np.random.seed(42)
x = np.random.normal(0, 1, 5000)
y = np.random.normal(0, 1, 5000)

# Create a hexbin plot
plt.hexbin(x, y, gridsize=20, cmap='viridis')
plt.colorbar(label='Count')
plt.title('Generate a Hexbin Plot in MatPlotLib Using a Scatter Dataset')
plt.xlabel('X-axis')
plt.ylabel('Y-axis')
plt.text(0, 0, 'how2matplotlib.com', fontsize=10, ha='center')
plt.show()
Output:
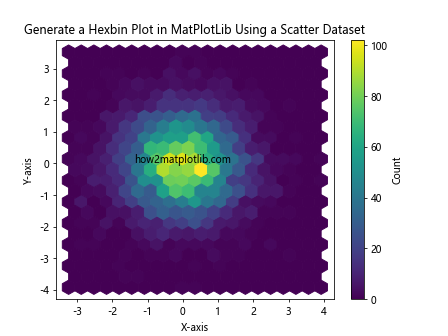
In this example, we use plt.hexbin() to create a hexagonal binning of the scatter data. The gridsize parameter controls the number of hexagons along each axis.
Kernel Density Estimation (KDE) Heatmaps
Kernel Density Estimation (KDE) is a non-parametric way to estimate the probability density function of a random variable. When applied to scatter data, it can produce smooth heatmaps that represent the underlying data distribution. Here’s how you can create a KDE heatmap using MatPlotLib and SciPy:
import matplotlib.pyplot as plt
import numpy as np
from scipy.stats import gaussian_kde

# Generate a scatter dataset
np.random.seed(42)
x = np.random.normal(0, 1, 1000)
y = np.random.normal(0, 1, 1000)

# Perform KDE
xy = np.vstack([x, y])
kde = gaussian_kde(xy)

# Create a grid of points
xmin, xmax = x.min(), x.max()
ymin, ymax = y.min(), y.max()
xi, yi = np.mgrid[xmin:xmax:100j, ymin:ymax:100j]
zi = kde(np.vstack([xi.flatten(), yi.flatten()]))

# Create a KDE heatmap
plt.imshow(zi.reshape(xi.shape), origin='lower', extent=[xmin, xmax, ymin, ymax], cmap='viridis')
plt.colorbar(label='Density')
plt.scatter(x, y, alpha=0.1, color='white')
plt.title('Generate a KDE Heatmap in MatPlotLib Using a Scatter Dataset')
plt.xlabel('X-axis')
plt.ylabel('Y-axis')
plt.text(0, 0, 'how2matplotlib.com', fontsize=10, ha='center')
plt.show()
Output:
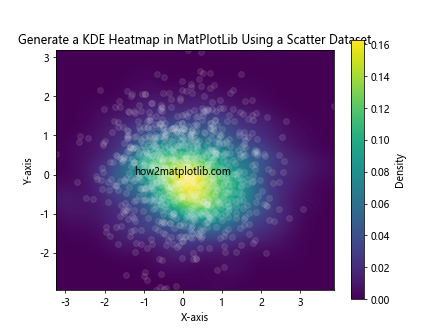
In this example, we use scipy.stats.gaussian_kde() to estimate the probability density function of the scatter data. We then evaluate this function on a grid of points and use plt.imshow() to create a smooth heatmap representation of the data density.
Animated Heatmaps
If your scatter dataset includes a time dimension, you can create animated heatmaps to show how the data density changes over time. Here’s an example of how to create a simple animated heatmap using MatPlotLib’s animation module:
import matplotlib.pyplot as plt
import numpy as np
from matplotlib.animation import FuncAnimation

# Generate a time-varying scatter dataset
np.random.seed(42)
t = np.linspace(0, 2*np.pi, 100)
x = np.cos(t) + np.random.normal(0, 0.1, (1000, 100))
y = np.sin(t) + np.random.normal(0, 0.1, (1000, 100))

# Create the figure and axis
fig, ax = plt.subplots()
hist, xedges, yedges = np.histogram2d(x[:, 0], y[:, 0], bins=20)
im = ax.imshow(hist.T, origin='lower', extent=[-2, 2, -2, 2], cmap='viridis', animated=True)
plt.colorbar(im, label='Count')

# Animation update function
def update(frame):
    hist, _, _ = np.histogram2d(x[:, frame], y[:, frame], bins=20, range=[[-2, 2], [-2, 2]])
    im.set_array(hist.T)
    ax.set_title(f'Generate a Heatmap in MatPlotLib Using a Scatter Dataset (t={frame/10:.1f})')
    return [im]

# Create the animation
anim = FuncAnimation(fig, update, frames=100, interval=50, blit=True)
plt.text(0, 0, 'how2matplotlib.com', fontsize=10, ha='center')
plt.show()
Output:
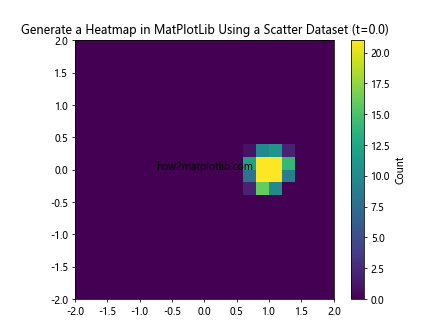
This example creates an animated heatmap that shows how the density of points changes as they follow a circular path over time. The FuncAnimation class is used to update the heatmap for each frame of the animation.
Heatmaps with Uneven Bin Sizes
In some cases, you might want to create a heatmap with uneven bin sizes, perhaps to focus on specific regions of interest or to account for non-uniform data distribution. Here’s how you can create a heatmap with custom bin edges:
import matplotlib.pyplot as plt
import numpy as np

# Generate a scatter dataset
np.random.seed(42)
x = np.random.exponential(1, 1000)
y = np.random.exponential(1, 1000)

# Define custom bin edges
xedges = np.concatenate([np.linspace(0, 1, 10), np.linspace(1, 5, 5)])
yedges = np.concatenate([np.linspace(0, 1, 10), np.linspace(1, 5, 5)])

# Create a 2D histogram with custom bin edges
hist, xedges, yedges = np.histogram2d(x, y, bins=(xedges, yedges))

# Create a heatmap with uneven bin sizes
plt.imshow(hist.T, origin='lower', extent=[xedges[0], xedges[-1], yedges[0], yedges[-1]],
           aspect='auto', cmap='viridis')
plt.colorbar(label='Count')
plt.title('Generate a Heatmap in MatPlotLib Using a Scatter Dataset with Uneven Bins')
plt.xlabel('X-axis')
plt.ylabel('Y-axis')
plt.text(2.5, 2.5, 'how2matplotlib.com', fontsize=10, ha='center')
plt.show()
Output:
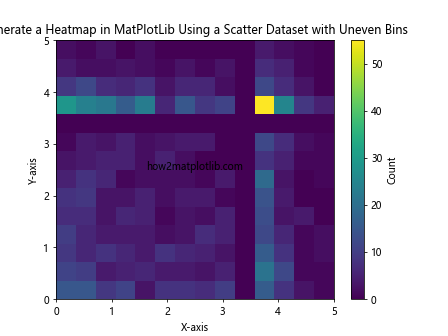
In this example, we use custom bin edges that are more closely spaced in the range [0, 1] and more widely spaced in the range [1, 5]. This allows us to capture more detail in the lower range where the exponential distribution has higher density.
Heatmaps with Marginal Distributions
Sometimes it’s useful to show the marginal distributions alongside the main heatmap. This can provide additional context about the distribution of your scatter dataset along each axis. Here’s how you can create a heatmap with marginal histograms:
import matplotlib.pyplot as plt
import numpy as np

# Generate a scatter dataset
np.random.seed(42)
x = np.random.normal(0, 1, 1000)
y = np.random.normal(0, 1, 1000)

# Create the main figure and subplots
fig = plt.figure(figsize=(10, 10))
gs = fig.add_gridspec(3, 3)
ax_main = fig.add_subplot(gs[1:, :-1])
ax_right = fig.add_subplot(gs[1:, -1], sharey=ax_main)
ax_top = fig.add_subplot(gs[0, :-1], sharex=ax_main)

# Create the main heatmap
hist, xedges, yedges = np.histogram2d(x, y, bins=20)
im = ax_main.imshow(hist.T, origin='lower', extent=[xedges[0], xedges[-1], yedges[0], yedges[-1]],
                    aspect='auto', cmap='viridis')
fig.colorbar(im, ax=ax_main, label='Count')

# Create the marginal histograms
ax_right.hist(y, bins=20, orientation='horizontal', density=True)
ax_right.set_xlabel('Density')
ax_top.hist(x, bins=20, density=True)
ax_top.set_ylabel('Density')

# Set labels and title
ax_main.set_xlabel('X-axis')
ax_main.set_ylabel('Y-axis')
fig.suptitle('Generate a Heatmap in MatPlotLib Using a Scatter Dataset with Marginals')
ax_main.text(0, 0, 'how2matplotlib.com', fontsize=10, ha='center')

# Remove top and right spines from marginal plots
ax_right.spines['top'].set_visible(False)
ax_right.spines['right'].set_visible(False)
ax_top.spines['top'].set_visible(False)
ax_top.spines['right'].set_visible(False)

plt.tight_layout()
plt.show()
Output:
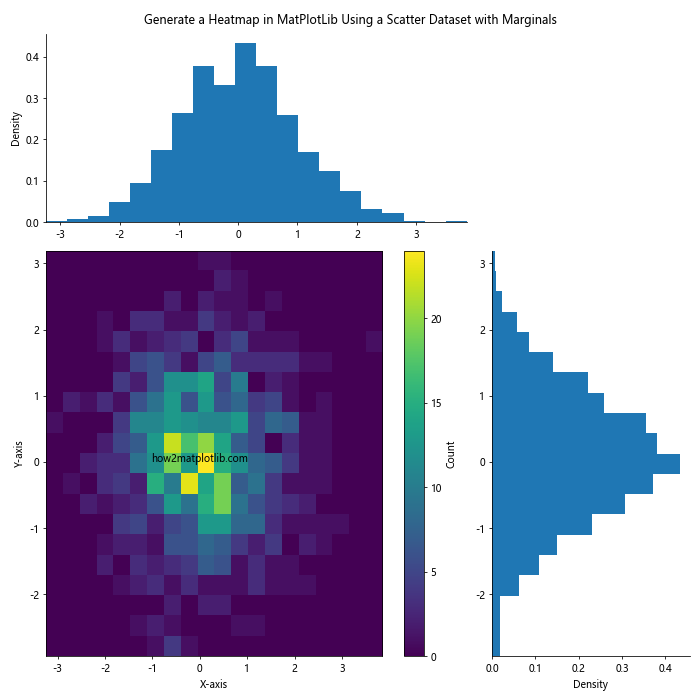
This example creates a main heatmap with marginal histograms on the top and right sides. The marginal histograms show the distribution of x and y values independently, providing additional context for interpreting the heatmap.
Conclusion
Generating a heatmap in MatPlotLib using a scatter dataset is a powerful way to visualize the density and distribution of your data. We’ve explored various techniques and customizations, from basic heatmap creation to more advanced topics like smoothing, 3D visualization, and animated heatmaps.
Remember that the key to creating effective heatmaps is to experiment with different parameters and techniques to find the representation that best communicates the patterns and insights in your data. Consider factors such as color scales, bin sizes, smoothing techniques, and additional visual elements like contours or scatter points to enhance your heatmaps.