How to Move Labels from Bottom to Top Without Adding Ticks in Matplotlib
Moving Labels from Bottom to Top Without Adding Ticks in Matplotlib is a common task when customizing plots in Python. This article will explore various techniques and best practices for moving labels from the bottom to the top of your Matplotlib plots without adding additional ticks. We’ll cover different scenarios and provide practical examples to help you master this aspect of data visualization.
Understanding the Basics of Moving Labels in Matplotlib
Before we dive into the specifics of moving labels from bottom to top without adding ticks in Matplotlib, let’s review some fundamental concepts. Matplotlib is a powerful plotting library in Python that allows for extensive customization of plots. When it comes to moving labels, we’re primarily concerned with axis manipulation and label positioning.
To move labels from bottom to top without adding ticks in Matplotlib, we need to understand how axes and labels work together. By default, Matplotlib places x-axis labels at the bottom of the plot and y-axis labels on the left side. However, we can modify this behavior to suit our needs.
Let’s start with a simple example to illustrate the default label placement:
import matplotlib.pyplot as plt

fig, ax = plt.subplots()
ax.plot([1, 2, 3, 4], [1, 4, 2, 3])
ax.set_xlabel('X-axis (how2matplotlib.com)')
ax.set_ylabel('Y-axis (how2matplotlib.com)')
plt.show()
Output:
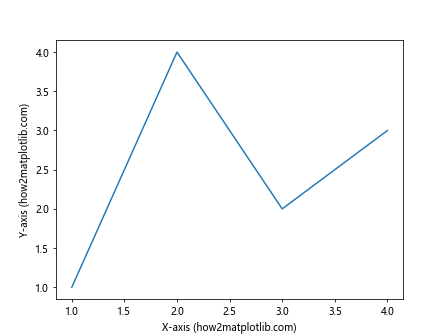
In this example, we create a basic line plot with default label positions. The x-axis label appears at the bottom, and the y-axis label is on the left side. Now, let’s explore how to move these labels without adding ticks.
Techniques for Moving Labels from Bottom to Top Without Adding Ticks
1. Using tick_params to Move Labels
One of the simplest ways to move labels from bottom to top without adding ticks in Matplotlib is by using the tick_params method. This method allows us to modify various properties of the ticks and labels, including their position.
Here’s an example of how to move the x-axis labels to the top:
import matplotlib.pyplot as plt

fig, ax = plt.subplots()
ax.plot([1, 2, 3, 4], [1, 4, 2, 3])
ax.set_xlabel('X-axis (how2matplotlib.com)')
ax.set_ylabel('Y-axis (how2matplotlib.com)')
ax.xaxis.set_tick_params(labeltop=True, labelbottom=False)
plt.show()
Output:
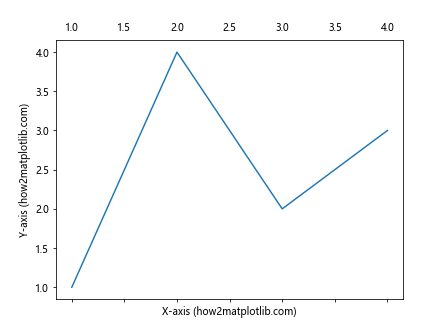
In this code, we use ax.xaxis.set_tick_params(labeltop=True, labelbottom=False) to move the x-axis labels to the top. The labeltop=True parameter tells Matplotlib to display labels at the top, while labelbottom=False hides the labels at the bottom.
2. Adjusting Label Positions with set_label_position
Another approach to moving labels from bottom to top without adding ticks in Matplotlib is by using the set_label_position method. This method allows us to specify the position of the axis labels directly.
Here’s an example:
import matplotlib.pyplot as plt

fig, ax = plt.subplots()
ax.plot([1, 2, 3, 4], [1, 4, 2, 3])
ax.set_xlabel('X-axis (how2matplotlib.com)')
ax.set_ylabel('Y-axis (how2matplotlib.com)')
ax.xaxis.set_label_position('top')
plt.show()
Output:
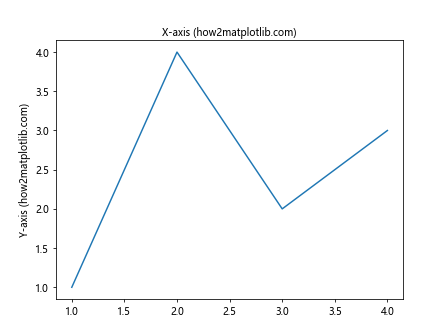
In this code, ax.xaxis.set_label_position('top') moves the x-axis label to the top of the plot. This method is particularly useful when you want to move labels without affecting the tick positions.
3. Combining tick_params and set_label_position
For more precise control over label positioning when moving labels from bottom to top without adding ticks in Matplotlib, we can combine the tick_params and set_label_position methods. This approach allows us to move both the ticks and the labels independently.
Here’s an example that demonstrates this technique:
import matplotlib.pyplot as plt

fig, ax = plt.subplots()
ax.plot([1, 2, 3, 4], [1, 4, 2, 3])
ax.set_xlabel('X-axis (how2matplotlib.com)')
ax.set_ylabel('Y-axis (how2matplotlib.com)')
ax.xaxis.set_tick_params(top=True, bottom=False, labeltop=True, labelbottom=False)
ax.xaxis.set_label_position('top')
plt.show()
Output:
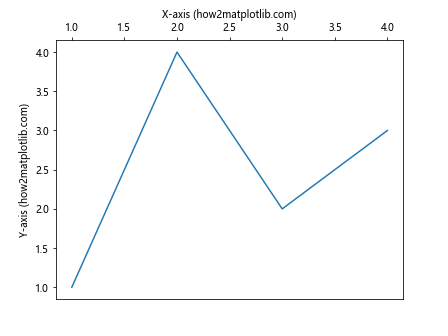
In this code, we use ax.xaxis.set_tick_params() to move the ticks and tick labels to the top, and ax.xaxis.set_label_position('top') to move the x-axis label to the top. This combination gives us full control over the position of both ticks and labels.
Advanced Techniques for Moving Labels Without Adding Ticks
1. Using spines to Customize Axis Appearance
When moving labels from bottom to top without adding ticks in Matplotlib, we can also manipulate the plot’s spines to achieve a desired look. Spines are the lines that connect the axis tick marks and form the box around the plot area.
Here’s an example of how to move the bottom spine to the top and adjust the labels accordingly:
import matplotlib.pyplot as plt

fig, ax = plt.subplots()
ax.plot([1, 2, 3, 4], [1, 4, 2, 3])
ax.set_xlabel('X-axis (how2matplotlib.com)')
ax.set_ylabel('Y-axis (how2matplotlib.com)')

# Move the bottom spine to the top
ax.spines['bottom'].set_position(('axes', 1))
ax.spines['top'].set_visible(False)

# Move x-axis ticks to the top
ax.xaxis.set_ticks_position('top')
ax.xaxis.set_label_position('top')

plt.show()
Output:
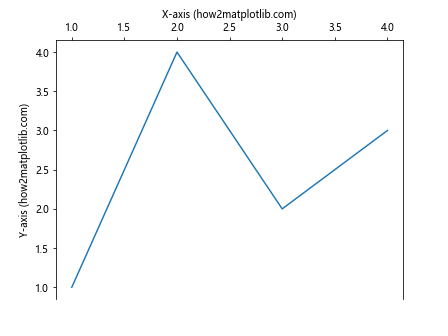
In this example, we use ax.spines['bottom'].set_position(('axes', 1)) to move the bottom spine to the top of the plot. We then hide the original top spine with ax.spines['top'].set_visible(False). Finally, we move the x-axis ticks and label to the top using set_ticks_position and set_label_position.
2. Creating Custom Tick Locators
When moving labels from bottom to top without adding ticks in Matplotlib, you might want to have more control over the tick positions. Matplotlib provides custom tick locators that allow you to specify exactly where ticks should appear.
Here’s an example using a FixedLocator:
import matplotlib.pyplot as plt
from matplotlib.ticker import FixedLocator

fig, ax = plt.subplots()
ax.plot([1, 2, 3, 4], [1, 4, 2, 3])
ax.set_xlabel('X-axis (how2matplotlib.com)')
ax.set_ylabel('Y-axis (how2matplotlib.com)')

# Create a custom tick locator
locator = FixedLocator([1.5, 2.5, 3.5])
ax.xaxis.set_major_locator(locator)

# Move labels to the top
ax.xaxis.set_tick_params(top=True, bottom=False, labeltop=True, labelbottom=False)
ax.xaxis.set_label_position('top')

plt.show()
Output:
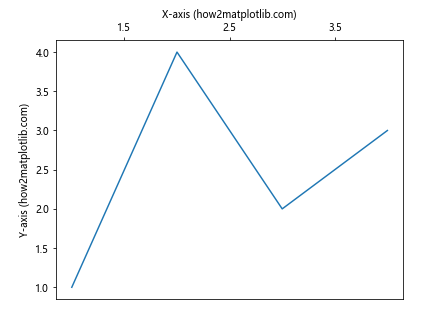
In this code, we create a FixedLocator with specific tick positions. We then apply this locator to the x-axis using set_major_locator. This allows us to have precise control over where ticks appear when moving labels from bottom to top.
3. Adjusting Label Padding
When moving labels from bottom to top without adding ticks in Matplotlib, you might need to adjust the padding between the labels and the plot area. This can be achieved using the labelpad parameter.
Here’s an example:
import matplotlib.pyplot as plt

fig, ax = plt.subplots()
ax.plot([1, 2, 3, 4], [1, 4, 2, 3])
ax.set_xlabel('X-axis (how2matplotlib.com)', labelpad=15)
ax.set_ylabel('Y-axis (how2matplotlib.com)')

# Move labels to the top
ax.xaxis.set_tick_params(top=True, bottom=False, labeltop=True, labelbottom=False)
ax.xaxis.set_label_position('top')

plt.show()
Output:
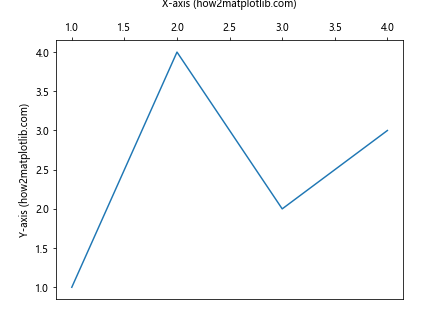
In this example, we use labelpad=15 when setting the x-axis label. This increases the space between the label and the plot area, which can be useful when moving labels to the top to prevent overlap with tick labels.
Handling Special Cases When Moving Labels
1. Moving Labels in Subplots
When working with subplots and moving labels from bottom to top without adding ticks in Matplotlib, you might need to adjust each subplot individually. Here’s an example of how to handle this:
import matplotlib.pyplot as plt

fig, (ax1, ax2) = plt.subplots(2, 1, figsize=(8, 8))

ax1.plot([1, 2, 3, 4], [1, 4, 2, 3])
ax1.set_xlabel('X-axis (how2matplotlib.com)')
ax1.set_ylabel('Y-axis 1 (how2matplotlib.com)')

ax2.plot([1, 2, 3, 4], [3, 1, 4, 2])
ax2.set_xlabel('X-axis (how2matplotlib.com)')
ax2.set_ylabel('Y-axis 2 (how2matplotlib.com)')

# Move labels to the top for both subplots
for ax in (ax1, ax2):
    ax.xaxis.set_tick_params(top=True, bottom=False, labeltop=True, labelbottom=False)
    ax.xaxis.set_label_position('top')

plt.tight_layout()
plt.show()
Output:
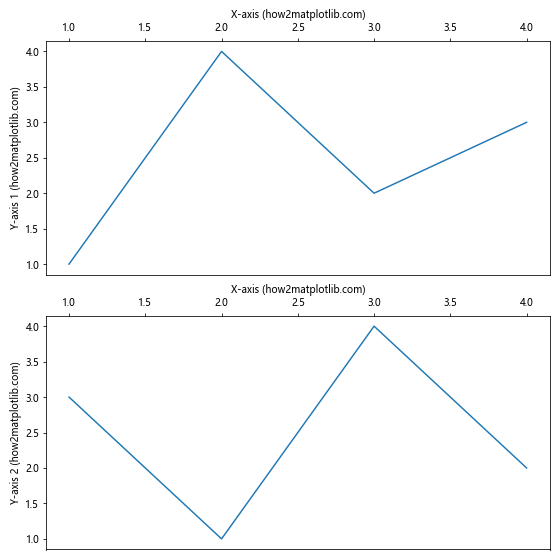
In this example, we create two subplots and use a loop to apply the label moving technique to both axes. This ensures consistency across all subplots in your figure.
2. Handling Date Axes
When dealing with date axes and moving labels from bottom to top without adding ticks in Matplotlib, you might need to use specialized formatters. Here’s an example:
import matplotlib.pyplot as plt
import matplotlib.dates as mdates
from datetime import datetime, timedelta

dates = [datetime(2023, 1, 1) + timedelta(days=i) for i in range(10)]
values = [1, 3, 2, 4, 3, 5, 4, 6, 5, 7]

fig, ax = plt.subplots()
ax.plot(dates, values)

ax.set_xlabel('Date (how2matplotlib.com)')
ax.set_ylabel('Value (how2matplotlib.com)')

# Format x-axis as dates
ax.xaxis.set_major_formatter(mdates.DateFormatter('%Y-%m-%d'))
plt.xticks(rotation=45)

# Move labels to the top
ax.xaxis.set_tick_params(top=True, bottom=False, labeltop=True, labelbottom=False)
ax.xaxis.set_label_position('top')

plt.tight_layout()
plt.show()
Output:
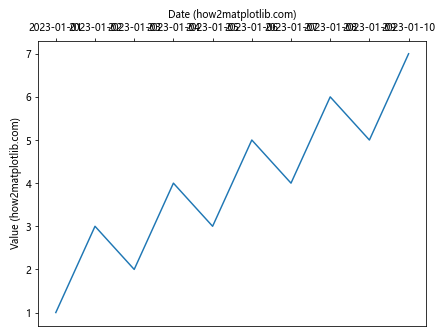
In this example, we use mdates.DateFormatter to format the x-axis labels as dates. We also rotate the labels for better readability when moved to the top.
3. Handling Logarithmic Scales
Moving labels from bottom to top without adding ticks in Matplotlib can be tricky with logarithmic scales. Here’s how to handle this scenario:
import matplotlib.pyplot as plt
import numpy as np

fig, ax = plt.subplots()

x = np.logspace(0, 2, 20)
y = x**2

ax.loglog(x, y)
ax.set_xlabel('X-axis (log scale) (how2matplotlib.com)')
ax.set_ylabel('Y-axis (log scale) (how2matplotlib.com)')

# Move labels to the top
ax.xaxis.set_tick_params(top=True, bottom=False, labeltop=True, labelbottom=False)
ax.xaxis.set_label_position('top')

plt.show()
Output:
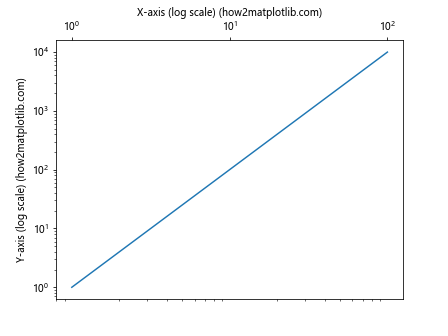
In this example, we create a log-log plot and move the x-axis labels to the top. The logarithmic scale is maintained, and the labels are correctly positioned at the top of the plot.
Best Practices for Moving Labels Without Adding Ticks
When moving labels from bottom to top without adding ticks in Matplotlib, it’s important to follow some best practices to ensure your plots are clear and professional-looking.
1. Consistency Across Plots
If you’re creating multiple plots in a single document or presentation, it’s crucial to maintain consistency in label positioning. Here’s an example of how to create a function that applies consistent label moving across multiple plots:
import matplotlib.pyplot as plt

def move_labels_to_top(ax):
    ax.xaxis.set_tick_params(top=True, bottom=False, labeltop=True, labelbottom=False)
    ax.xaxis.set_label_position('top')

fig, (ax1, ax2) = plt.subplots(1, 2, figsize=(12, 5))

ax1.plot([1, 2, 3, 4], [1, 4, 2, 3])
ax1.set_xlabel('X-axis 1 (how2matplotlib.com)')
ax1.set_ylabel('Y-axis 1 (how2matplotlib.com)')

ax2.plot([1, 2, 3, 4], [3, 1, 4, 2])
ax2.set_xlabel('X-axis 2 (how2matplotlib.com)')
ax2.set_ylabel('Y-axis 2 (how2matplotlib.com)')

# Apply consistent label moving
move_labels_to_top(ax1)
move_labels_to_top(ax2)

plt.tight_layout()
plt.show()
Output:
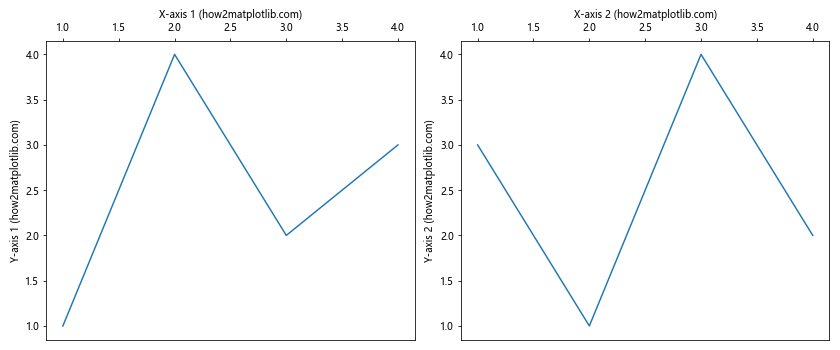
This function encapsulates the label moving logic, making it easy to apply consistently across multiple plots.
2. Handling Overlapping Labels
When moving labels from bottom to top without adding ticks in Matplotlib, you might encounter overlapping labels, especially with long text or dense data. Here’s a technique to handle this issue:
import matplotlib.pyplot as plt

fig, ax = plt.subplots(figsize=(10, 6))

x = list(range(10))
y = [1, 4, 2, 7, 5, 9, 3, 8, 6, 10]

ax.plot(x, y)
ax.set_xlabel('Long X-axis Label (how2matplotlib.com)')
ax.set_ylabel('Y-axis (how2matplotlib.com)')

# Move labels to the top
ax.xaxis.set_tick_params(top=True, bottom=False, labeltop=True, labelbottom=False)
ax.xaxis.set_label_position('top')

# Rotate labels to prevent overlap
plt.xticks(rotation=45, ha='left')

plt.tight_layout()
plt.show()
Output:
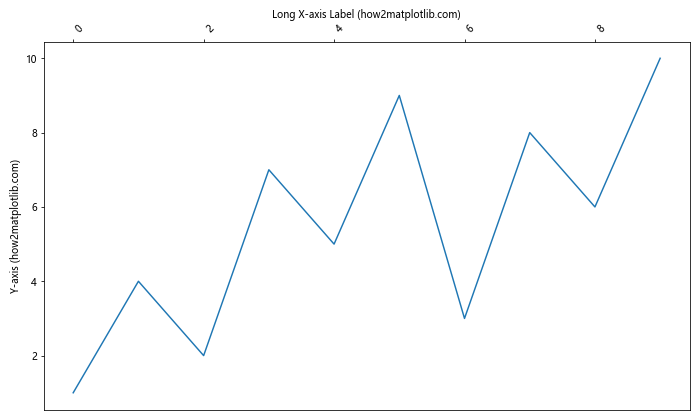
In this example, we rotate the x-axis tick labels to prevent overlap when moved to the top. The ha='left' parameter aligns the rotated labels for better readability.
3. Adjusting Figure Size and Layout
When moving labels from bottom to top without adding ticks in Matplotlib, you might need to adjust the figure size and layout to accommodate the new label positions. Here’s an example:
import matplotlib.pyplot as plt

fig, ax = plt.subplots(figsize=(8, 6))

ax.plot([1, 2, 3, 4], [1, 4, 2, 3])
ax.set_xlabel('X-axis (how2matplotlib.com)')
ax.set_ylabel('Y-axis (how2matplotlib.com)')

# Move labels to the top
ax.xaxis.set_tick_params(top=True, bottom=False, labeltop=True, labelbottom=False)
ax.xaxis.set_label_position('top')

# Adjust layout
plt.tight_layout()

# Add extra space at the top for labels
plt.subplots_adjust(top=0.85)

plt.show()
Output:
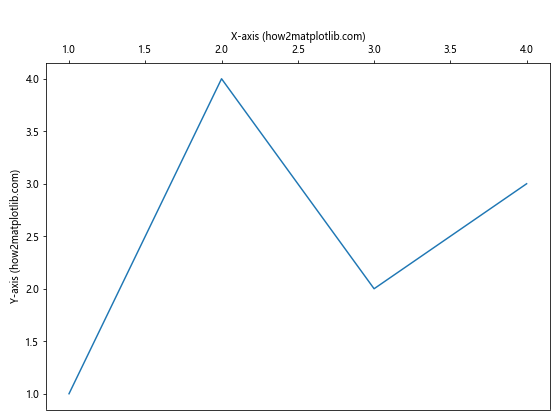
In this example, we use plt.tight_layout() to automatically adjust the plot layout, and then plt.subplots_adjust(top=0.85) to add extra space at the top of the figure for the moved labels.
Advanced Customization When Moving Labels
1. Custom Tick Formatters
When moving labels from bottom to top without adding ticks in Matplotlib, you might want to customize the format of the tick labels. Here’s an example using a custom formatter:
import matplotlib.pyplot as plt
from matplotlib.ticker import FuncFormatter

def custom_formatter(x, pos):
    return f'Value: {x:.2f} (how2matplotlib.com)'

fig, ax = plt.subplots()

ax.plot([1, 2, 3, 4], [1, 4, 2, 3])
ax.set_xlabel('X-axis (how2matplotlib.com)')
ax.set_ylabel('Y-axis (how2matplotlib.com)')

# Apply custom formatter
ax.xaxis.set_major_formatter(FuncFormatter(custom_formatter))

# Move labels to the top
ax.xaxis.set_tick_params(top=True, bottom=False, labeltop=True, labelbottom=False)
ax.xaxis.set_label_position('top')

plt.tight_layout()
plt.show()
Output:
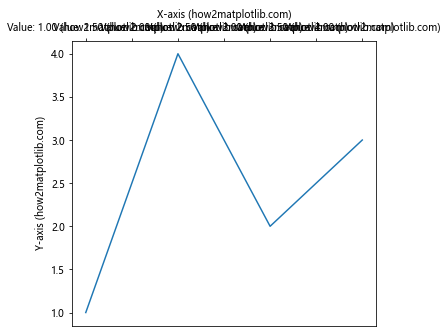
This example uses a FuncFormatter to create custom tick labels when moving them to the top of the plot.
2. Styling Moved Labels
When moving labels from bottom to top without adding ticks in Matplotlib, you might want to apply special styling to emphasize the new position. Here’s how you can do that:
import matplotlib.pyplot as plt

fig, ax = plt.subplots()

ax.plot([1, 2, 3, 4], [1, 4, 2, 3])
ax.set_xlabel('X-axis (how2matplotlib.com)', fontweight='bold', color='red')
ax.set_ylabel('Y-axis (how2matplotlib.com)')

# Move labels to the top with custom styling
ax.xaxis.set_tick_params(top=True, bottom=False, labeltop=True, labelbottom=False,
                         colors='blue', labelsize=12)
ax.xaxis.set_label_position('top')

plt.show()
Output:
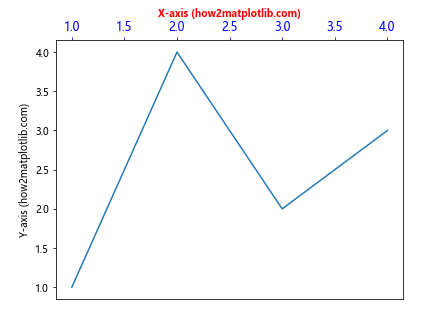
In this example, we apply custom colors and font weights to the moved labels, making them stand out in their new position at the top of the plot.
3. Handling Multiple X-axes
When moving labels from bottom to top without adding ticks in Matplotlib, you might encounter situations where you need multiple x-axes. Here’s how to handle this scenario:
import matplotlib.pyplot as plt
import numpy as np

fig, ax1 = plt.subplots()

x = np.linspace(0, 10, 100)
y1 = np.sin(x)
y2 = np.cos(x)

ax1.plot(x, y1, 'b-', label='sin(x)')
ax1.set_xlabel('X-axis (how2matplotlib.com)')
ax1.set_ylabel('sin(x) (how2matplotlib.com)', color='b')

# Create a twin axis
ax2 = ax1.twiny()
ax2.plot(x, y2, 'r-', label='cos(x)')
ax2.set_xlabel('X-axis (cos) (how2matplotlib.com)')
ax2.set_ylabel('cos(x) (how2matplotlib.com)', color='r')

# Move labels to the top for both axes
ax1.xaxis.set_tick_params(top=True, bottom=False, labeltop=True, labelbottom=False)
ax1.xaxis.set_label_position('top')

ax2.xaxis.set_tick_params(labeltop=True)
ax2.xaxis.set_label_position('top')

plt.tight_layout()
plt.show()
Output:
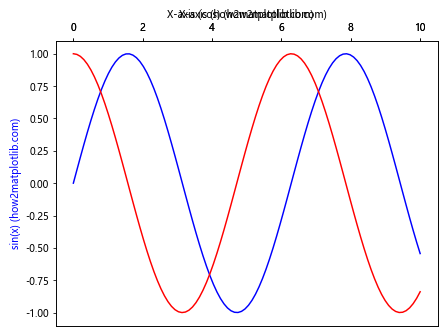
This example demonstrates how to create and style multiple x-axes when moving labels to the top of the plot.
Troubleshooting Common Issues When Moving Labels
1. Dealing with Clipping
When moving labels from bottom to top without adding ticks in Matplotlib, you might encounter clipping issues where parts of the labels are cut off. Here’s how to address this problem:
import matplotlib.pyplot as plt

fig, ax = plt.subplots()

ax.plot([1, 2, 3, 4], [1, 4, 2, 3])
ax.set_xlabel('Very Long X-axis Label (how2matplotlib.com)')
ax.set_ylabel('Y-axis (how2matplotlib.com)')

# Move labels to the top
ax.xaxis.set_tick_params(top=True, bottom=False, labeltop=True, labelbottom=False)
ax.xaxis.set_label_position('top')

# Adjust layout to prevent clipping
plt.tight_layout()
plt.subplots_adjust(top=0.85)

# Ensure labels are not clipped
ax.set_clip_on(False)
ax.xaxis.set_clip_on(False)

plt.show()
Output:
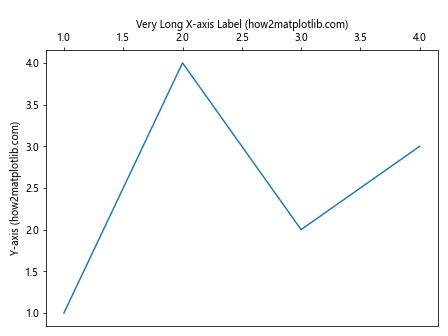
In this example, we use ax.set_clip_on(False) and ax.xaxis.set_clip_on(False) to prevent the labels from being clipped when moved to the top of the plot.
2. Handling Long Labels
When moving labels from bottom to top without adding ticks in Matplotlib, long labels can be particularly challenging. Here’s a technique to handle this:
import matplotlib.pyplot as plt
import textwrap

fig, ax = plt.subplots()

ax.plot([1, 2, 3, 4], [1, 4, 2, 3])

long_label = "This is a very long x-axis label that needs to be wrapped (how2matplotlib.com)"
wrapped_label = textwrap.fill(long_label, 20)  # Wrap after 20 characters

ax.set_xlabel(wrapped_label)
ax.set_ylabel('Y-axis (how2matplotlib.com)')

# Move labels to the top
ax.xaxis.set_tick_params(top=True, bottom=False, labeltop=True, labelbottom=False)
ax.xaxis.set_label_position('top')

plt.tight_layout()
plt.subplots_adjust(top=0.8)  # Add extra space for the wrapped label
plt.show()
Output:
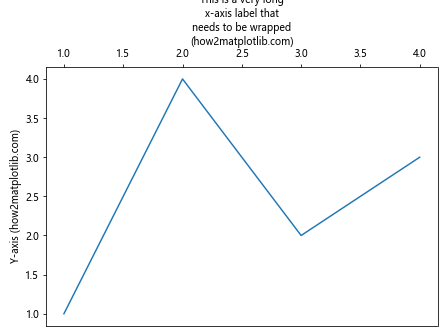
This example uses the textwrap module to wrap long labels, making them more manageable when moved to the top of the plot.
3. Fixing Misaligned Labels
Sometimes when moving labels from bottom to top without adding ticks in Matplotlib, you might notice that the labels become misaligned. Here’s how to fix this issue:
import matplotlib.pyplot as plt

fig, ax = plt.subplots()

ax.plot([1, 2, 3, 4], [1, 4, 2, 3])
ax.set_xlabel('X-axis (how2matplotlib.com)')
ax.set_ylabel('Y-axis (how2matplotlib.com)')

# Move labels to the top
ax.xaxis.set_tick_params(top=True, bottom=False, labeltop=True, labelbottom=False)
ax.xaxis.set_label_position('top')

# Adjust label alignment
ax.xaxis.set_label_coords(0.5, 1.05)  # Center the label horizontally and move it up

plt.tight_layout()
plt.show()
Output:
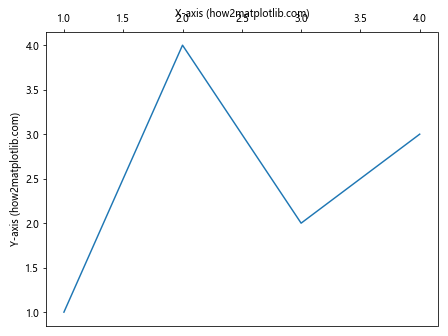
In this example, we use ax.xaxis.set_label_coords(0.5, 1.05) to precisely position the x-axis label, ensuring it’s centered and properly aligned when moved to the top.
Conclusion
Moving labels from bottom to top without adding ticks in Matplotlib is a powerful technique for customizing your plots and creating unique visualizations. Throughout this article, we’ve explored various methods and best practices for achieving this effect, from basic techniques to advanced customizations.
We’ve covered how to use tick_params and set_label_position to move labels, how to handle special cases like subplots and date axes, and how to troubleshoot common issues that may arise. By following these techniques and examples, you’ll be well-equipped to create professional-looking plots with top-positioned labels in Matplotlib.
Remember to always consider the context of your data and the purpose of your visualization when deciding to move labels. While it can be an effective way to highlight certain aspects of your plot, it’s important to ensure that the resulting visualization remains clear and easy to interpret.