Comprehensive Guide to Using Matplotlib.artist.Artist.set() in Python for Data Visualization
Matplotlib.artist.Artist.set() in Python is a powerful method that allows you to modify multiple properties of an Artist object simultaneously. This function is an essential tool for customizing and fine-tuning your data visualizations in Matplotlib. In this comprehensive guide, we’ll explore the various aspects of Matplotlib.artist.Artist.set() and how it can enhance your plotting capabilities.
Understanding Matplotlib.artist.Artist.set() Basics
Matplotlib.artist.Artist.set() is a method that belongs to the Artist class in Matplotlib. It provides a convenient way to set multiple properties of an Artist object in a single function call. This can significantly simplify your code and make it more readable when you need to adjust multiple attributes of a plot element.
Let’s start with a simple example to demonstrate the basic usage of Matplotlib.artist.Artist.set():
import matplotlib.pyplot as plt

fig, ax = plt.subplots()
line, = ax.plot([1, 2, 3, 4], [1, 4, 2, 3])
line.set(color='red', linewidth=2, linestyle='--', marker='o', markersize=8)

plt.title('How to use Matplotlib.artist.Artist.set() - how2matplotlib.com')
plt.show()
Output:
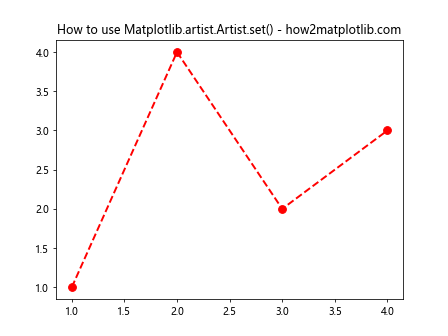
In this example, we create a simple line plot and then use the set() method to modify multiple properties of the line object in a single call. We set the color to red, increase the line width, change the line style to dashed, add circular markers, and adjust the marker size.
Exploring Matplotlib.artist.Artist.set() Parameters
The Matplotlib.artist.Artist.set() method accepts keyword arguments that correspond to the properties you want to modify. These properties can vary depending on the type of Artist object you’re working with. Let’s explore some common parameters:
Color and Style Properties
import matplotlib.pyplot as plt

fig, ax = plt.subplots()
rect = plt.Rectangle((0.2, 0.2), 0.6, 0.6)
ax.add_patch(rect)

rect.set(facecolor='lightblue', edgecolor='navy', linewidth=3, alpha=0.7)

plt.title('Color and Style with Matplotlib.artist.Artist.set() - how2matplotlib.com')
plt.show()
Output:
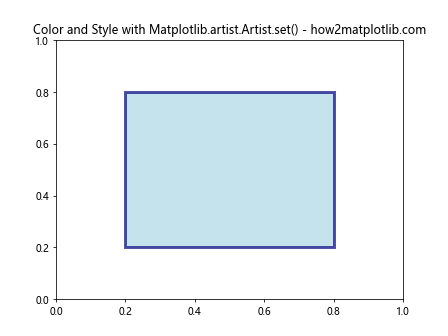
In this example, we create a rectangle and use Matplotlib.artist.Artist.set() to set its face color, edge color, line width, and transparency (alpha) all at once.
Text Properties
import matplotlib.pyplot as plt

fig, ax = plt.subplots()
text = ax.text(0.5, 0.5, 'Matplotlib.artist.Artist.set()')

text.set(fontsize=16, fontweight='bold', color='green', ha='center', va='center')

plt.title('Text Properties with Matplotlib.artist.Artist.set() - how2matplotlib.com')
plt.show()
Output:
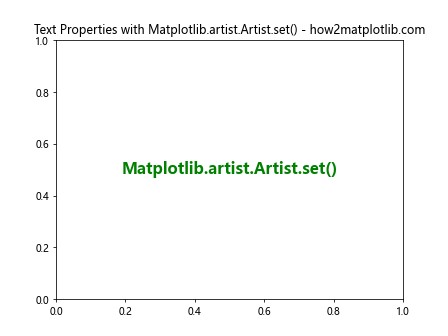
Here, we create a text object and use Matplotlib.artist.Artist.set() to adjust its font size, font weight, color, and alignment properties.
Advanced Usage of Matplotlib.artist.Artist.set()
Matplotlib.artist.Artist.set() can be used with various types of Artist objects in Matplotlib. Let’s explore some more advanced use cases:
Customizing Axes with Matplotlib.artist.Artist.set()
import matplotlib.pyplot as plt

fig, ax = plt.subplots()
ax.plot([1, 2, 3, 4], [1, 4, 2, 3])

ax.set(xlabel='X-axis', ylabel='Y-axis', title='Customized Axes',
       xlim=(0, 5), ylim=(0, 5), xticks=[0, 1, 2, 3, 4, 5],
       yticks=[0, 1, 2, 3, 4, 5], facecolor='lightyellow')

plt.title('Customizing Axes with Matplotlib.artist.Artist.set() - how2matplotlib.com')
plt.show()
Output:
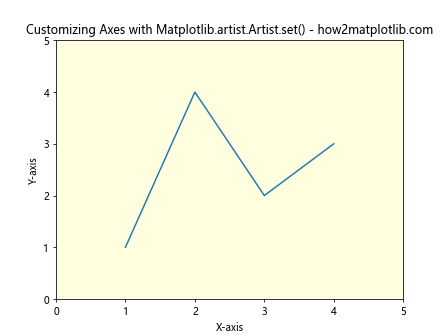
In this example, we use Matplotlib.artist.Artist.set() to customize various properties of the axes, including labels, limits, ticks, and background color.
Modifying Multiple Artists at Once
import matplotlib.pyplot as plt

fig, ax = plt.subplots()
line1, = ax.plot([1, 2, 3, 4], [1, 4, 2, 3], label='Line 1')
line2, = ax.plot([1, 2, 3, 4], [3, 2, 4, 1], label='Line 2')

for line in [line1, line2]:
    line.set(linewidth=2, marker='o', markersize=8)

plt.title('Modifying Multiple Artists with Matplotlib.artist.Artist.set() - how2matplotlib.com')
plt.legend()
plt.show()
Output:
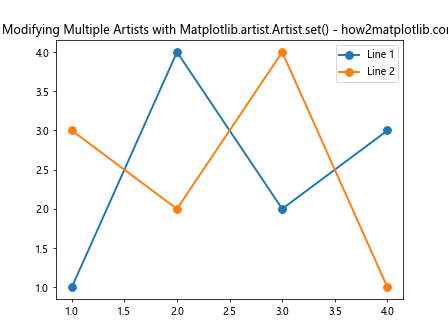
This example demonstrates how to use Matplotlib.artist.Artist.set() to modify properties of multiple line objects in a loop, ensuring consistent styling across different plot elements.
Matplotlib.artist.Artist.set() and Plot Types
Matplotlib.artist.Artist.set() can be applied to various types of plots. Let’s explore how it can be used with different plot types:
Scatter Plots
import matplotlib.pyplot as plt
import numpy as np

fig, ax = plt.subplots()
x = np.random.rand(50)
y = np.random.rand(50)
colors = np.random.rand(50)
sizes = 1000 * np.random.rand(50)

scatter = ax.scatter(x, y, c=colors, s=sizes, alpha=0.5)
scatter.set(edgecolors='black', linewidth=1)

plt.title('Scatter Plot with Matplotlib.artist.Artist.set() - how2matplotlib.com')
plt.colorbar(scatter)
plt.show()
Output:
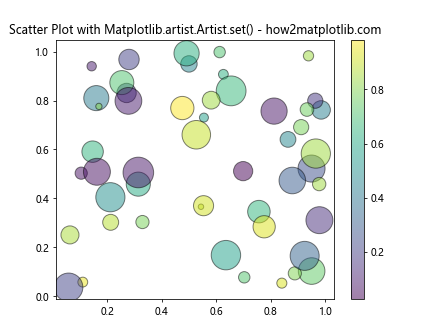
In this example, we create a scatter plot and use Matplotlib.artist.Artist.set() to add black edges to the scatter points and adjust their line width.
Bar Plots
import matplotlib.pyplot as plt

fig, ax = plt.subplots()
x = ['A', 'B', 'C', 'D']
y = [3, 7, 2, 5]

bars = ax.bar(x, y)
for bar in bars:
    bar.set(edgecolor='black', linewidth=2, facecolor='lightblue', alpha=0.8)

plt.title('Bar Plot with Matplotlib.artist.Artist.set() - how2matplotlib.com')
plt.show()
Output:
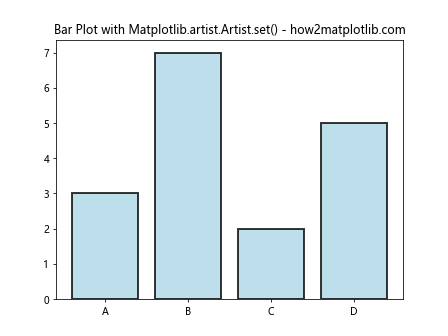
Here, we create a bar plot and use Matplotlib.artist.Artist.set() to customize the appearance of each bar, including edge color, line width, face color, and transparency.
Matplotlib.artist.Artist.set() and Subplots
Matplotlib.artist.Artist.set() can be particularly useful when working with subplots. Let’s see how we can use it to customize multiple subplots:
import matplotlib.pyplot as plt

fig, (ax1, ax2) = plt.subplots(1, 2, figsize=(12, 5))

line1, = ax1.plot([1, 2, 3, 4], [1, 4, 2, 3])
line2, = ax2.plot([1, 2, 3, 4], [3, 2, 4, 1])

line1.set(color='red', linewidth=2, linestyle='--', marker='o', markersize=8)
line2.set(color='blue', linewidth=2, linestyle=':', marker='s', markersize=8)

for ax in (ax1, ax2):
    ax.set(xlabel='X-axis', ylabel='Y-axis', title='Subplot',
           xlim=(0, 5), ylim=(0, 5))

fig.suptitle('Subplots with Matplotlib.artist.Artist.set() - how2matplotlib.com', fontsize=16)
plt.tight_layout()
plt.show()
Output:
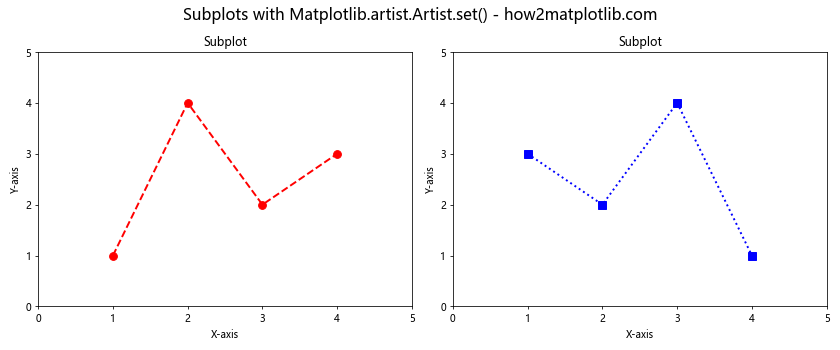
In this example, we create two subplots and use Matplotlib.artist.Artist.set() to customize the lines in each subplot separately. We also use it to set common properties for both axes.
Matplotlib.artist.Artist.set() and Animation
Matplotlib.artist.Artist.set() can be particularly useful when creating animations. Let’s see how we can use it in an animated plot:
import matplotlib.pyplot as plt
import matplotlib.animation as animation
import numpy as np

fig, ax = plt.subplots()
x = np.linspace(0, 2*np.pi, 100)
line, = ax.plot(x, np.sin(x))

def animate(i):
    line.set_ydata(np.sin(x + i/10))
    return line,

ani = animation.FuncAnimation(fig, animate, frames=100, interval=50, blit=True)

ax.set(xlim=(0, 2*np.pi), ylim=(-1, 1))
plt.title('Animation with Matplotlib.artist.Artist.set() - how2matplotlib.com')
plt.show()
Output:
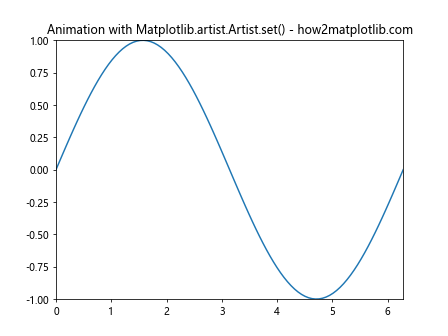
In this animation example, we use the set_ydata() method (which is similar to Matplotlib.artist.Artist.set()) to update the y-data of the line in each frame of the animation.
Matplotlib.artist.Artist.set() and 3D Plots
Matplotlib.artist.Artist.set() can also be used with 3D plots. Here’s an example:
import matplotlib.pyplot as plt
import numpy as np

fig = plt.figure()
ax = fig.add_subplot(111, projection='3d')

theta = np.linspace(-4 * np.pi, 4 * np.pi, 100)
z = np.linspace(-2, 2, 100)
r = z**2 + 1
x = r * np.sin(theta)
y = r * np.cos(theta)

line, = ax.plot(x, y, z)
line.set(linewidth=2, color='red')

ax.set(xlabel='X', ylabel='Y', zlabel='Z')
plt.title('3D Plot with Matplotlib.artist.Artist.set() - how2matplotlib.com')
plt.show()
Output:
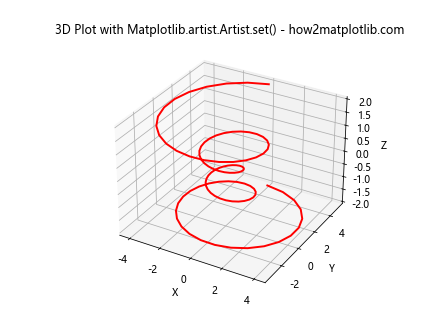
In this 3D plot example, we use Matplotlib.artist.Artist.set() to customize the appearance of the 3D line.
Matplotlib.artist.Artist.set() and Colormaps
Matplotlib.artist.Artist.set() can be used to modify colormap properties in plots. Here’s an example:
import matplotlib.pyplot as plt
import numpy as np

fig, ax = plt.subplots()
x = np.linspace(0, 5, 100)
y = np.linspace(0, 5, 100)
X, Y = np.meshgrid(x, y)
Z = np.sin(X) * np.cos(Y)

im = ax.imshow(Z, cmap='viridis', extent=[0, 5, 0, 5])
im.set(interpolation='nearest', alpha=0.8)

plt.colorbar(im)
plt.title('Colormap with Matplotlib.artist.Artist.set() - how2matplotlib.com')
plt.show()
Output:
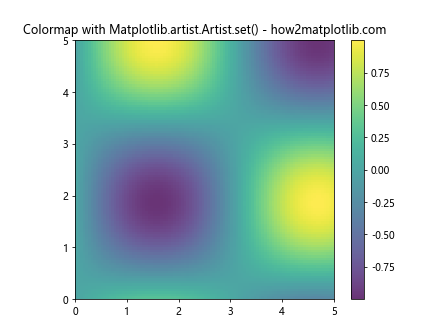
In this example, we use Matplotlib.artist.Artist.set() to adjust the interpolation method and transparency of the image plot.
Matplotlib.artist.Artist.set() and Error Bars
Matplotlib.artist.Artist.set() can be used to customize error bars in plots. Here’s an example:
import matplotlib.pyplot as plt
import numpy as np

fig, ax = plt.subplots()
x = np.linspace(0, 10, 50)
y = np.sin(x)
yerr = 0.1 + 0.2 * np.random.rand(len(x))

errorbar = ax.errorbar(x, y, yerr=yerr, fmt='o')
errorbar[0].set(color='red', markersize=6)
errorbar[1][0].set(color='blue', linewidth=2)
errorbar[2][0].set(color='green', linewidth=2)

plt.title('Error Bars with Matplotlib.artist.Artist.set() - how2matplotlib.com')
plt.show()
In this example, we use Matplotlib.artist.Artist.set() to customize the appearance of different components of the error bars, including the markers, error bar lines, and caps.
Conclusion
Matplotlib.artist.Artist.set() is a versatile and powerful method that allows you to efficiently customize various aspects of your Matplotlib plots. By using this method, you can simplify your code and create more visually appealing and informative data visualizations. Whether you’re working with simple line plots, complex 3D visualizations, or animated graphs, Matplotlib.artist.Artist.set() provides a convenient way to fine-tune your plots to meet your specific needs.