Comprehensive Guide to Using Matplotlib.artist.Artist.set_alpha() in Python for Transparency Control
Matplotlib.artist.Artist.set_alpha() in Python is a powerful method used to control the transparency of various elements in Matplotlib plots. This function is an essential tool for data visualization enthusiasts and professionals alike. In this comprehensive guide, we’ll explore the ins and outs of Matplotlib.artist.Artist.set_alpha(), providing detailed explanations and practical examples to help you master this crucial aspect of plot customization.
Understanding Matplotlib.artist.Artist.set_alpha()
Matplotlib.artist.Artist.set_alpha() is a method that belongs to the Artist class in Matplotlib. It allows you to set the alpha (transparency) value for any Artist object in your plot. The alpha value ranges from 0 (completely transparent) to 1 (completely opaque). This method is incredibly versatile and can be applied to various plot elements, including lines, markers, patches, and text.
Let’s start with a simple example to demonstrate how Matplotlib.artist.Artist.set_alpha() works:
import matplotlib.pyplot as plt

fig, ax = plt.subplots()
circle = plt.Circle((0.5, 0.5), 0.2, color='blue')
circle.set_alpha(0.5)
ax.add_artist(circle)
ax.set_xlim(0, 1)
ax.set_ylim(0, 1)
ax.set_title('Matplotlib.artist.Artist.set_alpha() Example - how2matplotlib.com')
plt.show()
Output:
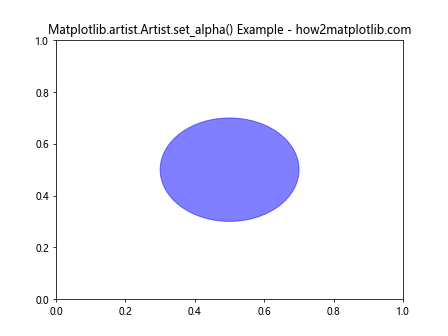
In this example, we create a blue circle and set its alpha value to 0.5 using Matplotlib.artist.Artist.set_alpha(). This results in a semi-transparent circle on the plot.
Applying Matplotlib.artist.Artist.set_alpha() to Different Plot Elements
Matplotlib.artist.Artist.set_alpha() can be used with various plot elements. Let’s explore how to apply it to different types of artists.
Lines
You can use Matplotlib.artist.Artist.set_alpha() to adjust the transparency of lines in your plots:
import matplotlib.pyplot as plt
import numpy as np

x = np.linspace(0, 10, 100)
y1 = np.sin(x)
y2 = np.cos(x)

fig, ax = plt.subplots()
line1, = ax.plot(x, y1, color='red', label='Sin')
line2, = ax.plot(x, y2, color='blue', label='Cos')

line1.set_alpha(0.7)
line2.set_alpha(0.3)

ax.set_title('Matplotlib.artist.Artist.set_alpha() on Lines - how2matplotlib.com')
ax.legend()
plt.show()
Output:
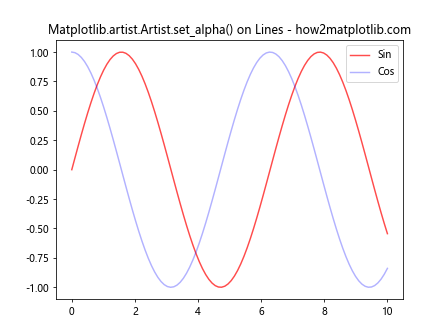
In this example, we create two lines representing sine and cosine functions. We then use Matplotlib.artist.Artist.set_alpha() to set different transparency levels for each line.
Markers
Matplotlib.artist.Artist.set_alpha() can also be applied to markers in scatter plots:
import matplotlib.pyplot as plt
import numpy as np

x = np.random.rand(50)
y = np.random.rand(50)

fig, ax = plt.subplots()
scatter = ax.scatter(x, y, s=100, c='purple')
scatter.set_alpha(0.5)

ax.set_title('Matplotlib.artist.Artist.set_alpha() on Markers - how2matplotlib.com')
plt.show()
Output:
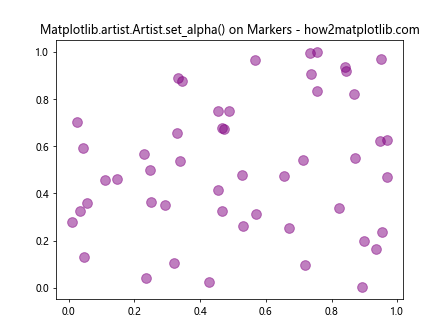
Here, we create a scatter plot and use Matplotlib.artist.Artist.set_alpha() to set the transparency of all markers to 0.5.
Patches
Patches, such as rectangles and polygons, can also benefit from Matplotlib.artist.Artist.set_alpha():
import matplotlib.pyplot as plt
import matplotlib.patches as patches

fig, ax = plt.subplots()

rect1 = patches.Rectangle((0.1, 0.1), 0.5, 0.5, color='red')
rect2 = patches.Rectangle((0.3, 0.3), 0.5, 0.5, color='blue')

rect1.set_alpha(0.7)
rect2.set_alpha(0.5)

ax.add_patch(rect1)
ax.add_patch(rect2)

ax.set_xlim(0, 1)
ax.set_ylim(0, 1)
ax.set_title('Matplotlib.artist.Artist.set_alpha() on Patches - how2matplotlib.com')
plt.show()
Output:
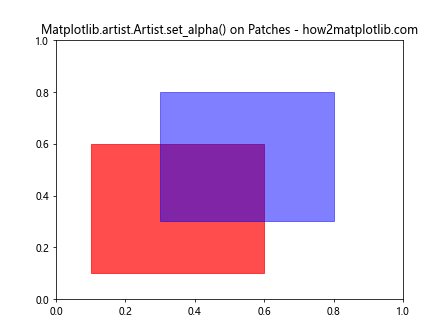
In this example, we create two overlapping rectangles and use Matplotlib.artist.Artist.set_alpha() to set different transparency levels for each.
Text
Text elements in Matplotlib can also have their transparency adjusted using Matplotlib.artist.Artist.set_alpha():
import matplotlib.pyplot as plt

fig, ax = plt.subplots()

text1 = ax.text(0.2, 0.8, 'Opaque Text', fontsize=20)
text2 = ax.text(0.2, 0.5, 'Semi-transparent Text', fontsize=20)
text3 = ax.text(0.2, 0.2, 'Very transparent Text', fontsize=20)

text1.set_alpha(1.0)
text2.set_alpha(0.5)
text3.set_alpha(0.2)

ax.set_xlim(0, 1)
ax.set_ylim(0, 1)
ax.set_title('Matplotlib.artist.Artist.set_alpha() on Text - how2matplotlib.com')
plt.show()
Output:
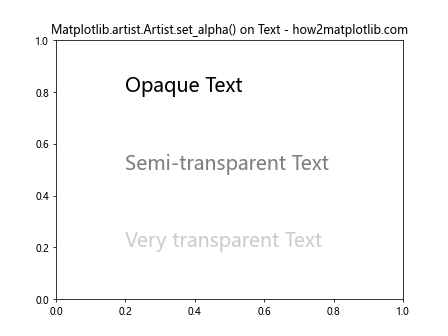
This example demonstrates how to use Matplotlib.artist.Artist.set_alpha() to set different transparency levels for text elements in a plot.
Advanced Usage of Matplotlib.artist.Artist.set_alpha()
Now that we’ve covered the basics, let’s explore some more advanced applications of Matplotlib.artist.Artist.set_alpha().
Animating Transparency
You can create interesting animations by dynamically changing the alpha value:
import matplotlib.pyplot as plt
import matplotlib.animation as animation
import numpy as np

fig, ax = plt.subplots()
x = np.linspace(0, 2*np.pi, 100)
line, = ax.plot(x, np.sin(x))

def animate(frame):
    alpha = (np.sin(frame/10) + 1) / 2  # Oscillate between 0 and 1
    line.set_alpha(alpha)
    return line,

ani = animation.FuncAnimation(fig, animate, frames=200, interval=50, blit=True)
ax.set_title('Animated Transparency with Matplotlib.artist.Artist.set_alpha() - how2matplotlib.com')
plt.show()
Output:
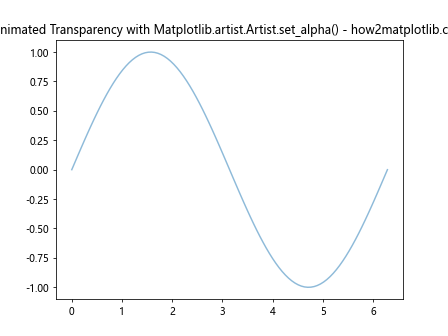
This example creates an animation where the transparency of a sine wave oscillates over time using Matplotlib.artist.Artist.set_alpha().
Gradient Transparency
You can create a gradient effect by applying different alpha values to different parts of a plot:
import matplotlib.pyplot as plt
import numpy as np

x = np.linspace(0, 10, 100)
y = np.sin(x)

fig, ax = plt.subplots()
for i in range(len(x)-1):
    segment = ax.plot(x[i:i+2], y[i:i+2], color='blue')
    alpha = i / len(x)
    segment[0].set_alpha(alpha)

ax.set_title('Gradient Transparency with Matplotlib.artist.Artist.set_alpha() - how2matplotlib.com')
plt.show()
Output:
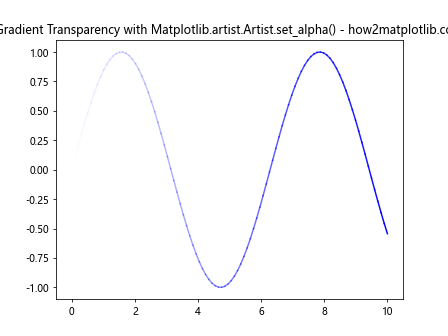
In this example, we create a gradient effect on a sine wave by applying increasingly higher alpha values to each segment of the line using Matplotlib.artist.Artist.set_alpha().
Transparency in 3D Plots
Matplotlib.artist.Artist.set_alpha() can also be used in 3D plots:
import matplotlib.pyplot as plt
import numpy as np
from mpl_toolkits.mplot3d import Axes3D

fig = plt.figure()
ax = fig.add_subplot(111, projection='3d')

x = np.random.rand(100)
y = np.random.rand(100)
z = np.random.rand(100)

scatter = ax.scatter(x, y, z, c='red', s=50)
scatter.set_alpha(0.3)

ax.set_title('3D Plot with Matplotlib.artist.Artist.set_alpha() - how2matplotlib.com')
plt.show()
Output:
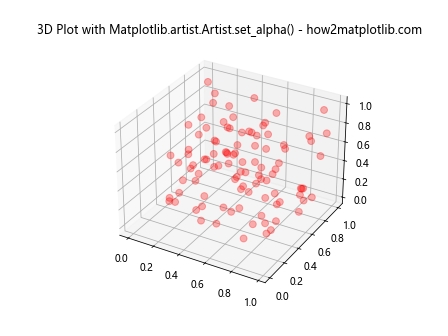
This example demonstrates how to use Matplotlib.artist.Artist.set_alpha() to set the transparency of points in a 3D scatter plot.
Best Practices for Using Matplotlib.artist.Artist.set_alpha()
When working with Matplotlib.artist.Artist.set_alpha(), keep these best practices in mind:
- Choose appropriate alpha values: Values between 0.2 and 0.8 are often most effective for visualization.
Consider color interactions: Remember that transparency can affect how colors appear when overlapping.
Use transparency purposefully: Apply Matplotlib.artist.Artist.set_alpha() to highlight important data or de-emphasize less critical information.
Be consistent: When using transparency across multiple plots, maintain consistent alpha values for similar elements.
Test different values: Experiment with various alpha values to find the best balance for your specific visualization needs.
Let’s see an example that incorporates these best practices: