Comprehensive Guide to Matplotlib.axis.Axis.set_minor_formatter() Function in Python
Matplotlib.axis.Axis.set_minor_formatter() function in Python is a powerful tool for customizing the appearance of minor tick labels on plot axes. This function allows you to set a custom formatter for the minor ticks, giving you fine-grained control over how these labels are displayed. In this comprehensive guide, we’ll explore the Matplotlib.axis.Axis.set_minor_formatter() function in depth, covering its usage, parameters, and various applications in data visualization.
Understanding the Basics of Matplotlib.axis.Axis.set_minor_formatter()
The Matplotlib.axis.Axis.set_minor_formatter() function is part of the Matplotlib library, which is widely used for creating static, animated, and interactive visualizations in Python. This particular function is specifically designed to work with the Axis object, allowing you to customize the formatting of minor tick labels.
Let’s start with a simple example to illustrate the basic usage of Matplotlib.axis.Axis.set_minor_formatter():
import matplotlib.pyplot as plt
import matplotlib.ticker as ticker

fig, ax = plt.subplots(figsize=(10, 6))

# Create some sample data
x = range(0, 100, 10)
y = [i**2 for i in x]

ax.plot(x, y, label='how2matplotlib.com')

# Set minor ticks
ax.xaxis.set_minor_locator(ticker.AutoMinorLocator())

# Set custom formatter for minor ticks
def minor_formatter(x, pos):
    return f'Minor: {x:.1f}'

ax.xaxis.set_minor_formatter(ticker.FuncFormatter(minor_formatter))

plt.title('Using Matplotlib.axis.Axis.set_minor_formatter()')
plt.xlabel('X-axis')
plt.ylabel('Y-axis')
plt.legend()
plt.show()
Output:
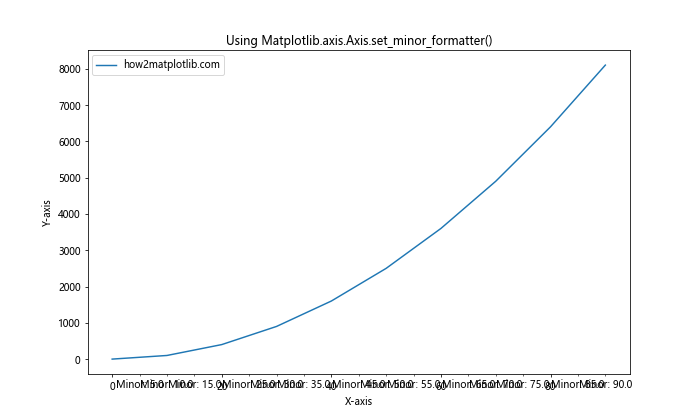
In this example, we’ve created a simple plot and used the Matplotlib.axis.Axis.set_minor_formatter() function to customize the minor tick labels on the x-axis. We defined a custom formatter function that prefixes each minor tick label with “Minor:”.
Parameters of Matplotlib.axis.Axis.set_minor_formatter()
The Matplotlib.axis.Axis.set_minor_formatter() function takes a single parameter:
- formatter: This can be an instance of Formatter or a function that takes two arguments (tick value and position) and returns a string.
Understanding these parameters is crucial for effectively using the Matplotlib.axis.Axis.set_minor_formatter() function. Let’s explore some examples to see how we can use different types of formatters.
Using a Predefined Formatter
Matplotlib provides several predefined formatters that you can use with the Matplotlib.axis.Axis.set_minor_formatter() function. Here’s an example using the StrMethodFormatter:
import matplotlib.pyplot as plt
import matplotlib.ticker as ticker

fig, ax = plt.subplots(figsize=(10, 6))

x = range(0, 100, 10)
y = [i**2 for i in x]

ax.plot(x, y, label='how2matplotlib.com')

ax.xaxis.set_minor_locator(ticker.AutoMinorLocator())

# Use StrMethodFormatter for minor ticks
ax.xaxis.set_minor_formatter(ticker.StrMethodFormatter('{x:.1f}'))

plt.title('Using StrMethodFormatter with Matplotlib.axis.Axis.set_minor_formatter()')
plt.xlabel('X-axis')
plt.ylabel('Y-axis')
plt.legend()
plt.show()
Output:
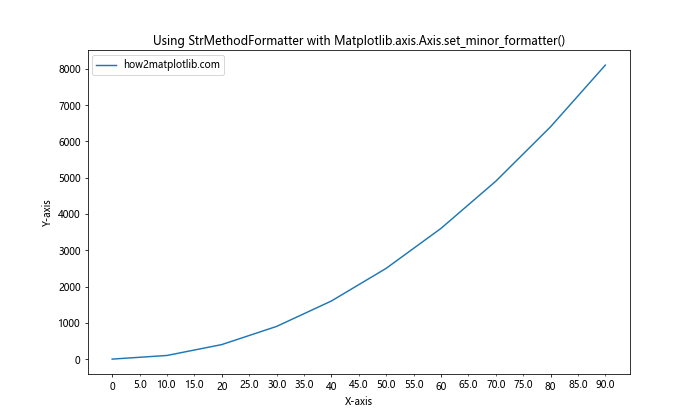
In this example, we’ve used the StrMethodFormatter to format the minor tick labels with one decimal place.
Using a Custom Function Formatter
You can also use a custom function as a formatter. This gives you maximum flexibility in how you want to format your tick labels. Here’s an example:
import matplotlib.pyplot as plt
import matplotlib.ticker as ticker

fig, ax = plt.subplots(figsize=(10, 6))

x = range(0, 100, 10)
y = [i**2 for i in x]

ax.plot(x, y, label='how2matplotlib.com')

ax.xaxis.set_minor_locator(ticker.AutoMinorLocator())

def custom_formatter(x, pos):
    if x % 20 == 0:
        return f'Special: {x}'
    else:
        return f'{x:.1f}'

ax.xaxis.set_minor_formatter(ticker.FuncFormatter(custom_formatter))

plt.title('Custom Formatter with Matplotlib.axis.Axis.set_minor_formatter()')
plt.xlabel('X-axis')
plt.ylabel('Y-axis')
plt.legend()
plt.show()
Output:
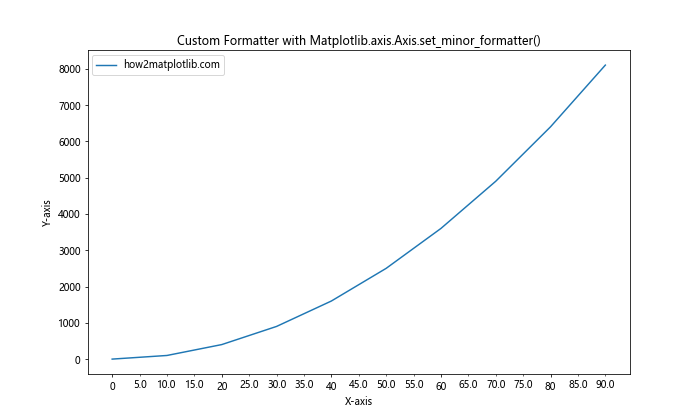
In this example, we’ve created a custom formatter function that labels every 20th tick as “Special” and formats the rest with one decimal place.
Advanced Applications of Matplotlib.axis.Axis.set_minor_formatter()
Now that we’ve covered the basics, let’s explore some more advanced applications of the Matplotlib.axis.Axis.set_minor_formatter() function.
Formatting Date and Time Ticks
The Matplotlib.axis.Axis.set_minor_formatter() function is particularly useful when working with date and time data. Here’s an example of how to format date ticks:
import matplotlib.pyplot as plt
import matplotlib.dates as mdates
from datetime import datetime, timedelta

fig, ax = plt.subplots(figsize=(12, 6))

# Generate some date data
start_date = datetime(2023, 1, 1)
dates = [start_date + timedelta(days=i) for i in range(365)]
values = [i**2 for i in range(365)]

ax.plot(dates, values, label='how2matplotlib.com')

# Set major and minor locators
ax.xaxis.set_major_locator(mdates.MonthLocator())
ax.xaxis.set_minor_locator(mdates.WeekdayLocator())

# Set major and minor formatters
ax.xaxis.set_major_formatter(mdates.DateFormatter('%b'))
ax.xaxis.set_minor_formatter(mdates.DateFormatter('%d'))

plt.title('Date Formatting with Matplotlib.axis.Axis.set_minor_formatter()')
plt.xlabel('Date')
plt.ylabel('Value')
plt.legend()
plt.xticks(rotation=45)
plt.tight_layout()
plt.show()
Output:
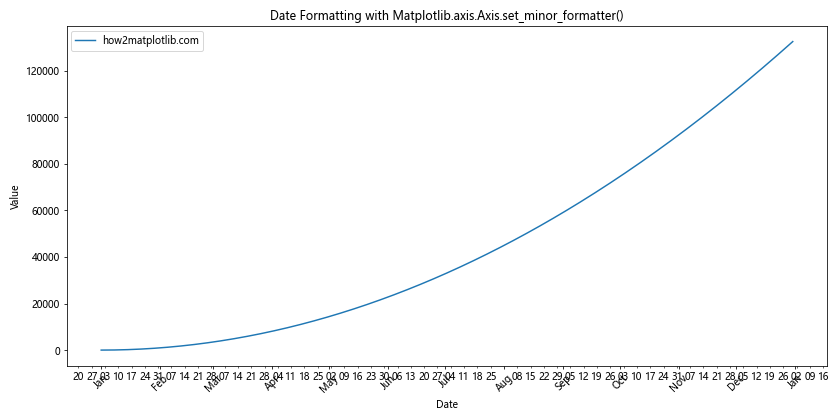
In this example, we’ve used Matplotlib.axis.Axis.set_minor_formatter() to format the minor ticks (weekdays) with day numbers, while the major ticks show month names.
Logarithmic Scale Formatting
When working with logarithmic scales, the Matplotlib.axis.Axis.set_minor_formatter() function can be very helpful in creating clear and informative tick labels. Here’s an example:
import matplotlib.pyplot as plt
import matplotlib.ticker as ticker
import numpy as np

fig, ax = plt.subplots(figsize=(10, 6))

x = np.logspace(0, 5, 100)
y = x**2

ax.loglog(x, y, label='how2matplotlib.com')

def minor_formatter(x, pos):
    if x.is_integer():
        return f'{x:.0f}'
    else:
        return ''

ax.xaxis.set_minor_formatter(ticker.FuncFormatter(minor_formatter))
ax.yaxis.set_minor_formatter(ticker.FuncFormatter(minor_formatter))

plt.title('Logarithmic Scale Formatting with Matplotlib.axis.Axis.set_minor_formatter()')
plt.xlabel('X-axis (log scale)')
plt.ylabel('Y-axis (log scale)')
plt.legend()
plt.grid(True, which='both', ls='-', alpha=0.2)
plt.show()
Output:
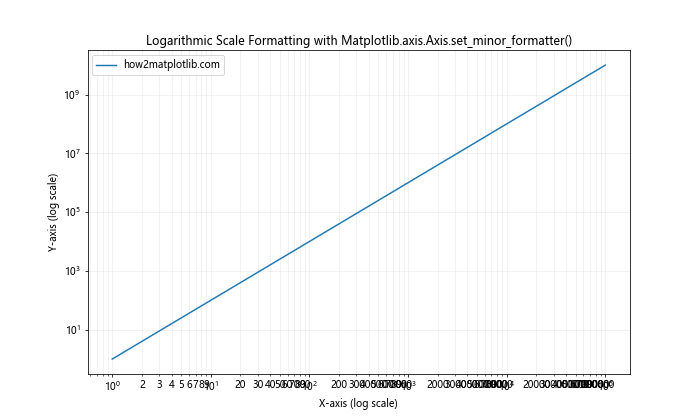
In this example, we’ve created a custom formatter that only labels integer powers of 10 on the minor ticks, reducing clutter on the logarithmic scale.
Combining Matplotlib.axis.Axis.set_minor_formatter() with Other Axis Customizations
The Matplotlib.axis.Axis.set_minor_formatter() function is often used in conjunction with other axis customization methods to create highly tailored and informative plots. Let’s explore some of these combinations.
Customizing Tick Appearance
You can combine Matplotlib.axis.Axis.set_minor_formatter() with tick appearance customizations for a more polished look:
import matplotlib.pyplot as plt
import matplotlib.ticker as ticker

fig, ax = plt.subplots(figsize=(10, 6))

x = range(0, 100, 10)
y = [i**2 for i in x]

ax.plot(x, y, label='how2matplotlib.com')

ax.xaxis.set_minor_locator(ticker.AutoMinorLocator())

def minor_formatter(x, pos):
    return f'{x:.1f}'

ax.xaxis.set_minor_formatter(ticker.FuncFormatter(minor_formatter))

# Customize tick appearance
ax.tick_params(which='major', length=10, width=2, color='r')
ax.tick_params(which='minor', length=5, width=1, color='b')

plt.title('Customized Ticks with Matplotlib.axis.Axis.set_minor_formatter()')
plt.xlabel('X-axis')
plt.ylabel('Y-axis')
plt.legend()
plt.show()
Output:
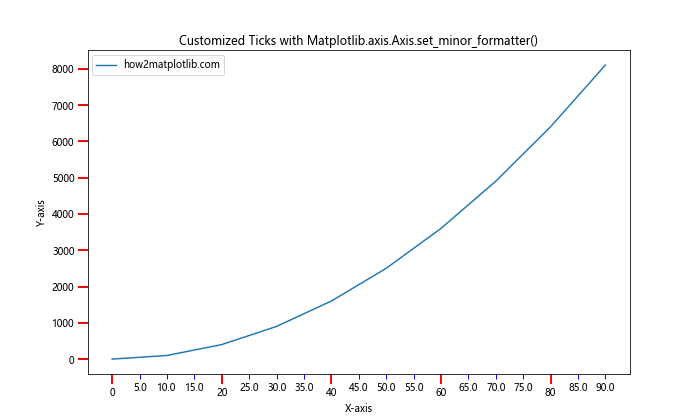
In this example, we’ve customized the appearance of both major and minor ticks while using Matplotlib.axis.Axis.set_minor_formatter() to format the minor tick labels.
Multiple Y-axes with Custom Formatting
The Matplotlib.axis.Axis.set_minor_formatter() function can be particularly useful when working with multiple y-axes:
import matplotlib.pyplot as plt
import matplotlib.ticker as ticker

fig, ax1 = plt.subplots(figsize=(10, 6))

x = range(0, 100, 10)
y1 = [i**2 for i in x]
y2 = [i**3 for i in x]

ax1.plot(x, y1, 'b-', label='Y1 (how2matplotlib.com)')
ax1.set_xlabel('X-axis')
ax1.set_ylabel('Y1', color='b')
ax1.tick_params(axis='y', labelcolor='b')

ax2 = ax1.twinx()
ax2.plot(x, y2, 'r-', label='Y2 (how2matplotlib.com)')
ax2.set_ylabel('Y2', color='r')
ax2.tick_params(axis='y', labelcolor='r')

# Set minor formatters for both y-axes
def minor_formatter1(y, pos):
    return f'{y/1000:.1f}k'

def minor_formatter2(y, pos):
    return f'{y/1000000:.1f}M'

ax1.yaxis.set_minor_formatter(ticker.FuncFormatter(minor_formatter1))
ax2.yaxis.set_minor_formatter(ticker.FuncFormatter(minor_formatter2))

plt.title('Multiple Y-axes with Matplotlib.axis.Axis.set_minor_formatter()')
fig.legend(loc='upper right', bbox_to_anchor=(1,1), bbox_transform=ax1.transAxes)
plt.tight_layout()
plt.show()
Output:
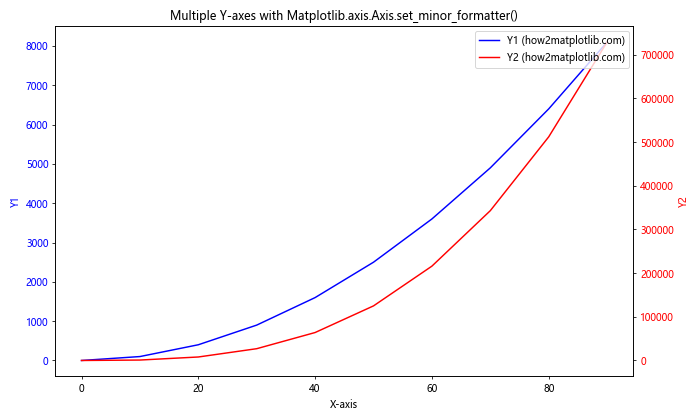
In this example, we’ve created a plot with two y-axes, each with its own custom minor tick formatter using Matplotlib.axis.Axis.set_minor_formatter().
Handling Special Cases with Matplotlib.axis.Axis.set_minor_formatter()
The Matplotlib.axis.Axis.set_minor_formatter() function can be particularly useful when dealing with special cases or unique data representations. Let’s explore some of these scenarios.
Categorical Data with Minor Ticks
While it’s less common to use minor ticks with categorical data, there might be cases where it’s useful. Here’s an example of how you might use Matplotlib.axis.Axis.set_minor_formatter() with categorical data:
import matplotlib.pyplot as plt
import matplotlib.ticker as ticker

fig, ax = plt.subplots(figsize=(12, 6))

categories = ['A', 'B', 'C', 'D', 'E']
values = [23, 45, 56, 78, 90]

ax.bar(categories, values, label='how2matplotlib.com')

# Set minor ticks between categories
ax.set_xticks([i - 0.5 for i in range(1, len(categories))], minor=True)

def minor_formatter(x, pos):
    return f'{categories[int(x)]}/{categories[int(x)+1]}'

ax.xaxis.set_minor_formatter(ticker.FuncFormatter(minor_formatter))

plt.title('Categorical Data with Matplotlib.axis.Axis.set_minor_formatter()')
plt.xlabel('Categories')
plt.ylabel('Values')
plt.legend()
plt.show()
Output:
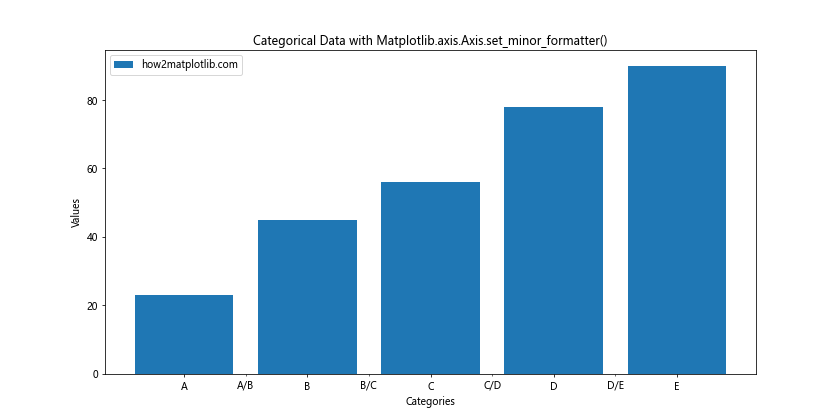
In this example, we’ve used Matplotlib.axis.Axis.set_minor_formatter() to label the spaces between categories, showing the transition from one category to the next.
Polar Plots with Custom Minor Tick Formatting
The Matplotlib.axis.Axis.set_minor_formatter() function can also be applied to polar plots. Here’s an example:
import matplotlib.pyplot as plt
import numpy as np
import matplotlib.ticker as ticker

fig, ax = plt.subplots(figsize=(10, 10), subplot_kw=dict(projection='polar'))

r = np.arange(0, 2, 0.01)
theta = 2 * np.pi * r

ax.plot(theta, r, label='how2matplotlib.com')

# Set minor ticks and formatter for theta
ax.xaxis.set_minor_locator(ticker.AutoMinorLocator())

def minor_formatter(x, pos):
    return f'{x/np.pi:.2f}π'

ax.xaxis.set_minor_formatter(ticker.FuncFormatter(minor_formatter))

plt.title('Polar Plot with Matplotlib.axis.Axis.set_minor_formatter()')
plt.legend()
plt.show()
Output:
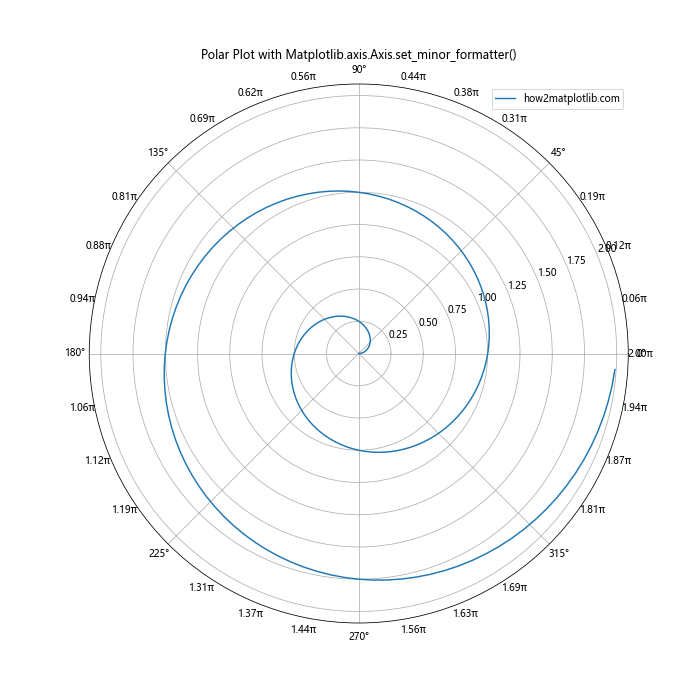
In this polar plot example, we’ve used Matplotlib.axis.Axis.set_minor_formatter() to format the minor theta ticks in terms of π.
Best Practices for Using Matplotlib.axis.Axis.set_minor_formatter()
When working with the Matplotlib.axis.Axis.set_minor_formatter() function, there are several best practices to keep in mind to ensure your plots are clear, informative, and visually appealing.
1. Consistency in Formatting
When using Matplotlib.axis.Axis.set_minor_formatter(), it’s important to maintain consistency with the major tick formatting. This helps in creating a coherent and easily understandable plot. Here’s an example:
import matplotlib.pyplot as plt
import matplotlib.ticker as ticker

fig, ax = plt.subplots(figsize=(10, 6))

x = range(0, 100, 10)
y = [i**2 for i in x]

ax.plot(x, y, label='how2matplotlib.com')

def major_formatter(x, pos):
    return f'{x:.0f}'

def minor_formatter(x, pos):
    return f'{x:.1f}'

ax.xaxis.set_major_formatter(ticker.FuncFormatter(major_formatter))
ax.xaxis.set_minor_formatter(ticker.FuncFormatter(minor_formatter))
ax.xaxis.set_minor_locator(ticker.AutoMinorLocator())

plt.title('Consistent Formatting with Matplotlib.axis.Axis.set_minor_formatter()')
plt.xlabel('X-axis')
plt.ylabel('Y-axis')
plt.legend()
plt.show()
Output:
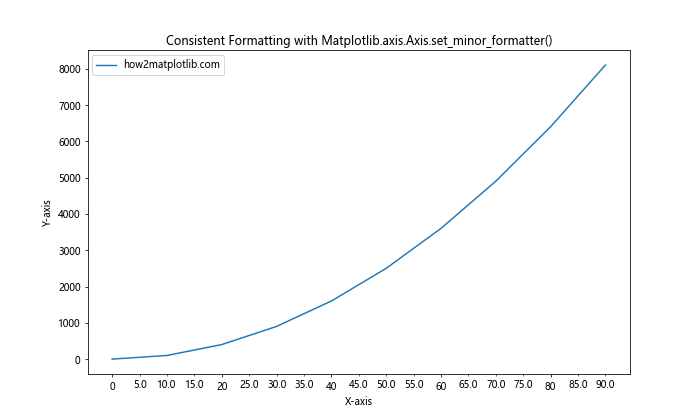
In this example, we’ve ensured that the major and minor tick formats are consistent, with major ticks showing whole numbers and minor ticks showing one decimal place.
2. Avoiding Clutter
While minor ticks can provide additional information, it’s important to avoid cluttering your plot. Use Matplotlib.axis.Axis.set_minor_formatter() judiciously to ensure your plot remains readable. Here’s an example of how to reduce clutter:
import matplotlib.pyplot as plt
import matplotlib.ticker as ticker
import numpy as np

fig, ax = plt.subplots(figsize=(10, 6))

x = np.linspace(0, 10, 1000)
y = np.sin(x)

ax.plot(x, y, label='how2matplotlib.com')

ax.xaxis.set_major_locator(ticker.MultipleLocator(1))
ax.xaxis.set_minor_locator(ticker.MultipleLocator(0.2))

def minor_formatter(x, pos):
    if x % 0.5 == 0:
        return f'{x:.1f}'
    else:
        return ''

ax.xaxis.set_minor_formatter(ticker.FuncFormatter(minor_formatter))

plt.title('Reducing Clutter with Matplotlib.axis.Axis.set_minor_formatter()')
plt.xlabel('X-axis')
plt.ylabel('Y-axis')
plt.legend()
plt.show()
Output:
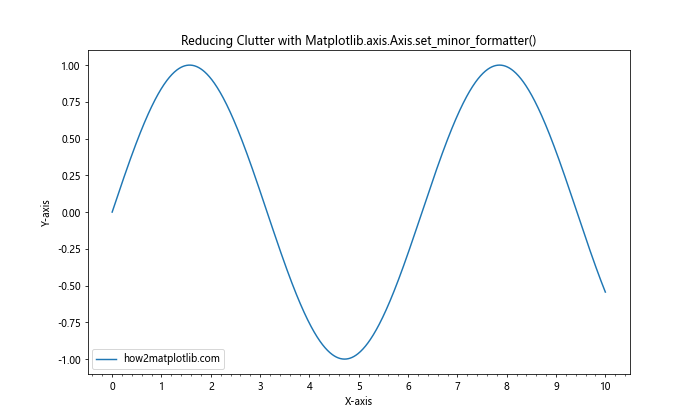
In this example, we’ve used Matplotlib.axis.Axis.set_minor_formatter() to only label every other minor tick, reducing clutter while still providing additional information.
3. Considering Color and Style
When using Matplotlib.axis.Axis.set_minor_formatter(), consider using color and style to differentiate between major and minor ticks. This can enhance the readability of your plot:
import matplotlib.pyplot as plt
import matplotlib.ticker as ticker

fig, ax = plt.subplots(figsize=(10, 6))

x = range(0, 100, 10)
y = [i**2 for i in x]

ax.plot(x, y, label='how2matplotlib.com')

ax.xaxis.set_minor_locator(ticker.AutoMinorLocator())

def minor_formatter(x, pos):
    return f'{x:.1f}'

ax.xaxis.set_minor_formatter(ticker.FuncFormatter(minor_formatter))

ax.tick_params(axis='x', which='major', color='red', length=7)
ax.tick_params(axis='x', which='minor', color='blue', length=4)

for label in ax.xaxis.get_majorticklabels():
    label.set_color('red')

for label in ax.xaxis.get_minorticklabels():
    label.set_color('blue')

plt.title('Styled Ticks with Matplotlib.axis.Axis.set_minor_formatter()')
plt.xlabel('X-axis')
plt.ylabel('Y-axis')
plt.legend()
plt.show()
Output:
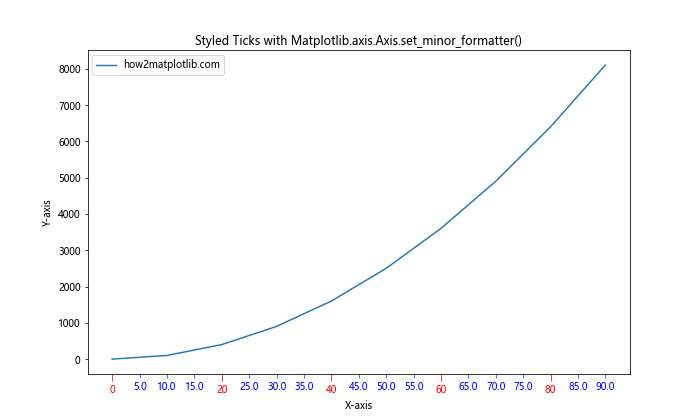
In this example, we’ve used different colors for major and minor ticks and their labels, making it easier to distinguish between them.
Common Pitfalls and How to Avoid Them
When working with the Matplotlib.axis.Axis.set_minor_formatter() function, there are several common pitfalls that you should be aware of and know how to avoid.
1. Forgetting to Set Minor Locator
One common mistake is forgetting to set a minor locator before using Matplotlib.axis.Axis.set_minor_formatter(). Without a minor locator, there won’t be any minor ticks to format. Here’s how to avoid this:
import matplotlib.pyplot as plt
import matplotlib.ticker as ticker

fig, ax = plt.subplots(figsize=(10, 6))

x = range(0, 100, 10)
y = [i**2 for i in x]

ax.plot(x, y, label='how2matplotlib.com')

# Set minor locator before setting minor formatter
ax.xaxis.set_minor_locator(ticker.AutoMinorLocator())

def minor_formatter(x, pos):
    return f'{x:.1f}'

ax.xaxis.set_minor_formatter(ticker.FuncFormatter(minor_formatter))

plt.title('Correctly Setting Minor Locator with Matplotlib.axis.Axis.set_minor_formatter()')
plt.xlabel('X-axis')
plt.ylabel('Y-axis')
plt.legend()
plt.show()
Output:
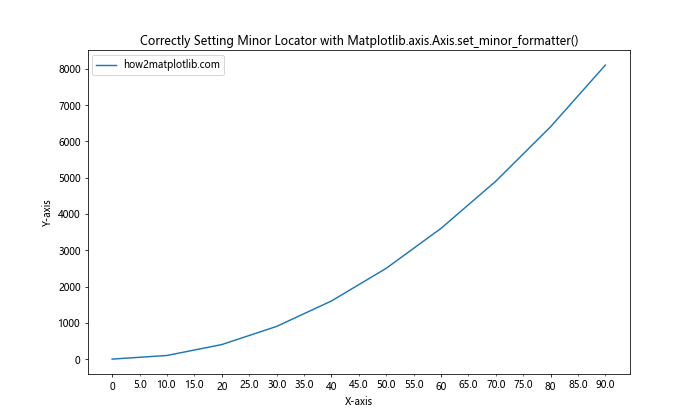
In this example, we’ve made sure to set the minor locator before applying our custom formatter.
2. Overcomplicating the Formatter Function
Another common pitfall is creating overly complex formatter functions. Remember, the formatter function should be simple and efficient. Here’s an example of simplifying a formatter function:
import matplotlib.pyplot as plt
import matplotlib.ticker as ticker

fig, ax = plt.subplots(figsize=(10, 6))

x = range(0, 100, 10)
y = [i**2 for i in x]

ax.plot(x, y, label='how2matplotlib.com')

ax.xaxis.set_minor_locator(ticker.AutoMinorLocator())

# Simplified formatter function
def minor_formatter(x, pos):
    return f'{x:.1f}'

ax.xaxis.set_minor_formatter(ticker.FuncFormatter(minor_formatter))

plt.title('Simple Formatter with Matplotlib.axis.Axis.set_minor_formatter()')
plt.xlabel('X-axis')
plt.ylabel('Y-axis')
plt.legend()
plt.show()
Output:
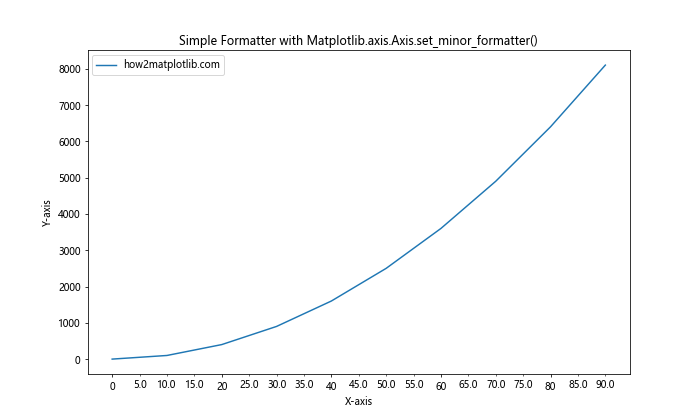
In this example, we’ve used a simple formatter function that just formats the tick value to one decimal place.
3. Ignoring the Scale of the Axis
When using Matplotlib.axis.Axis.set_minor_formatter(), it’s important to consider the scale of your axis. A formatter that works well for a linear scale might not be suitable for a logarithmic scale. Here’s an example of how to handle this:
import matplotlib.pyplot as plt
import matplotlib.ticker as ticker
import numpy as np

fig, (ax1, ax2) = plt.subplots(1, 2, figsize=(15, 6))

x = np.logspace(0, 5, 100)
y = x**2

ax1.plot(x, y, label='Linear Scale')
ax2.loglog(x, y, label='Log Scale')

def linear_formatter(x, pos):
    return f'{x:.0f}'

def log_formatter(x, pos):
    return f'10^{int(np.log10(x))}'

ax1.xaxis.set_minor_locator(ticker.AutoMinorLocator())
ax1.xaxis.set_minor_formatter(ticker.FuncFormatter(linear_formatter))

ax2.xaxis.set_minor_locator(ticker.LogLocator(subs=np.arange(2, 10)))
ax2.xaxis.set_minor_formatter(ticker.FuncFormatter(log_formatter))

ax1.set_title('Linear Scale')
ax2.set_title('Log Scale')
ax1.set_xlabel('X-axis')
ax2.set_xlabel('X-axis')
ax1.set_ylabel('Y-axis')
ax2.set_ylabel('Y-axis')
ax1.legend()
ax2.legend()

plt.suptitle('Scale-Aware Formatting with Matplotlib.axis.Axis.set_minor_formatter()')
plt.tight_layout()
plt.show()
Output:
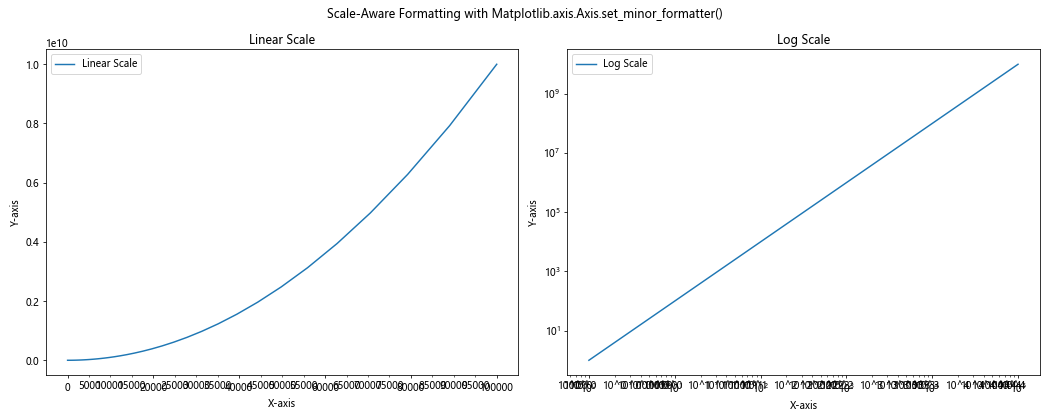
In this example, we’ve used different formatters for linear and logarithmic scales, ensuring that the minor tick labels are appropriate for each scale.
Advanced Techniques with Matplotlib.axis.Axis.set_minor_formatter()
As you become more comfortable with the Matplotlib.axis.Axis.set_minor_formatter() function, you can start to explore more advanced techniques to create highly customized and informative plots.
1. Dynamic Formatting Based on Zoom Level
One advanced technique is to dynamically change the minor tick formatting based on the current zoom level of the plot. This can be particularly useful for interactive plots:
import matplotlib.pyplot as plt
import matplotlib.ticker as ticker

fig, ax = plt.subplots(figsize=(10, 6))

x = range(0, 1000, 10)
y = [i**2 for i in x]

ax.plot(x, y, label='how2matplotlib.com')

ax.xaxis.set_minor_locator(ticker.AutoMinorLocator())

def dynamic_formatter(x, pos):
    x_range = ax.get_xlim()[1] - ax.get_xlim()[0]
    if x_range < 100:
        return f'{x:.2f}'
    elif x_range < 500:
        return f'{x:.1f}'
    else:
        return f'{x:.0f}'

ax.xaxis.set_minor_formatter(ticker.FuncFormatter(dynamic_formatter))

plt.title('Dynamic Formatting with Matplotlib.axis.Axis.set_minor_formatter()')
plt.xlabel('X-axis')
plt.ylabel('Y-axis')
plt.legend()

# Enable interactive mode
plt.ion()
plt.show()

print("Zoom in and out to see the minor tick formatting change.")
input("Press Enter to close the plot...")
Output:
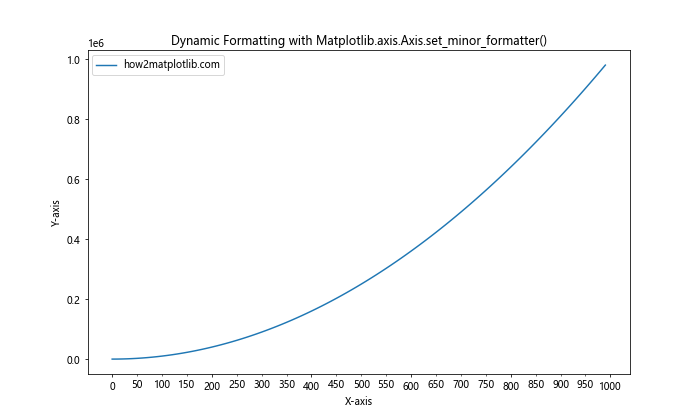
In this example, the minor tick formatting changes based on the current x-axis range, providing more detail when zoomed in and less when zoomed out.
2. Combining Multiple Formatters
Sometimes, you might want to use different formatters for different regions of your plot. Here's an example of how you can combine multiple formatters:
import matplotlib.pyplot as plt
import matplotlib.ticker as ticker

fig, ax = plt.subplots(figsize=(10, 6))

x = range(-50, 51)
y = [i**2 for i in x]

ax.plot(x, y, label='how2matplotlib.com')

ax.xaxis.set_minor_locator(ticker.AutoMinorLocator())

def combined_formatter(x, pos):
    if x < 0:
        return f'-{abs(x):.1f}'
    elif x == 0:
        return '0'
    else:
        return f'+{x:.1f}'

ax.xaxis.set_minor_formatter(ticker.FuncFormatter(combined_formatter))

plt.title('Combined Formatters with Matplotlib.axis.Axis.set_minor_formatter()')
plt.xlabel('X-axis')
plt.ylabel('Y-axis')
plt.legend()
plt.show()
Output:
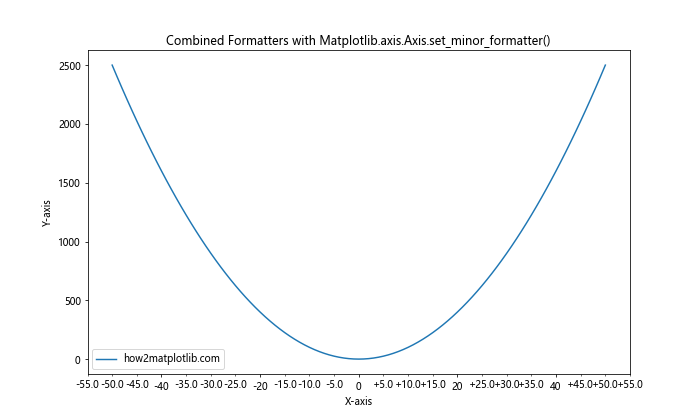
In this example, we've used a single formatter function that applies different formatting based on whether the tick value is negative, zero, or positive.
3. Using Lambda Functions for Simple Formatting
For simple formatting tasks, you can use lambda functions with Matplotlib.axis.Axis.set_minor_formatter() to create concise, one-line formatters:
import matplotlib.pyplot as plt
import matplotlib.ticker as ticker

fig, ax = plt.subplots(figsize=(10, 6))

x = range(0, 100, 10)
y = [i**2 for i in x]

ax.plot(x, y, label='how2matplotlib.com')

ax.xaxis.set_minor_locator(ticker.AutoMinorLocator())

ax.xaxis.set_minor_formatter(ticker.FuncFormatter(lambda x, pos: f'{x:.1f}'))

plt.title('Lambda Function Formatter with Matplotlib.axis.Axis.set_minor_formatter()')
plt.xlabel('X-axis')
plt.ylabel('Y-axis')
plt.legend()
plt.show()
Output:
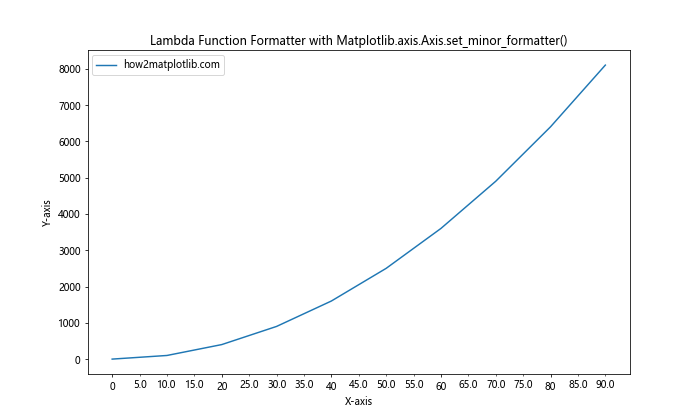
In this example, we've used a lambda function to create a simple formatter that displays tick values with one decimal place.
Conclusion
The Matplotlib.axis.Axis.set_minor_formatter() function is a powerful tool in the Matplotlib library that allows for fine-grained control over the appearance of minor tick labels. Throughout this comprehensive guide, we've explored various aspects of this function, from basic usage to advanced techniques.
We've seen how Matplotlib.axis.Axis.set_minor_formatter() can be used to customize tick labels for different types of plots, including linear plots, logarithmic plots, date plots, and polar plots. We've also discussed best practices for using this function, common pitfalls to avoid, and advanced techniques for creating highly customized and informative visualizations.