Comprehensive Guide to Using Matplotlib.artist.Artist.add_callback() in Python for Data Visualization
Matplotlib.artist.Artist.add_callback() in Python is a powerful method that allows you to add callback functions to Matplotlib artists. This function is an essential tool for creating interactive and dynamic visualizations using the Matplotlib library. In this comprehensive guide, we’ll explore the various aspects of Matplotlib.artist.Artist.add_callback() and how it can enhance your data visualization projects.
Understanding Matplotlib.artist.Artist.add_callback() in Python
Matplotlib.artist.Artist.add_callback() is a method that belongs to the Artist class in Matplotlib. It allows you to register a callback function that will be called whenever a specific artist’s properties change. This functionality is particularly useful when you want to create interactive plots or respond to changes in your visualization dynamically.
The basic syntax of the add_callback() method is as follows:
import matplotlib.pyplot as plt

fig, ax = plt.subplots()
line, = ax.plot([1, 2, 3, 4], [1, 4, 2, 3], label='how2matplotlib.com')

def my_callback(artist):
    print(f"Artist {artist} has been modified")

line.add_callback(my_callback)

plt.title("Matplotlib.artist.Artist.add_callback() Example")
plt.show()
Output:
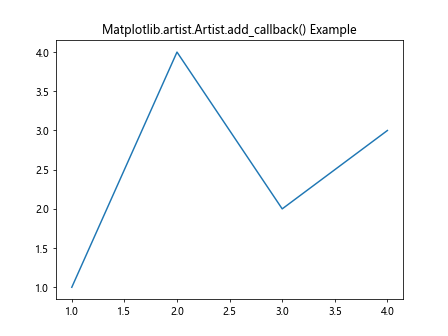
In this example, we create a simple line plot and add a callback function that prints a message whenever the line artist is modified. The add_callback() method is called on the line artist, passing the my_callback function as an argument.
The Importance of Matplotlib.artist.Artist.add_callback() in Data Visualization
Matplotlib.artist.Artist.add_callback() plays a crucial role in creating interactive and responsive data visualizations. By using this method, you can:
- Respond to user interactions with the plot
- Update other parts of your visualization based on changes to specific artists
- Implement custom behaviors when artist properties change
- Create dynamic animations and real-time updates
Let’s explore some practical examples to demonstrate the power of Matplotlib.artist.Artist.add_callback() in Python.
Example 1: Updating a Text Label Based on Line Position
In this example, we’ll create a plot where a text label updates its content based on the position of a draggable line.
import matplotlib.pyplot as plt
from matplotlib.widgets import Slider

fig, ax = plt.subplots()
line, = ax.plot([0, 1], [0, 1], 'r-', lw=2, label='how2matplotlib.com')
text = ax.text(0.5, 0.5, '', ha='center', va='center')

def update_text(artist):
    x, y = line.get_data()
    text.set_text(f"Line end: ({x[1]:.2f}, {y[1]:.2f})")

line.add_callback(update_text)

slider_ax = plt.axes([0.2, 0.02, 0.6, 0.03])
slider = Slider(slider_ax, 'Position', 0, 1, valinit=1)

def update_line(val):
    line.set_ydata([0, val])
    fig.canvas.draw_idle()

slider.on_changed(update_line)

plt.title("Matplotlib.artist.Artist.add_callback() - Text Update Example")
plt.show()
Output:
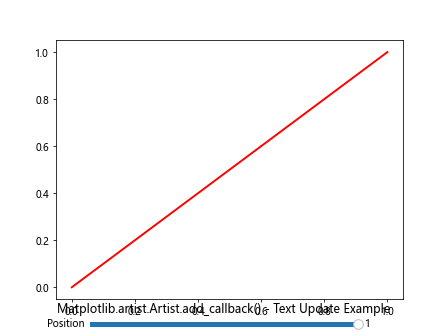
In this example, we create a line plot with a slider. The add_callback() method is used to register the update_text function, which updates the text label whenever the line’s position changes. The slider allows the user to interactively change the line’s end position, and the text label updates accordingly.
Example 2: Changing Colors Based on Data Values
In this example, we’ll use Matplotlib.artist.Artist.add_callback() to dynamically change the color of scatter points based on their y-values.
import matplotlib.pyplot as plt
import numpy as np

fig, ax = plt.subplots()
x = np.linspace(0, 10, 100)
y = np.sin(x)
scatter = ax.scatter(x, y, c=y, cmap='viridis', label='how2matplotlib.com')

def update_colors(artist):
    y = scatter.get_offsets()[:, 1]
    scatter.set_array(y)
    fig.canvas.draw_idle()

scatter.add_callback(update_colors)

def on_click(event):
    if event.inaxes == ax:
        new_point = np.array([[event.xdata, event.ydata]])
        scatter.set_offsets(np.vstack((scatter.get_offsets(), new_point)))

fig.canvas.mpl_connect('button_press_event', on_click)

plt.title("Matplotlib.artist.Artist.add_callback() - Color Update Example")
plt.colorbar(scatter)
plt.show()
Output:
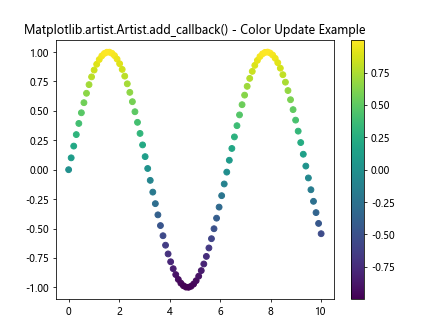
In this example, we create a scatter plot of sine wave data. The add_callback() method is used to register the update_colors function, which updates the colors of the scatter points based on their y-values. When a user clicks on the plot to add a new point, the callback function is triggered, and the colors are updated accordingly.
Example 3: Implementing a Custom Legend
Let’s use Matplotlib.artist.Artist.add_callback() to create a custom legend that updates dynamically based on the visibility of plot elements.
import matplotlib.pyplot as plt
import numpy as np

fig, ax = plt.subplots()
x = np.linspace(0, 10, 100)
line1, = ax.plot(x, np.sin(x), label='Sin')
line2, = ax.plot(x, np.cos(x), label='Cos')
line3, = ax.plot(x, np.tan(x), label='Tan')

lines = [line1, line2, line3]
visibility = [True, True, True]

def update_legend(artist):
    visible_lines = [line for line, vis in zip(lines, visibility) if vis]
    ax.legend(visible_lines)
    fig.canvas.draw_idle()

for line in lines:
    line.add_callback(update_legend)

def toggle_visibility(event):
    if event.key in '123':
        index = int(event.key) - 1
        visibility[index] = not visibility[index]
        lines[index].set_visible(visibility[index])

fig.canvas.mpl_connect('key_press_event', toggle_visibility)

plt.title("Matplotlib.artist.Artist.add_callback() - Custom Legend Example")
ax.set_ylim(-2, 2)
ax.text(0.5, -1.8, "Press 1, 2, or 3 to toggle lines (how2matplotlib.com)", ha='center')
plt.show()
Output:
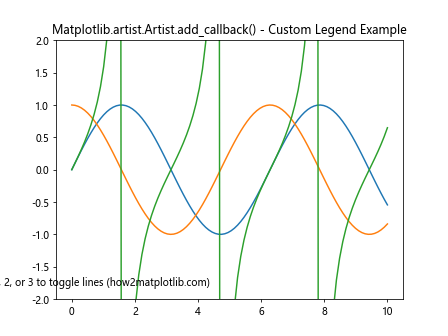
In this example, we create a plot with three trigonometric functions. The add_callback() method is used to register the update_legend function for each line. When the visibility of a line changes (by pressing the corresponding number key), the callback function is triggered, and the legend is updated to show only the visible lines.
Advanced Usage of Matplotlib.artist.Artist.add_callback() in Python
Now that we’ve covered the basics, let’s explore some more advanced applications of Matplotlib.artist.Artist.add_callback() in Python.
Example 4: Creating a Live Data Stream Visualization
In this example, we’ll use Matplotlib.artist.Artist.add_callback() to create a live data stream visualization that updates in real-time.
import matplotlib.pyplot as plt
import numpy as np
from matplotlib.animation import FuncAnimation

fig, ax = plt.subplots()
line, = ax.plot([], [], lw=2, label='how2matplotlib.com')
ax.set_xlim(0, 100)
ax.set_ylim(-1, 1)

data = np.zeros(100)
index = 0

def update_data(frame):
    global index
    data[index] = np.random.uniform(-1, 1)
    index = (index + 1) % 100
    line.set_data(np.arange(100), data)
    return line,

def on_draw(event):
    ax.set_title(f"Latest value: {data[index-1]:.2f}")

fig.canvas.mpl_connect('draw_event', on_draw)
line.add_callback(lambda artist: fig.canvas.draw_idle())

ani = FuncAnimation(fig, update_data, frames=200, interval=50, blit=True)

plt.title("Matplotlib.artist.Artist.add_callback() - Live Data Stream")
plt.show()
Output:
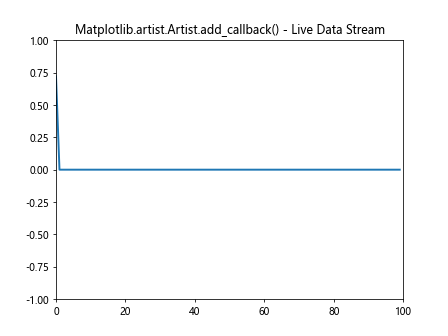
In this example, we create a live data stream visualization that updates every 50 milliseconds. The add_callback() method is used to trigger a redraw of the canvas whenever the line data changes. Additionally, we use the ‘draw_event’ to update the title with the latest data value.
Example 5: Interactive Histogram with Adjustable Bins
Let’s create an interactive histogram where the user can adjust the number of bins using a slider, and the plot updates dynamically.
import matplotlib.pyplot as plt
import numpy as np
from matplotlib.widgets import Slider

fig, ax = plt.subplots()
data = np.random.normal(0, 1, 1000)
n, bins, patches = ax.hist(data, bins=30, label='how2matplotlib.com')

slider_ax = plt.axes([0.2, 0.02, 0.6, 0.03])
slider = Slider(slider_ax, 'Bins', 5, 100, valinit=30, valstep=1)

def update_histogram(val):
    ax.clear()
    n, bins, patches = ax.hist(data, bins=int(val), label='how2matplotlib.com')
    ax.set_title(f"Histogram with {int(val)} bins")
    ax.legend()

slider.on_changed(update_histogram)

for patch in patches:
    patch.add_callback(lambda artist: fig.canvas.draw_idle())

plt.title("Matplotlib.artist.Artist.add_callback() - Interactive Histogram")
plt.show()
Output:
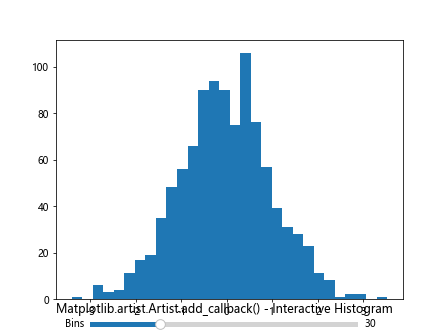
In this example, we create an interactive histogram where the user can adjust the number of bins using a slider. The add_callback() method is used on each histogram patch to trigger a redraw of the canvas whenever the histogram is updated.
Example 6: Dynamic Pie Chart with Exploded Slices
Let’s create a dynamic pie chart where slices can be exploded by clicking on them, using Matplotlib.artist.Artist.add_callback() to update the chart.
import matplotlib.pyplot as plt

fig, ax = plt.subplots()
sizes = [30, 25, 20, 15, 10]
labels = ['A', 'B', 'C', 'D', 'E']
explode = [0] * 5
colors = ['#ff9999', '#66b3ff', '#99ff99', '#ffcc99', '#ff99cc']

pie = ax.pie(sizes, explode=explode, labels=labels, colors=colors, autopct='%1.1f%%', startangle=90)
ax.axis('equal')

def explode_slice(event):
    if event.inaxes == ax:
        for i, wedge in enumerate(pie[0]):
            cont, ind = wedge.contains(event)
            if cont:
                explode[i] = 0.1 if explode[i] == 0 else 0
                pie[0], _ = ax.pie(sizes, explode=explode, labels=labels, colors=colors, autopct='%1.1f%%', startangle=90)
                fig.canvas.draw_idle()
                break

fig.canvas.mpl_connect('button_press_event', explode_slice)

for wedge in pie[0]:
    wedge.add_callback(lambda artist: fig.canvas.draw_idle())

plt.title("Matplotlib.artist.Artist.add_callback() - Dynamic Pie Chart")
ax.text(0, -1.2, "Click on a slice to explode it (how2matplotlib.com)", ha='center')
plt.show()
Output:
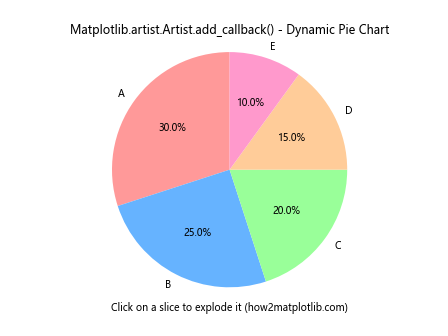
In this example, we create a dynamic pie chart where clicking on a slice will cause it to explode outwards. The add_callback() method is used on each wedge to trigger a redraw of the canvas whenever a slice is exploded or un-exploded.
Best Practices for Using Matplotlib.artist.Artist.add_callback() in Python
When working with Matplotlib.artist.Artist.add_callback() in Python, it’s important to follow some best practices to ensure efficient and effective use of this powerful feature:
- Keep callback functions lightweight: Avoid performing heavy computations or time-consuming operations within callback functions, as they may be called frequently and could impact the responsiveness of your visualization.
Use appropriate event triggers: Choose the right events to trigger your callbacks. For example, use ‘draw_event’ for updates that should occur after each redraw, or specific artist callbacks for changes to particular elements.
Manage callback references: Keep track of the callback functions you add and remove them when they’re no longer needed to prevent memory leaks and unnecessary function calls.
Combine with other interactive features: Integrate add_callback() with other interactive Matplotlib features like widgets, event handling, and animations for more complex and engaging visualizations.
Use meaningful names for callback functions: Choose descriptive names for your callback functions to make your code more readable and maintainable.
Let’s look at an example that demonstrates these best practices: