How to Use plt.hist with y max 1
plt.hist y max 1 is a powerful combination of parameters in Matplotlib that allows you to create histograms with normalized heights. This article will explore the various aspects of using plt.hist with y max 1, providing detailed explanations and examples to help you master this technique in data visualization.
Understanding plt.hist and y max 1
plt.hist is a function in Matplotlib used to create histograms, while y max 1 refers to setting the maximum height of the histogram bars to 1. This combination is particularly useful when you want to normalize your histogram data, making it easier to compare distributions across different datasets.
Let’s start with a basic example of using plt.hist with y max 1:
import matplotlib.pyplot as plt
import numpy as np

# Generate sample data
data = np.random.normal(0, 1, 1000)

# Create histogram with y max 1
plt.hist(data, bins=30, density=True, alpha=0.7)
plt.ylim(0, 1)
plt.title("Histogram with y max 1 - how2matplotlib.com")
plt.xlabel("Value")
plt.ylabel("Normalized Frequency")
plt.show()
Output:
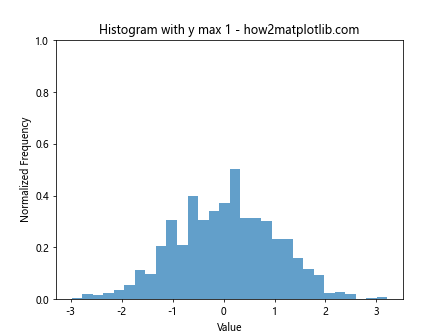
In this example, we generate random data from a normal distribution and create a histogram using plt.hist. The density=True parameter normalizes the histogram, and plt.ylim(0, 1) sets the y-axis limit to 1, effectively creating a plt.hist y max 1 plot.
Benefits of Using plt.hist with y max 1
Using plt.hist with y max 1 offers several advantages:
- Normalized data representation
- Easy comparison between different datasets
- Consistent scale across multiple histograms
- Improved visual interpretation of probability distributions
Let’s explore these benefits with another example:
import matplotlib.pyplot as plt
import numpy as np

# Generate two datasets
data1 = np.random.normal(0, 1, 1000)
data2 = np.random.normal(2, 1.5, 1500)

# Create subplots
fig, (ax1, ax2) = plt.subplots(1, 2, figsize=(12, 5))

# Plot histogram for data1
ax1.hist(data1, bins=30, density=True, alpha=0.7)
ax1.set_ylim(0, 1)
ax1.set_title("Dataset 1 - how2matplotlib.com")
ax1.set_xlabel("Value")
ax1.set_ylabel("Normalized Frequency")

# Plot histogram for data2
ax2.hist(data2, bins=30, density=True, alpha=0.7)
ax2.set_ylim(0, 1)
ax2.set_title("Dataset 2 - how2matplotlib.com")
ax2.set_xlabel("Value")
ax2.set_ylabel("Normalized Frequency")

plt.tight_layout()
plt.show()
Output:
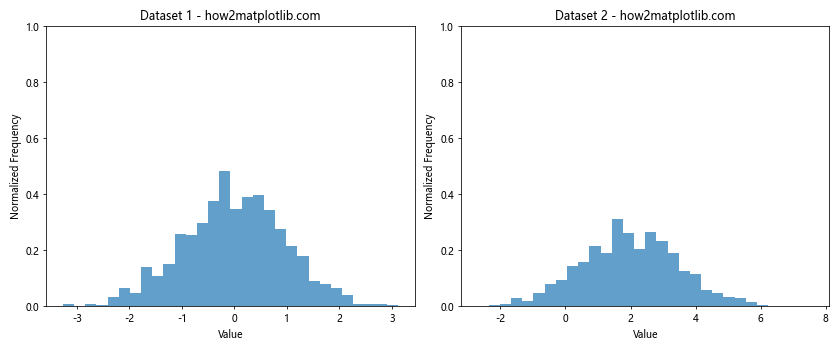
This example demonstrates how plt.hist with y max 1 allows for easy comparison between two different datasets by normalizing their histograms.
Customizing plt.hist with y max 1
While the basic usage of plt.hist with y max 1 is straightforward, there are many ways to customize your histograms to better suit your needs. Let’s explore some of these customization options:
Adjusting Bin Size and Count
The number and size of bins in your histogram can significantly affect its appearance and interpretation. Here’s an example of how to adjust bin size and count:
import matplotlib.pyplot as plt
import numpy as np

data = np.random.normal(0, 1, 1000)

fig, (ax1, ax2) = plt.subplots(1, 2, figsize=(12, 5))

# Histogram with 10 bins
ax1.hist(data, bins=10, density=True, alpha=0.7)
ax1.set_ylim(0, 1)
ax1.set_title("10 Bins - how2matplotlib.com")
ax1.set_xlabel("Value")
ax1.set_ylabel("Normalized Frequency")

# Histogram with 50 bins
ax2.hist(data, bins=50, density=True, alpha=0.7)
ax2.set_ylim(0, 1)
ax2.set_title("50 Bins - how2matplotlib.com")
ax2.set_xlabel("Value")
ax2.set_ylabel("Normalized Frequency")

plt.tight_layout()
plt.show()
Output:
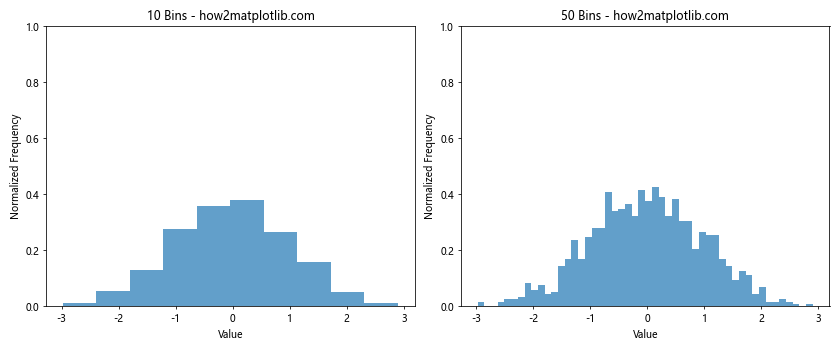
This example shows how changing the number of bins affects the appearance of the histogram while maintaining y max 1.
Changing Histogram Colors and Styles
You can customize the appearance of your plt.hist y max 1 plots by changing colors, edge colors, and styles:
import matplotlib.pyplot as plt
import numpy as np

data = np.random.normal(0, 1, 1000)

fig, (ax1, ax2) = plt.subplots(1, 2, figsize=(12, 5))

# Solid color histogram
ax1.hist(data, bins=30, density=True, alpha=0.7, color='skyblue', edgecolor='black')
ax1.set_ylim(0, 1)
ax1.set_title("Solid Color - how2matplotlib.com")
ax1.set_xlabel("Value")
ax1.set_ylabel("Normalized Frequency")

# Step-style histogram
ax2.hist(data, bins=30, density=True, histtype='step', linewidth=2, color='red')
ax2.set_ylim(0, 1)
ax2.set_title("Step Style - how2matplotlib.com")
ax2.set_xlabel("Value")
ax2.set_ylabel("Normalized Frequency")

plt.tight_layout()
plt.show()
Output:
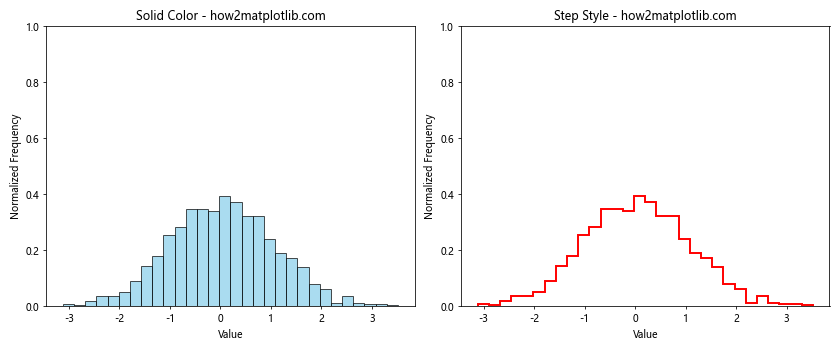
This example demonstrates different styles and colors for plt.hist y max 1 plots.
Adding Multiple Datasets to a Single Histogram
You can compare multiple datasets in a single plt.hist y max 1 plot:
import matplotlib.pyplot as plt
import numpy as np

data1 = np.random.normal(0, 1, 1000)
data2 = np.random.normal(2, 1.5, 1000)

plt.hist(data1, bins=30, density=True, alpha=0.7, label='Dataset 1')
plt.hist(data2, bins=30, density=True, alpha=0.7, label='Dataset 2')
plt.ylim(0, 1)
plt.title("Multiple Datasets - how2matplotlib.com")
plt.xlabel("Value")
plt.ylabel("Normalized Frequency")
plt.legend()
plt.show()
Output:
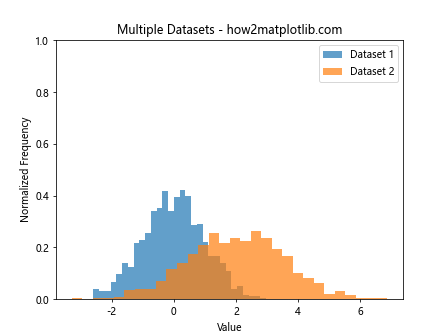
This example shows how to overlay multiple datasets in a single plt.hist y max 1 plot for easy comparison.
Advanced Techniques with plt.hist y max 1
Now that we’ve covered the basics, let’s explore some advanced techniques for using plt.hist with y max 1.
Cumulative Histograms
Cumulative histograms can be created using plt.hist with y max 1:
import matplotlib.pyplot as plt
import numpy as np

data = np.random.normal(0, 1, 1000)

plt.hist(data, bins=30, density=True, alpha=0.7, cumulative=True)
plt.ylim(0, 1)
plt.title("Cumulative Histogram - how2matplotlib.com")
plt.xlabel("Value")
plt.ylabel("Cumulative Frequency")
plt.show()
Output:
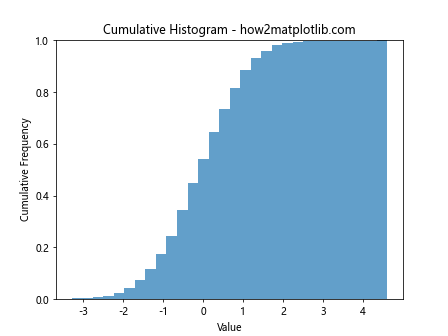
This example demonstrates how to create a cumulative histogram using plt.hist with y max 1.
2D Histograms
You can create 2D histograms using plt.hist2d with normalized values:
import matplotlib.pyplot as plt
import numpy as np

x = np.random.normal(0, 1, 1000)
y = np.random.normal(0, 1, 1000)

plt.hist2d(x, y, bins=30, density=True, cmap='viridis')
plt.colorbar(label='Normalized Frequency')
plt.title("2D Histogram - how2matplotlib.com")
plt.xlabel("X Value")
plt.ylabel("Y Value")
plt.show()
Output:
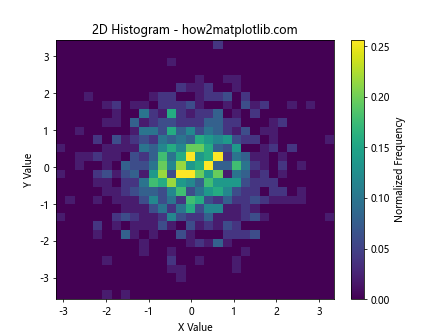
This example shows how to create a 2D histogram with normalized values, similar to using plt.hist with y max 1.
Stacked Histograms
Stacked histograms can be created while maintaining y max 1:
import matplotlib.pyplot as plt
import numpy as np

data1 = np.random.normal(0, 1, 1000)
data2 = np.random.normal(2, 1, 1000)
data3 = np.random.normal(-2, 1.5, 1000)

plt.hist([data1, data2, data3], bins=30, density=True, stacked=True, alpha=0.7,
         label=['Dataset 1', 'Dataset 2', 'Dataset 3'])
plt.ylim(0, 1)
plt.title("Stacked Histogram - how2matplotlib.com")
plt.xlabel("Value")
plt.ylabel("Normalized Frequency")
plt.legend()
plt.show()
Output:
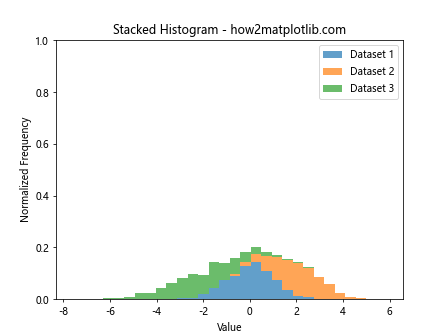
This example demonstrates how to create a stacked histogram while maintaining y max 1 for easy comparison of multiple datasets.
Best Practices for Using plt.hist with y max 1
When working with plt.hist and y max 1, it’s important to follow some best practices to ensure your visualizations are effective and informative:
- Choose appropriate bin sizes
- Use clear and descriptive labels
- Apply color schemes that enhance readability
- Include legends when comparing multiple datasets
- Consider using subplots for complex comparisons
Let’s implement these best practices in an example:
import matplotlib.pyplot as plt
import numpy as np

# Generate sample data
data1 = np.random.normal(0, 1, 1000)
data2 = np.random.exponential(1, 1000)

# Create subplots
fig, (ax1, ax2) = plt.subplots(1, 2, figsize=(12, 5))

# Plot normal distribution
ax1.hist(data1, bins=30, density=True, alpha=0.7, color='skyblue', edgecolor='black')
ax1.set_ylim(0, 1)
ax1.set_title("Normal Distribution - how2matplotlib.com")
ax1.set_xlabel("Value")
ax1.set_ylabel("Normalized Frequency")

# Plot exponential distribution
ax2.hist(data2, bins=30, density=True, alpha=0.7, color='lightgreen', edgecolor='black')
ax2.set_ylim(0, 1)
ax2.set_title("Exponential Distribution - how2matplotlib.com")
ax2.set_xlabel("Value")
ax2.set_ylabel("Normalized Frequency")

plt.tight_layout()
plt.show()
Output:
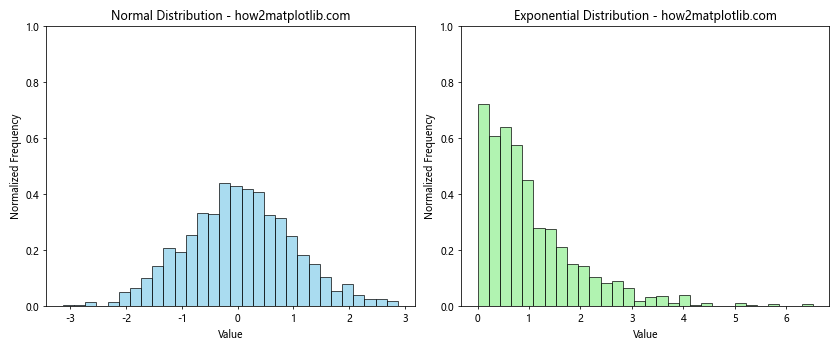
This example demonstrates the use of appropriate bin sizes, clear labels, and color schemes to enhance the readability of plt.hist y max 1 plots.
Common Pitfalls and How to Avoid Them
When using plt.hist with y max 1, there are some common pitfalls that you should be aware of:
- Misinterpreting normalized data
- Choosing inappropriate bin sizes
- Overlooking outliers
- Failing to account for different sample sizes
Let’s address these pitfalls with an example:
import matplotlib.pyplot as plt
import numpy as np

# Generate sample data with outliers
data = np.concatenate([np.random.normal(0, 1, 990), np.random.normal(10, 1, 10)])

fig, (ax1, ax2) = plt.subplots(1, 2, figsize=(12, 5))

# Histogram with default bins
ax1.hist(data, density=True, alpha=0.7)
ax1.set_ylim(0, 1)
ax1.set_title("Default Bins - how2matplotlib.com")
ax1.set_xlabel("Value")
ax1.set_ylabel("Normalized Frequency")

# Histogram with custom bins to account for outliers
ax2.hist(data, bins=np.linspace(-5, 15, 41), density=True, alpha=0.7)
ax2.set_ylim(0, 1)
ax2.set_title("Custom Bins - how2matplotlib.com")
ax2.set_xlabel("Value")
ax2.set_ylabel("Normalized Frequency")

plt.tight_layout()
plt.show()
Output:
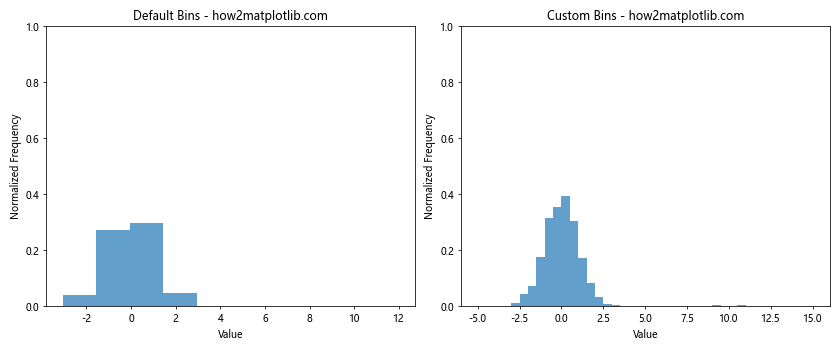
This example shows how choosing appropriate bin sizes can help reveal the true distribution of your data, including outliers, while maintaining y max 1.
Combining plt.hist y max 1 with Other Matplotlib Features
plt.hist with y max 1 can be combined with other Matplotlib features to create more informative visualizations:
Adding a Kernel Density Estimate (KDE)
import matplotlib.pyplot as plt
import numpy as np
from scipy.stats import gaussian_kde

data = np.random.normal(0, 1, 1000)

plt.hist(data, bins=30, density=True, alpha=0.7)
kde = gaussian_kde(data)
x_range = np.linspace(data.min(), data.max(), 100)
plt.plot(x_range, kde(x_range), 'r-', linewidth=2)
plt.ylim(0, 1)
plt.title("Histogram with KDE - how2matplotlib.com")
plt.xlabel("Value")
plt.ylabel("Normalized Frequency")
plt.show()
Output:
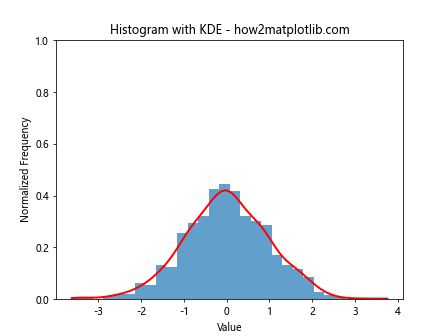
This example demonstrates how to add a Kernel Density Estimate to a plt.hist y max 1 plot.
Incorporating Error Bars
import matplotlib.pyplot as plt
import numpy as np

data = np.random.normal(0, 1, 1000)
hist, bin_edges = np.histogram(data, bins=30, density=True)
bin_centers = (bin_edges[:-1] + bin_edges[1:]) / 2
error = np.sqrt(hist) / np.sqrt(len(data))

plt.bar(bin_centers, hist, width=np.diff(bin_edges), alpha=0.7, yerr=error, capsize=5)
plt.ylim(0, 1)
plt.title("Histogram with Error Bars - how2matplotlib.com")
plt.xlabel("Value")
plt.ylabel("Normalized Frequency")
plt.show()
Output:
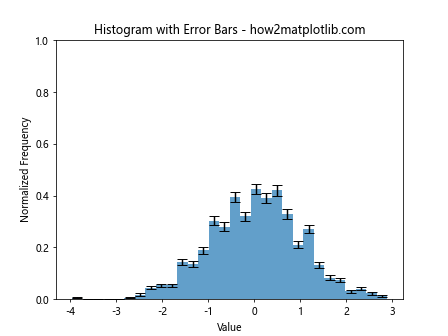
This example shows how to add error bars to a plt.hist y max 1 plot for better statistical interpretation.
Real-world Applications of plt.hist y max 1
plt.hist with y max 1 has numerous real-world applications across various fields. Let’s explore some examples:
Data Science: Comparing Feature Distributions
import matplotlib.pyplot as plt
import numpy as np

# Simulating feature distributions for two classes
class1_feature = np.random.normal(0, 1, 1000)
class2_feature = np.random.normal(2, 1.5, 1000)

plt.hist(class1_feature, bins=30, density=True, alpha=0.7, label='Class 1')
plt.hist(class2_feature, bins=30, density=True, alpha=0.7, label='Class 2')
plt.ylim(0, 1)
plt.title("Feature Distribution Comparison - how2matplotlib.com")
plt.xlabel("Feature Value")
plt.ylabel("Normalized Frequency")
plt.legend()
plt.show()
Output:
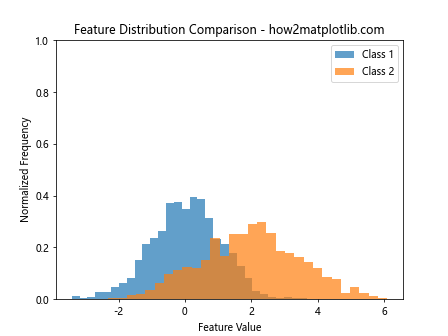
This example demonstrates how data scientists can use plt.hist with y max 1 to compare feature distributions between different classes in a dataset.
Environmental Science: Analyzing Pollution Levels
import matplotlib.pyplot as plt
import numpy as np

# Simulating pollution levels for two cities
city1_pollution = np.random.lognormal(0, 0.5, 1000)
city2_pollution = np.random.lognormal(0.5, 0.5, 1000)

plt.hist(city1_pollution, bins=30, density=True, alpha=0.7, label='City 1')
plt.hist(city2_pollution, bins=30, density=True, alpha=0.7, label='City 2')
plt.ylim(0, 1)
plt.title("Pollution Level Distribution - how2matplotlib.com")
plt.xlabel("Pollution Level (μg/m³)")
plt.ylabel("Normalized Frequency")
plt.legend()
plt.show()
Output:
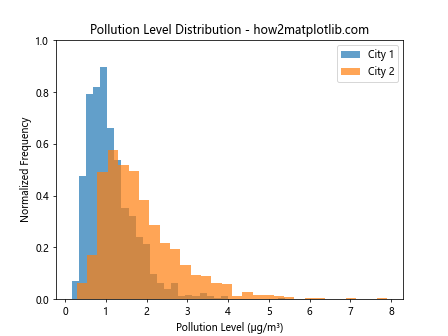
This example demonstrates how environmental scientists can use plt.hist with y max 1 to compare pollution levels between different cities.
Advanced Customization Techniques for plt.hist y max 1
To further enhance your plt.hist y max 1 plots, you can apply advanced customization techniques:
Custom Bin Edges
import matplotlib.pyplot as plt
import numpy as np

data = np.random.exponential(1, 1000)

custom_bins = [0, 0.5, 1, 2, 3, 5, 10]
plt.hist(data, bins=custom_bins, density=True, alpha=0.7)
plt.ylim(0, 1)
plt.title("Custom Bin Edges - how2matplotlib.com")
plt.xlabel("Value")
plt.ylabel("Normalized Frequency")
plt.show()
Output:
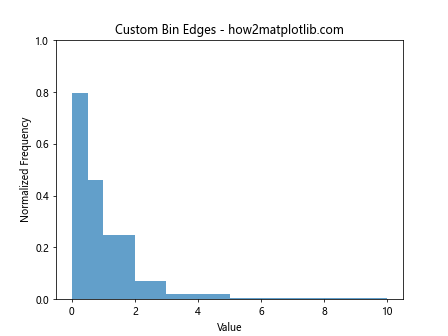
This example shows how to use custom bin edges with plt.hist y max 1 for more control over data representation.
Log-scale Histograms
import matplotlib.pyplot as plt
import numpy as np

data = np.random.lognormal(0, 1, 1000)

plt.hist(data, bins=30, density=True, alpha=0.7)
plt.xscale('log')
plt.ylim(0, 1)
plt.title("Log-scale Histogram - how2matplotlib.com")
plt.xlabel("Value (log scale)")
plt.ylabel("Normalized Frequency")
plt.show()
Output:
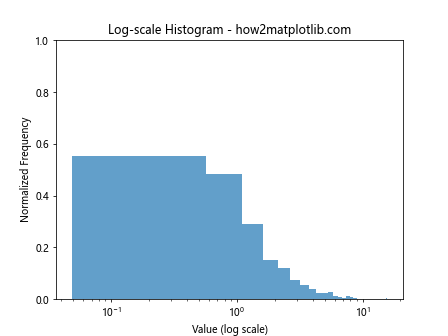
This example demonstrates how to create a log-scale histogram while maintaining y max 1.
Horizontal Histograms
import matplotlib.pyplot as plt
import numpy as np

data = np.random.normal(0, 1, 1000)

plt.hist(data, bins=30, density=True, alpha=0.7, orientation='horizontal')
plt.xlim(0, 1)
plt.title("Horizontal Histogram - how2matplotlib.com")
plt.ylabel("Value")
plt.xlabel("Normalized Frequency")
plt.show()
Output:
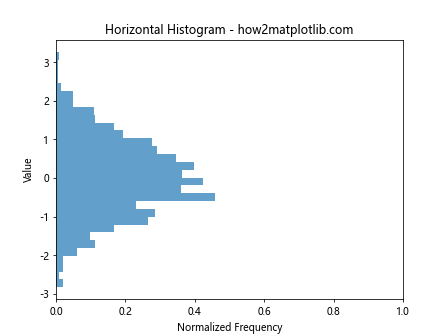
This example shows how to create a horizontal histogram using plt.hist with x max 1 (equivalent to y max 1 in vertical histograms).
Integrating plt.hist y max 1 with Other Libraries
plt.hist with y max 1 can be integrated with other libraries to create more sophisticated visualizations:
Seaborn Integration
import matplotlib.pyplot as plt
import seaborn as sns
import numpy as np

data = np.random.normal(0, 1, 1000)

sns.set_style("whitegrid")
sns.histplot(data, kde=True, stat="density", alpha=0.7)
plt.ylim(0, 1)
plt.title("Seaborn Histogram - how2matplotlib.com")
plt.xlabel("Value")
plt.ylabel("Normalized Frequency")
plt.show()
Output:
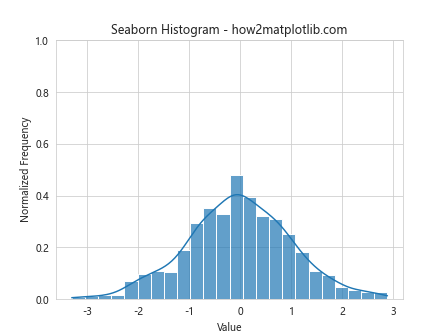
This example demonstrates how to use Seaborn to create a histogram with y max 1, integrating with Matplotlib.
Pandas Integration
import matplotlib.pyplot as plt
import pandas as pd
import numpy as np

data = pd.DataFrame({'values': np.random.normal(0, 1, 1000)})

data['values'].hist(bins=30, density=True, alpha=0.7)
plt.ylim(0, 1)
plt.title("Pandas Histogram - how2matplotlib.com")
plt.xlabel("Value")
plt.ylabel("Normalized Frequency")
plt.show()
Output:
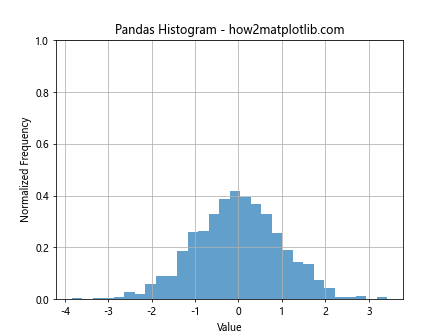
This example shows how to create a plt.hist y max 1 plot using Pandas’ built-in histogram function.
Performance Considerations for plt.hist y max 1
When working with large datasets, performance can become a concern. Here are some tips to optimize your plt.hist y max 1 plots:
- Use appropriate bin sizes to balance detail and performance
- Consider downsampling large datasets
- Use the
rangeparameter to focus on specific data ranges - Utilize the
weightsparameter for pre-computed frequencies
Let’s implement some of these tips:
import matplotlib.pyplot as plt
import numpy as np

# Generate a large dataset
data = np.random.normal(0, 1, 1000000)

# Use appropriate bin size and range
plt.hist(data, bins=100, range=(-4, 4), density=True, alpha=0.7)
plt.ylim(0, 1)
plt.title("Optimized Histogram - how2matplotlib.com")
plt.xlabel("Value")
plt.ylabel("Normalized Frequency")
plt.show()
Output:
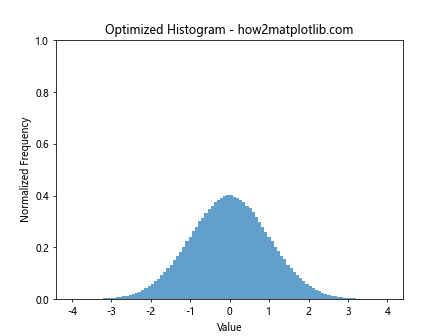
This example demonstrates how to optimize a plt.hist y max 1 plot for a large dataset by using appropriate bin sizes and focusing on a specific data range.
Troubleshooting Common Issues with plt.hist y max 1
When working with plt.hist and y max 1, you may encounter some common issues. Here’s how to troubleshoot them:
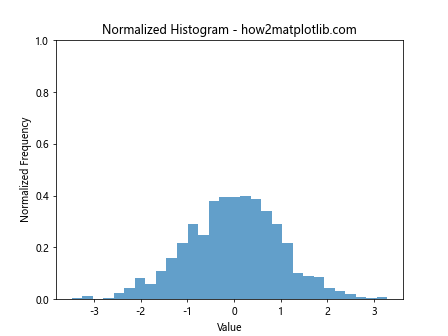
Issue 1: Histogram Not Normalized
If your histogram is not normalized (y-axis exceeds 1), ensure you’re using the density=True parameter:
import matplotlib.pyplot as plt
import numpy as np

data = np.random.normal(0, 1, 1000)

plt.hist(data, bins=30, density=True, alpha=0.7)
plt.ylim(0, 1)
plt.title("Normalized Histogram - how2matplotlib.com")
plt.xlabel("Value")
plt.ylabel("Normalized Frequency")
plt.show()
Output:
Issue 2: Unexpected Data Distribution
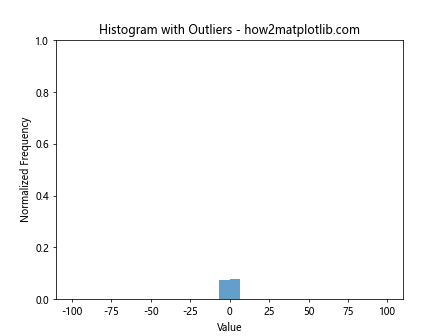
If your histogram shows an unexpected distribution, check for outliers or data errors:
import matplotlib.pyplot as plt
import numpy as np

data = np.concatenate([np.random.normal(0, 1, 990), np.array([100, -100])])

plt.hist(data, bins=30, density=True, alpha=0.7)
plt.ylim(0, 1)
plt.title("Histogram with Outliers - how2matplotlib.com")
plt.xlabel("Value")
plt.ylabel("Normalized Frequency")
plt.show()
Output:
Issue 3: Empty Bins
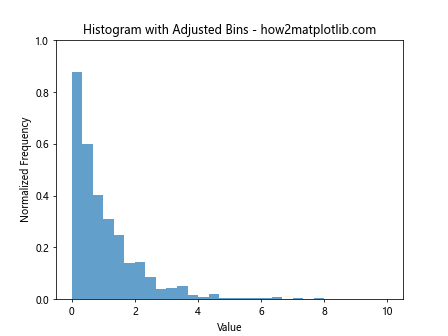
If you have empty bins in your histogram, consider adjusting the bin size or range:
import matplotlib.pyplot as plt
import numpy as np

data = np.random.exponential(1, 1000)

plt.hist(data, bins=np.linspace(0, 10, 31), density=True, alpha=0.7)
plt.ylim(0, 1)
plt.title("Histogram with Adjusted Bins - how2matplotlib.com")
plt.xlabel("Value")
plt.ylabel("Normalized Frequency")
plt.show()
Output:
plt.hist y max 1 Conclusion
plt.hist with y max 1 is a powerful tool for creating normalized histograms in Matplotlib. By setting the maximum y-axis value to 1, you can easily compare distributions across different datasets and create more interpretable visualizations. Throughout this article, we’ve explored various aspects of using plt.hist with y max 1, including basic usage, customization options, advanced techniques, and real-world applications.
Remember to consider factors such as bin size, data normalization, and appropriate scaling when creating your histograms. By following the best practices and examples provided in this guide, you’ll be well-equipped to create informative and visually appealing histograms using plt.hist with y max 1.