How to Create Normalized Histograms with plt.hist in Matplotlib
plt.hist normalized is a powerful feature in Matplotlib that allows you to create normalized histograms. Normalized histograms are essential for visualizing data distributions and comparing datasets of different sizes. In this comprehensive guide, we’ll explore the ins and outs of using plt.hist normalized, providing numerous examples and explanations to help you master this important plotting technique.
Understanding plt.hist normalized
plt.hist normalized is a parameter of the plt.hist function in Matplotlib that enables you to create histograms where the height of each bar represents a probability density rather than a count. This normalization makes it easier to compare distributions across different datasets, regardless of their sample sizes.
Let’s start with a basic example of how to use plt.hist normalized:
import matplotlib.pyplot as plt
import numpy as np

# Generate sample data
data = np.random.normal(0, 1, 1000)

# Create a normalized histogram
plt.hist(data, bins=30, density=True, alpha=0.7)
plt.title("Normalized Histogram - how2matplotlib.com")
plt.xlabel("Value")
plt.ylabel("Probability Density")
plt.show()
Output:
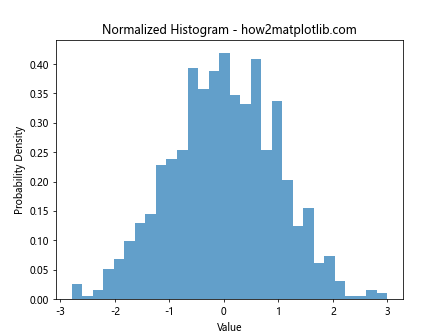
In this example, we generate random data from a normal distribution and create a normalized histogram using plt.hist. The density=True parameter is equivalent to normed=True in older versions of Matplotlib and tells the function to normalize the histogram.
Benefits of Using plt.hist normalized
Using plt.hist normalized offers several advantages:
- Comparison across datasets: Normalized histograms allow for easy comparison between datasets of different sizes.
- Probability interpretation: The y-axis represents probability density, making it easier to interpret the likelihood of values.
- Integration with probability theory: The area under a normalized histogram sums to 1, aligning with probability theory concepts.
Let’s see an example that demonstrates the benefit of using normalized histograms for comparing datasets:
import matplotlib.pyplot as plt
import numpy as np

# Generate two datasets of different sizes
data1 = np.random.normal(0, 1, 1000)
data2 = np.random.normal(0, 1, 5000)

# Create normalized histograms
plt.hist(data1, bins=30, density=True, alpha=0.7, label='Dataset 1')
plt.hist(data2, bins=30, density=True, alpha=0.7, label='Dataset 2')
plt.title("Comparing Distributions - how2matplotlib.com")
plt.xlabel("Value")
plt.ylabel("Probability Density")
plt.legend()
plt.show()
Output:
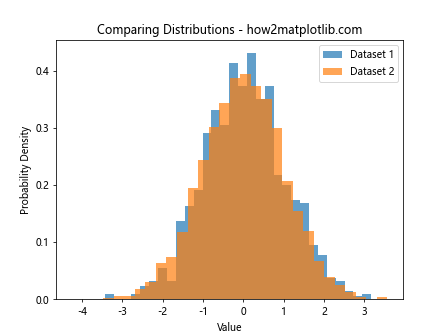
This example creates normalized histograms for two datasets of different sizes, allowing for a fair comparison of their distributions.
Customizing plt.hist normalized Plots
plt.hist normalized offers various customization options to enhance your visualizations. Let’s explore some of these options:
Adjusting Bin Width
The bin width in a histogram can significantly affect the visualization. Here’s how to adjust it:
import matplotlib.pyplot as plt
import numpy as np

data = np.random.normal(0, 1, 1000)

plt.hist(data, bins=50, density=True, alpha=0.7)
plt.title("Normalized Histogram with Custom Bins - how2matplotlib.com")
plt.xlabel("Value")
plt.ylabel("Probability Density")
plt.show()
Output:
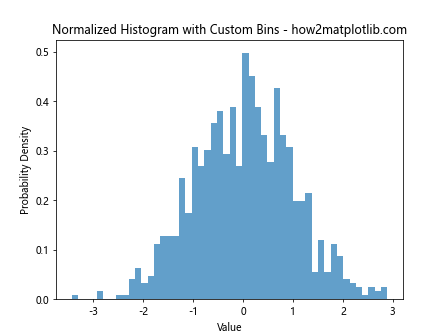
In this example, we increase the number of bins to 50, resulting in narrower bars and potentially revealing more detail in the distribution.
Changing Colors and Styles
You can customize the appearance of your normalized histogram:
import matplotlib.pyplot as plt
import numpy as np

data = np.random.exponential(2, 1000)

plt.hist(data, bins=30, density=True, alpha=0.7, color='skyblue', edgecolor='black')
plt.title("Styled Normalized Histogram - how2matplotlib.com")
plt.xlabel("Value")
plt.ylabel("Probability Density")
plt.show()
Output:
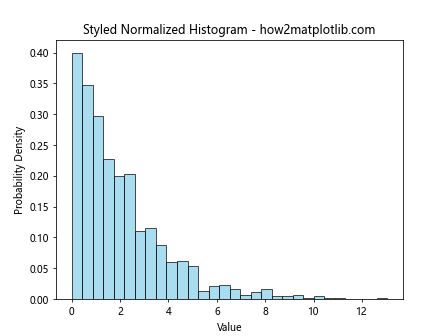
This example uses a light blue color for the bars and adds black edges for better visibility.
Advanced Techniques with plt.hist normalized
Let’s explore some more advanced techniques using plt.hist normalized:
Overlaying a Theoretical Distribution
You can overlay a theoretical distribution on your normalized histogram:
import matplotlib.pyplot as plt
import numpy as np
from scipy.stats import norm

data = np.random.normal(0, 1, 1000)

plt.hist(data, bins=30, density=True, alpha=0.7)
xmin, xmax = plt.xlim()
x = np.linspace(xmin, xmax, 100)
p = norm.pdf(x, 0, 1)
plt.plot(x, p, 'k', linewidth=2)
plt.title("Normalized Histogram with Theoretical Distribution - how2matplotlib.com")
plt.xlabel("Value")
plt.ylabel("Probability Density")
plt.show()
Output:
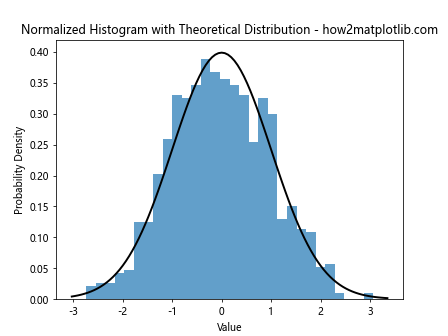
This example overlays a normal distribution curve on the normalized histogram, allowing for comparison between the sample data and the theoretical distribution.
Creating Stacked Normalized Histograms
Stacked normalized histograms can be useful for comparing multiple categories:
import matplotlib.pyplot as plt
import numpy as np

data1 = np.random.normal(0, 1, 1000)
data2 = np.random.normal(1, 1, 1000)

plt.hist([data1, data2], bins=30, density=True, alpha=0.7, stacked=True, label=['Data 1', 'Data 2'])
plt.title("Stacked Normalized Histogram - how2matplotlib.com")
plt.xlabel("Value")
plt.ylabel("Probability Density")
plt.legend()
plt.show()
Output:
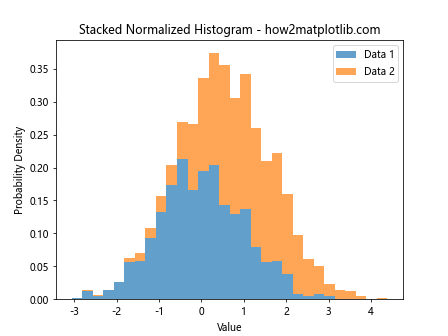
This example creates a stacked normalized histogram, which can be useful for visualizing the composition of a total distribution.
plt.hist normalized and Kernel Density Estimation
Kernel Density Estimation (KDE) is a non-parametric way to estimate the probability density function of a random variable. It can be used alongside plt.hist normalized for a more comprehensive view of the data distribution:
import matplotlib.pyplot as plt
import numpy as np
from scipy.stats import gaussian_kde

data = np.random.normal(0, 1, 1000)

plt.hist(data, bins=30, density=True, alpha=0.7)
kde = gaussian_kde(data)
xmin, xmax = plt.xlim()
x = np.linspace(xmin, xmax, 100)
plt.plot(x, kde(x), 'r-', linewidth=2)
plt.title("Normalized Histogram with KDE - how2matplotlib.com")
plt.xlabel("Value")
plt.ylabel("Probability Density")
plt.show()
Output:
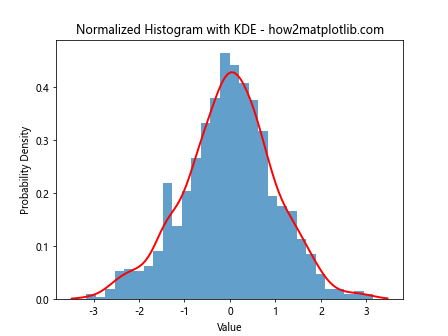
This example adds a KDE curve to the normalized histogram, providing a smooth estimate of the probability density function.
Handling Multiple Datasets with plt.hist normalized
When working with multiple datasets, plt.hist normalized can help in creating informative comparisons:
import matplotlib.pyplot as plt
import numpy as np

data1 = np.random.normal(0, 1, 1000)
data2 = np.random.normal(1, 1.5, 1000)
data3 = np.random.normal(-1, 0.5, 1000)

plt.hist([data1, data2, data3], bins=30, density=True, alpha=0.7, label=['Data 1', 'Data 2', 'Data 3'])
plt.title("Multiple Datasets Normalized Histogram - how2matplotlib.com")
plt.xlabel("Value")
plt.ylabel("Probability Density")
plt.legend()
plt.show()
Output:
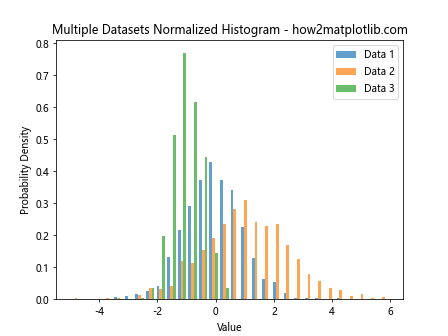
This example creates a normalized histogram for three different datasets, allowing for easy comparison of their distributions.
plt.hist normalized and Cumulative Distribution Functions
plt.hist normalized can also be used to create cumulative distribution functions (CDFs):
import matplotlib.pyplot as plt
import numpy as np

data = np.random.normal(0, 1, 1000)

plt.hist(data, bins=30, density=True, alpha=0.7, cumulative=True)
plt.title("Cumulative Normalized Histogram - how2matplotlib.com")
plt.xlabel("Value")
plt.ylabel("Cumulative Probability")
plt.show()
Output:
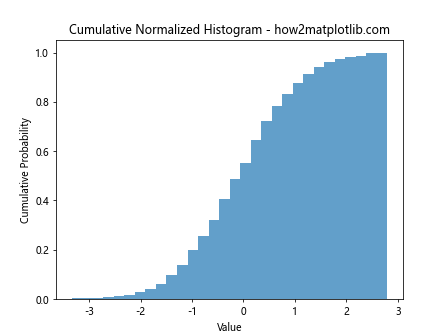
This example creates a cumulative normalized histogram, which shows the probability of a value being less than or equal to each point on the x-axis.
Combining plt.hist normalized with Other Plot Types
plt.hist normalized can be combined with other plot types for more comprehensive visualizations:
import matplotlib.pyplot as plt
import numpy as np

data = np.random.normal(0, 1, 1000)

fig, (ax1, ax2) = plt.subplots(2, 1, figsize=(8, 10))

ax1.hist(data, bins=30, density=True, alpha=0.7)
ax1.set_title("Normalized Histogram - how2matplotlib.com")
ax1.set_ylabel("Probability Density")

ax2.boxplot(data)
ax2.set_title("Box Plot - how2matplotlib.com")

plt.tight_layout()
plt.show()
Output:
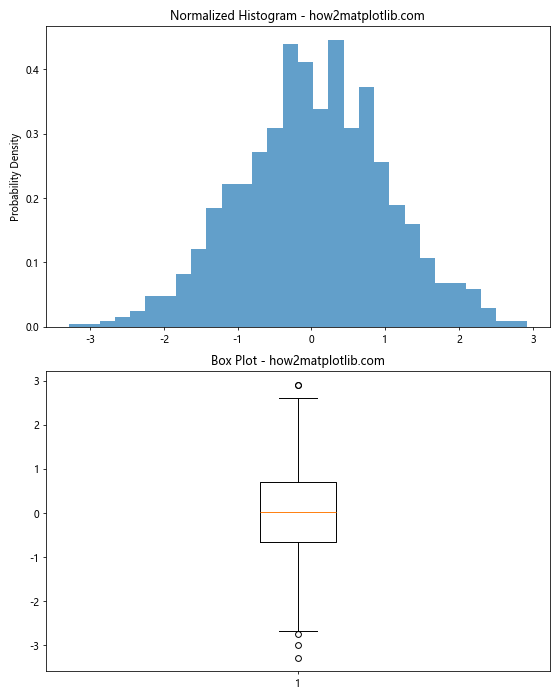
This example combines a normalized histogram with a box plot, providing both a detailed view of the distribution and a summary of its key statistics.
plt.hist normalized and Subplots
Using plt.hist normalized with subplots can be useful for comparing multiple aspects of your data:
import matplotlib.pyplot as plt
import numpy as np

data1 = np.random.normal(0, 1, 1000)
data2 = np.random.exponential(1, 1000)

fig, (ax1, ax2) = plt.subplots(1, 2, figsize=(12, 5))

ax1.hist(data1, bins=30, density=True, alpha=0.7)
ax1.set_title("Normal Distribution - how2matplotlib.com")
ax1.set_xlabel("Value")
ax1.set_ylabel("Probability Density")

ax2.hist(data2, bins=30, density=True, alpha=0.7)
ax2.set_title("Exponential Distribution - how2matplotlib.com")
ax2.set_xlabel("Value")
ax2.set_ylabel("Probability Density")

plt.tight_layout()
plt.show()
Output:
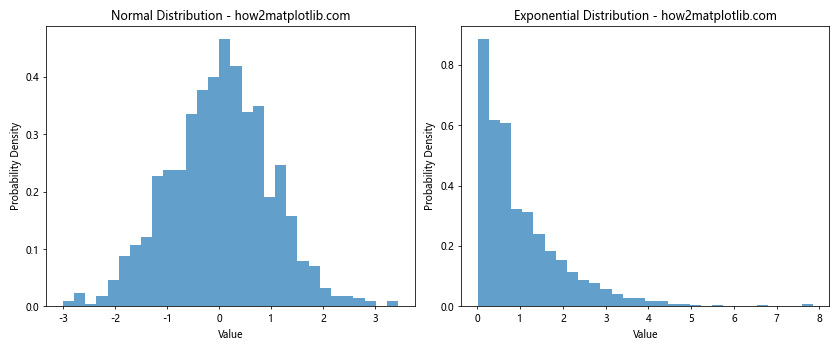
This example creates two subplots, each containing a normalized histogram of a different distribution.
Handling Outliers with plt.hist normalized
When dealing with datasets that contain outliers, plt.hist normalized can help in visualizing the main part of the distribution:
import matplotlib.pyplot as plt
import numpy as np

data = np.concatenate([np.random.normal(0, 1, 990), np.random.normal(10, 1, 10)])

plt.hist(data, bins=30, density=True, alpha=0.7)
plt.title("Normalized Histogram with Outliers - how2matplotlib.com")
plt.xlabel("Value")
plt.ylabel("Probability Density")
plt.xlim(-5, 5)  # Focus on the main part of the distribution
plt.show()
Output:
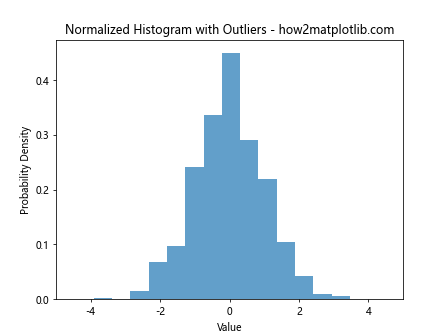
This example creates a dataset with outliers and uses plt.xlim to focus on the main part of the distribution in the normalized histogram.
plt.hist normalized and Log Scales
For datasets with a wide range of values, using a log scale with plt.hist normalized can be beneficial:
import matplotlib.pyplot as plt
import numpy as np

data = np.random.lognormal(0, 1, 1000)

plt.hist(data, bins=30, density=True, alpha=0.7)
plt.xscale('log')
plt.title("Normalized Histogram with Log Scale - how2matplotlib.com")
plt.xlabel("Value (log scale)")
plt.ylabel("Probability Density")
plt.show()
Output:
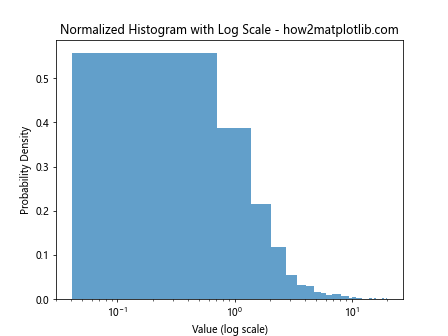
This example creates a normalized histogram of log-normally distributed data and uses a logarithmic scale on the x-axis.
Customizing Tick Labels in plt.hist normalized
You can customize the tick labels in your plt.hist normalized plots for better readability:
import matplotlib.pyplot as plt
import numpy as np

data = np.random.normal(0, 1, 1000)

plt.hist(data, bins=30, density=True, alpha=0.7)
plt.title("Normalized Histogram with Custom Ticks - how2matplotlib.com")
plt.xlabel("Value")
plt.ylabel("Probability Density")
plt.xticks(np.arange(-3, 4, 1), ['Very Low', 'Low', 'Below Avg', 'Average', 'Above Avg', 'High', 'Very High'])
plt.show()
Output:
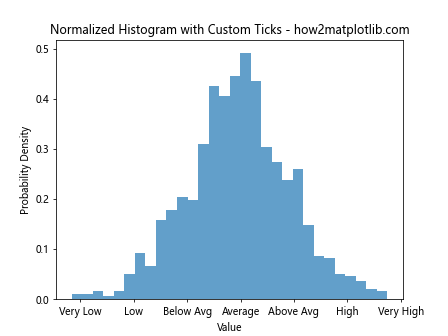
This example replaces the numeric x-axis labels with descriptive categories.
plt.hist normalized Conclusion
plt.hist normalized is a versatile tool in Matplotlib for creating normalized histograms. It allows for easy comparison of distributions, regardless of sample size, and can be customized in numerous ways to suit your specific visualization needs. By mastering plt.hist normalized, you can create more informative and visually appealing data visualizations, enhancing your ability to communicate insights from your data effectively.
Remember to experiment with different parameters and combinations to find the best way to represent your specific datasets. With practice, you’ll be able to create compelling normalized histograms that effectively convey the key features of your data distributions.