Comprehensive Guide to Using Matplotlib.artist.Artist.findobj() in Python for Data Visualization
Matplotlib.artist.Artist.findobj() in Python is a powerful method used in the Matplotlib library for finding and manipulating objects within a figure or axes. This function is an essential tool for data visualization enthusiasts and professionals alike. In this comprehensive guide, we’ll explore the various aspects of Matplotlib.artist.Artist.findobj() in Python, providing detailed explanations and practical examples to help you master this feature.
Understanding Matplotlib.artist.Artist.findobj() in Python
Matplotlib.artist.Artist.findobj() in Python is a method that belongs to the Artist class in Matplotlib. It is used to find objects that match certain criteria within a figure or axes. This method is particularly useful when you need to locate and modify specific elements in your plots.
The basic syntax of Matplotlib.artist.Artist.findobj() in Python is as follows:
artist.findobj(match=None, include_self=True)
Let’s break down the parameters:
match: This can be a callable function that takes an Artist object as an argument and returns True if the object matches the criteria.include_self: A boolean value that determines whether to include the calling Artist in the search.
Now, let’s dive into some practical examples to illustrate how to use Matplotlib.artist.Artist.findobj() in Python effectively.
Example 1: Finding all Line2D objects in a plot
import matplotlib.pyplot as plt
from matplotlib.lines import Line2D

fig, ax = plt.subplots()
ax.plot([1, 2, 3], [1, 2, 3], label='Line 1')
ax.plot([1, 2, 3], [3, 2, 1], label='Line 2')

lines = ax.findobj(Line2D)
for line in lines:
    line.set_linewidth(3)
    line.set_linestyle('--')

plt.title('How2matplotlib.com - Finding Line2D objects')
plt.show()
Output:
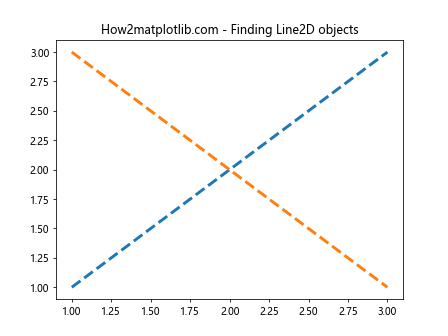
In this example, we use Matplotlib.artist.Artist.findobj() in Python to find all Line2D objects in the plot. We then modify their properties by increasing the line width and changing the line style to dashed.
Example 2: Finding objects by a custom criterion
import matplotlib.pyplot as plt

fig, ax = plt.subplots()
ax.plot([1, 2, 3], [1, 2, 3], label='Line 1', color='red')
ax.plot([1, 2, 3], [3, 2, 1], label='Line 2', color='blue')

def is_red(obj):
    return obj.get_color() == 'red'

red_objects = ax.findobj(match=is_red)
for obj in red_objects:
    obj.set_linewidth(4)

plt.title('How2matplotlib.com - Finding red objects')
plt.show()
In this example, we use Matplotlib.artist.Artist.findobj() in Python with a custom function to find all red objects in the plot. We then increase the line width of these objects.
Advanced Usage of Matplotlib.artist.Artist.findobj() in Python
Matplotlib.artist.Artist.findobj() in Python can be used in more complex scenarios to manipulate various aspects of your plots. Let’s explore some advanced use cases.
Example 3: Finding and modifying text objects
import matplotlib.pyplot as plt

fig, ax = plt.subplots()
ax.plot([1, 2, 3], [1, 2, 3], label='Line 1')
ax.plot([1, 2, 3], [3, 2, 1], label='Line 2')
ax.set_title('Original Title')
ax.set_xlabel('X-axis')
ax.set_ylabel('Y-axis')

text_objects = ax.findobj(plt.Text)
for text in text_objects:
    text.set_fontsize(14)
    text.set_color('navy')

plt.title('How2matplotlib.com - Modified Text Objects')
plt.show()
Output:
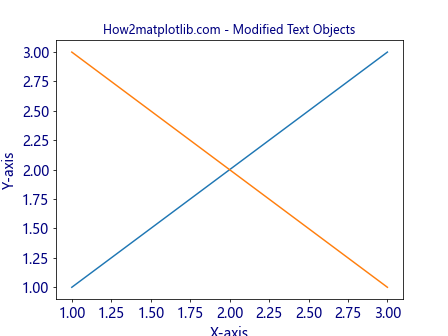
In this example, we use Matplotlib.artist.Artist.findobj() in Python to find all text objects in the plot, including the title, labels, and legend. We then modify their font size and color.
Example 4: Finding and modifying specific patches
import matplotlib.pyplot as plt
import matplotlib.patches as patches

fig, ax = plt.subplots()
rect1 = patches.Rectangle((0.1, 0.1), 0.5, 0.5, fill=False)
rect2 = patches.Rectangle((0.4, 0.4), 0.3, 0.3, fill=False)
circle = patches.Circle((0.7, 0.7), 0.2, fill=False)

ax.add_patch(rect1)
ax.add_patch(rect2)
ax.add_patch(circle)

def is_rectangle(obj):
    return isinstance(obj, patches.Rectangle)

rectangles = ax.findobj(match=is_rectangle)
for rect in rectangles:
    rect.set_linewidth(3)
    rect.set_edgecolor('red')

plt.title('How2matplotlib.com - Modified Rectangles')
plt.xlim(0, 1)
plt.ylim(0, 1)
plt.show()
Output:
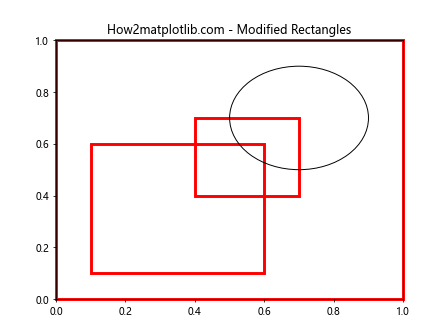
In this example, we use Matplotlib.artist.Artist.findobj() in Python to find all Rectangle objects in the plot. We then modify their line width and edge color.
Combining Matplotlib.artist.Artist.findobj() with Other Matplotlib Features
Matplotlib.artist.Artist.findobj() in Python can be combined with other Matplotlib features to create more complex and interactive visualizations. Let’s explore some examples.
Example 5: Combining with subplots
import matplotlib.pyplot as plt
import numpy as np

fig, (ax1, ax2) = plt.subplots(1, 2, figsize=(12, 5))

x = np.linspace(0, 10, 100)
ax1.plot(x, np.sin(x), label='sin(x)')
ax1.plot(x, np.cos(x), label='cos(x)')
ax1.set_title('Trigonometric Functions')

ax2.plot(x, x**2, label='x^2')
ax2.plot(x, x**3, label='x^3')
ax2.set_title('Polynomial Functions')

for ax in fig.findobj(plt.Axes):
    lines = ax.findobj(plt.Line2D)
    for line in lines:
        line.set_linewidth(2)
        line.set_alpha(0.7)

plt.suptitle('How2matplotlib.com - Modified Subplots')
plt.tight_layout()
plt.show()
Output:
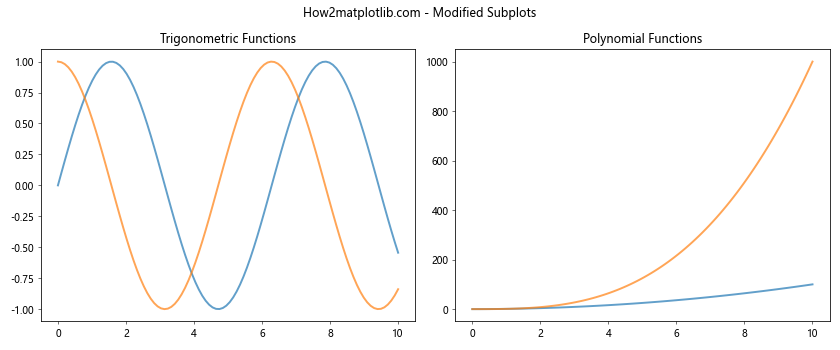
In this example, we use Matplotlib.artist.Artist.findobj() in Python to find all Axes objects in the figure, and then find all Line2D objects within each Axes. We then modify the line width and transparency of all lines across both subplots.
Example 6: Combining with legend manipulation
import matplotlib.pyplot as plt
import numpy as np

fig, ax = plt.subplots()

x = np.linspace(0, 10, 100)
ax.plot(x, np.sin(x), label='sin(x)')
ax.plot(x, np.cos(x), label='cos(x)')
ax.plot(x, np.tan(x), label='tan(x)')

legend = ax.legend()

def is_sin_line(obj):
    return isinstance(obj, plt.Line2D) and obj.get_label() == 'sin(x)'

sin_line = ax.findobj(match=is_sin_line)[0]
sin_line.set_linewidth(3)
sin_line.set_color('red')

legend_texts = legend.findobj(plt.Text)
for text in legend_texts:
    if text.get_text() == 'sin(x)':
        text.set_color('red')

plt.title('How2matplotlib.com - Modified Sin Function and Legend')
plt.show()
Output:
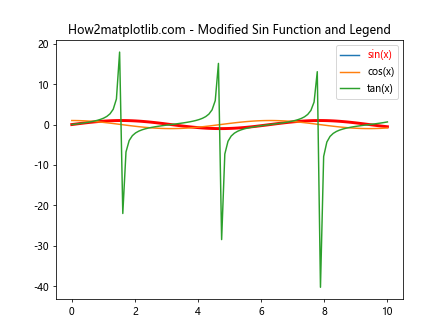
In this example, we use Matplotlib.artist.Artist.findobj() in Python to find the line representing the sin function and modify its appearance. We also use it to find and modify the corresponding legend text.
Optimizing Performance with Matplotlib.artist.Artist.findobj() in Python
When working with large or complex plots, it’s important to use Matplotlib.artist.Artist.findobj() in Python efficiently to maintain good performance. Here are some tips and examples to help you optimize your code.
Example 7: Using specific match criteria
import matplotlib.pyplot as plt
import numpy as np

fig, ax = plt.subplots()

x = np.linspace(0, 10, 1000)
for i in range(10):
    ax.plot(x, np.sin(x + i), label=f'sin(x + {i})')

def is_even_line(obj):
    return isinstance(obj, plt.Line2D) and int(obj.get_label().split()[-1][:-1]) % 2 == 0

even_lines = ax.findobj(match=is_even_line)
for line in even_lines:
    line.set_linewidth(2)
    line.set_linestyle('--')

plt.title('How2matplotlib.com - Modified Even-Numbered Lines')
plt.legend()
plt.show()
In this example, we use a specific match criterion in Matplotlib.artist.Artist.findobj() in Python to find only the even-numbered lines, reducing the number of objects that need to be processed.
Example 8: Caching findobj results
import matplotlib.pyplot as plt
import numpy as np

fig, ax = plt.subplots()

x = np.linspace(0, 10, 100)
ax.plot(x, np.sin(x), label='sin(x)')
ax.plot(x, np.cos(x), label='cos(x)')
ax.plot(x, np.tan(x), label='tan(x)')

# Cache the result of findobj
lines = ax.findobj(plt.Line2D)

def update_lines(event):
    for line in lines:
        if line.get_label() == 'sin(x)':
            line.set_linewidth(3)
        elif line.get_label() == 'cos(x)':
            line.set_linestyle('--')
        elif line.get_label() == 'tan(x)':
            line.set_alpha(0.5)
    fig.canvas.draw_idle()

plt.connect('button_press_event', update_lines)
plt.title('How2matplotlib.com - Click to Update Lines')
plt.legend()
plt.show()
Output:
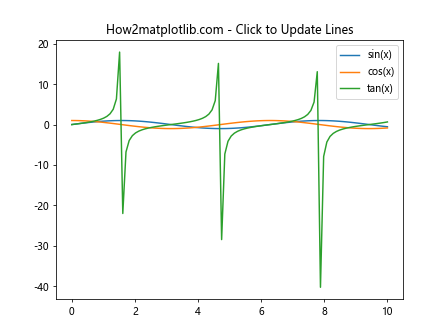
In this example, we cache the result of Matplotlib.artist.Artist.findobj() in Python to avoid repeated calls in an interactive plot. This can significantly improve performance when working with large datasets or complex plots.
Common Pitfalls and How to Avoid Them
When using Matplotlib.artist.Artist.findobj() in Python, there are some common pitfalls that you should be aware of. Let’s explore these issues and how to avoid them.
Example 9: Handling empty results
import matplotlib.pyplot as plt

fig, ax = plt.subplots()

ax.plot([1, 2, 3], [1, 2, 3], label='Line 1')

def is_blue_line(obj):
    return isinstance(obj, plt.Line2D) and obj.get_color() == 'blue'

blue_lines = ax.findobj(match=is_blue_line)

if blue_lines:
    for line in blue_lines:
        line.set_linewidth(3)
else:
    print("No blue lines found")

plt.title('How2matplotlib.com - Handling Empty Results')
plt.show()
Output:
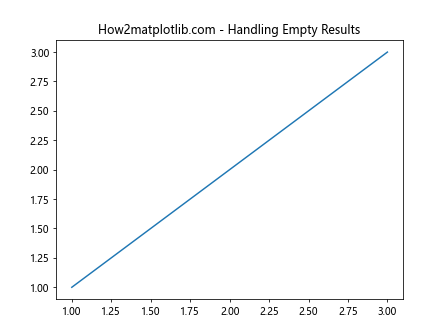
In this example, we demonstrate how to handle cases where Matplotlib.artist.Artist.findobj() in Python returns an empty result. It’s important to check if the result is empty before attempting to modify the objects.
Example 10: Avoiding unintended modifications
import matplotlib.pyplot as plt

fig, (ax1, ax2) = plt.subplots(1, 2, figsize=(10, 5))

ax1.plot([1, 2, 3], [1, 2, 3], label='Line 1')
ax2.plot([1, 2, 3], [3, 2, 1], label='Line 2')

def modify_line(obj):
    if isinstance(obj, plt.Line2D):
        obj.set_linewidth(3)
    return False

ax1.findobj(match=modify_line)

plt.suptitle('How2matplotlib.com - Avoiding Unintended Modifications')
plt.show()
Output:
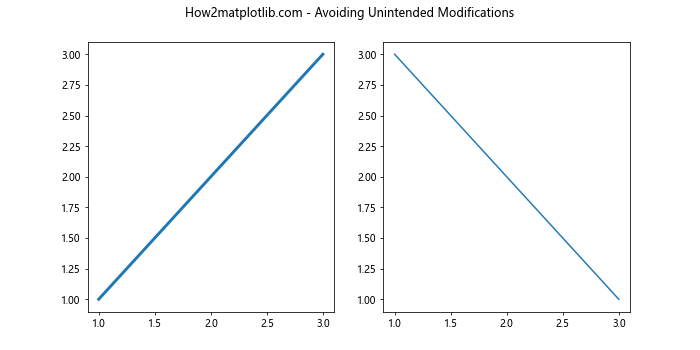
In this example, we show how to avoid unintended modifications when using Matplotlib.artist.Artist.findobj() in Python. By returning False in the match function, we ensure that only the desired objects are modified.
Advanced Techniques with Matplotlib.artist.Artist.findobj() in Python
Let’s explore some advanced techniques that leverage the power of Matplotlib.artist.Artist.findobj() in Python for more complex visualizations and data analysis tasks.
Example 11: Dynamic color mapping
import matplotlib.pyplot as plt
import numpy as np

fig, ax = plt.subplots()

x = np.linspace(0, 10, 100)
for i in range(5):
    ax.plot(x, np.sin(x + i), label=f'sin(x + {i})')

lines = ax.findobj(plt.Line2D)
colors = plt.cm.viridis(np.linspace(0, 1, len(lines)))

for line, color in zip(lines, colors):
    line.set_color(color)

plt.title('How2matplotlib.com - Dynamic Color Mapping')
plt.legend()
plt.show()
Output:
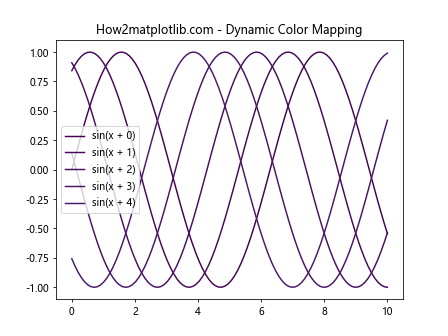
In this example, we use Matplotlib.artist.Artist.findobj() in Python to find all Line2D objects and apply a dynamic color mapping using a colormap.
Example 12: Interactive object highlighting
import matplotlib.pyplot as plt
import numpy as np

fig, ax = plt.subplots()

x = np.linspace(0, 10, 100)
ax.plot(x, np.sin(x), label='sin(x)')
ax.plot(x, np.cos(x), label='cos(x)')
ax.plot(x, np.tan(x), label='tan(x)')

lines = ax.findobj(plt.Line2D)
original_colors = [line.get_color() for line in lines]

def highlight_line(event):
    if event.inaxes == ax:
        for line, original_color in zip(lines, original_colors):
            contains, _ = line.contains(event)
            if contains:
                line.set_linewidth(4)
                line.set_color('red')
            else:
                line.set_linewidth(1)
                line.set_color(original_color)
        fig.canvas.draw_idle()

fig.canvas.mpl_connect('motion_notify_event', highlight_line)

plt.title('How2matplotlib.com - Interactive Line Highlighting')
plt.legend()
plt.show()
Output:
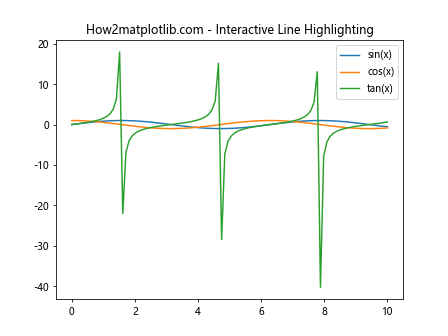
In this example, we use Matplotlib.artist.Artist.findobj() in Python to create an interactive plot where lines are highlighted when the mouse hovers over them.
Integrating Matplotlib.artist.Artist.findobj() with Data Analysis Workflows
Matplotlib.artist.Artist.findobj() in Python can be integrated into larger data analysis workflows to create more dynamic and informative visualizations. Let’s explore some examples of how this can be achieved.
Example 13: Highlighting data points based on external criteria
import matplotlib.pyplot as plt
import numpy as np

fig, ax = plt.subplots()

np.random.seed(42)
x = np.random.rand(100)
y = np.random.rand(100)
colors = np.random.rand(100)

scatter = ax.scatter(x, y, c=colors, cmap='viridis')

def highlight_top_values(threshold=0.8):
    points = ax.findobj(plt.PathCollection)[0]
    facecolors = points.get_facecolors()
    sizes = points.get_sizes()

    for i, (x, y) in enumerate(zip(points.get_offsets()[:, 0], points.get_offsets()[:, 1])):
        if colors[i] > threshold:
            facecolors[i] = [1, 0, 0, 1]  # Red
            sizes[i] = 100

    points.set_facecolors(facecolors)
    points.set_sizes(sizes)
    fig.canvas.draw_idle()

plt.colorbar(scatter)
plt.title('How2matplotlib.com - Highlighting Top Values')
plt.button('Highlight Top Values', highlight_top_values)
plt.show()
In this example, we use Matplotlib.artist.Artist.findobj() in Python to find the scatter plot points and highlight those with values above a certain threshold. This demonstrates how Matplotlib.artist.Artist.findobj() can be used to create interactive data exploration tools.
Example 14: Updating plot elements based on real-time data
import matplotlib.pyplot as plt
import numpy as np
from matplotlib.animation import FuncAnimation

fig, ax = plt.subplots()

x = np.linspace(0, 10, 100)
line, = ax.plot(x, np.sin(x))

def update(frame):
    y = np.sin(x + frame / 10)
    line.set_ydata(y)

    text_objects = ax.findobj(plt.Text)
    for text in text_objects:
        if text.get_text().startswith('Max:'):
            text.set_text(f'Max: {y.max():.2f}')
            break
    else:
        ax.text(0.02, 0.95, f'Max: {y.max():.2f}', transform=ax.transAxes)

    return line,

ani = FuncAnimation(fig, update, frames=100, interval=50, blit=True)

plt.title('How2matplotlib.com - Real-time Data Update')
plt.show()
Output:
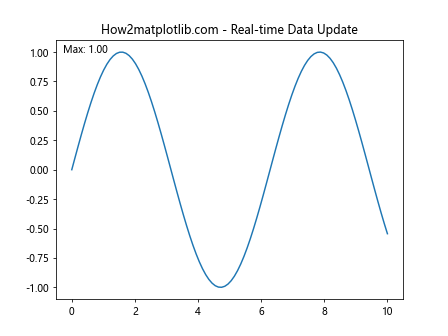
In this example, we use Matplotlib.artist.Artist.findobj() in Python to find and update text objects in an animated plot. This demonstrates how Matplotlib.artist.Artist.findobj() can be used in dynamic, real-time data visualization scenarios.
Best Practices for Using Matplotlib.artist.Artist.findobj() in Python
To make the most of Matplotlib.artist.Artist.findobj() in Python, it’s important to follow some best practices. Let’s explore these practices with some examples.
Example 15: Efficient object filtering
import matplotlib.pyplot as plt
import numpy as np

fig, ax = plt.subplots()

x = np.linspace(0, 10, 100)
for i in range(10):
    ax.plot(x, np.sin(x + i), label=f'sin(x + {i})')

def efficient_filter(obj):
    return isinstance(obj, plt.Line2D) and 'sin' in obj.get_label()

sin_lines = ax.findobj(match=efficient_filter)

for line in sin_lines:
    line.set_linewidth(2)
    line.set_alpha(0.7)

plt.title('How2matplotlib.com - Efficient Object Filtering')
plt.legend()
plt.show()
Output:
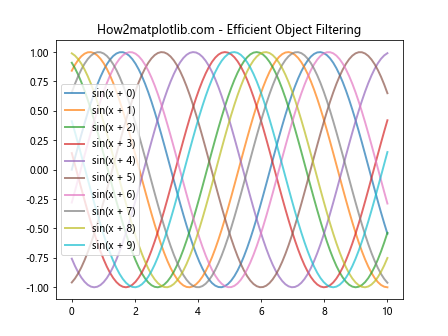
In this example, we demonstrate an efficient way to filter objects using Matplotlib.artist.Artist.findobj() in Python. By combining type checking and label filtering in a single function, we reduce the number of function calls and improve performance.
Example 16: Modular code structure
import matplotlib.pyplot as plt
import numpy as np

def create_plot():
    fig, ax = plt.subplots()
    x = np.linspace(0, 10, 100)
    ax.plot(x, np.sin(x), label='sin(x)')
    ax.plot(x, np.cos(x), label='cos(x)')
    return fig, ax

def find_and_modify_lines(ax, color='red', width=2):
    lines = ax.findobj(plt.Line2D)
    for line in lines:
        line.set_color(color)
        line.set_linewidth(width)

def main():
    fig, ax = create_plot()
    find_and_modify_lines(ax)
    plt.title('How2matplotlib.com - Modular Code Structure')
    plt.legend()
    plt.show()

if __name__ == '__main__':
    main()
In this example, we demonstrate a modular code structure that separates plot creation, object manipulation, and the main execution flow. This approach makes it easier to maintain and reuse code that utilizes Matplotlib.artist.Artist.findobj() in Python.
Advanced Applications of Matplotlib.artist.Artist.findobj() in Python
Matplotlib.artist.Artist.findobj() in Python can be used in more advanced applications to create complex visualizations and data analysis tools. Let’s explore some of these advanced applications.
Example 17: Custom object grouping and manipulation
import matplotlib.pyplot as plt
import numpy as np

fig, ax = plt.subplots()

x = np.linspace(0, 10, 100)
for i in range(5):
    ax.plot(x, np.sin(x + i), label=f'Group A: sin(x + {i})')
    ax.plot(x, np.cos(x + i), label=f'Group B: cos(x + {i})')

def group_lines(ax):
    lines = ax.findobj(plt.Line2D)
    groups = {'A': [], 'B': []}
    for line in lines:
        if 'Group A' in line.get_label():
            groups['A'].append(line)
        elif 'Group B' in line.get_label():
            groups['B'].append(line)
    return groups

grouped_lines = group_lines(ax)

for line in grouped_lines['A']:
    line.set_color('red')
    line.set_linestyle('-')

for line in grouped_lines['B']:
    line.set_color('blue')
    line.set_linestyle('--')

plt.title('How2matplotlib.com - Custom Object Grouping')
plt.legend()
plt.show()
Output:
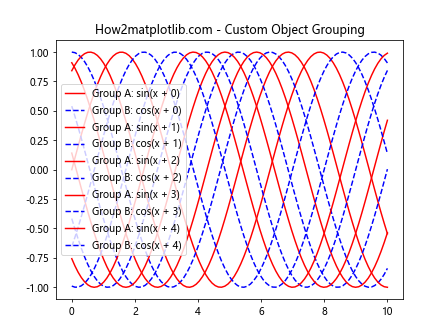
In this example, we use Matplotlib.artist.Artist.findobj() in Python to group lines based on their labels and apply different styles to each group. This demonstrates how Matplotlib.artist.Artist.findobj() can be used to create more organized and visually distinct plots.
Example 18: Interactive legend manipulation
import matplotlib.pyplot as plt
import numpy as np

fig, ax = plt.subplots()

x = np.linspace(0, 10, 100)
ax.plot(x, np.sin(x), label='sin(x)')
ax.plot(x, np.cos(x), label='cos(x)')
ax.plot(x, np.tan(x), label='tan(x)')

legend = ax.legend()

def toggle_line_visibility(event):
    if event.inaxes == legend.axes:
        for legend_line, orig_line in zip(legend.get_lines(), ax.findobj(plt.Line2D)):
            if legend_line.contains(event)[0]:
                visible = not orig_line.get_visible()
                orig_line.set_visible(visible)
                legend_line.set_alpha(1.0 if visible else 0.2)
                fig.canvas.draw_idle()

fig.canvas.mpl_connect('button_press_event', toggle_line_visibility)

plt.title('How2matplotlib.com - Interactive Legend')
plt.show()
Output:
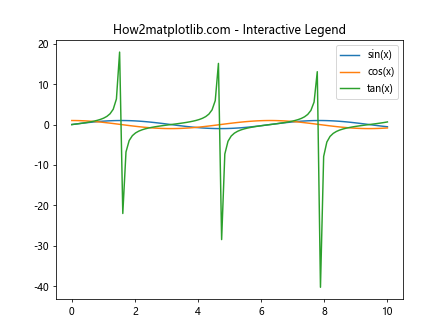
In this example, we use Matplotlib.artist.Artist.findobj() in Python to create an interactive legend where clicking on legend items toggles the visibility of the corresponding lines. This demonstrates how Matplotlib.artist.Artist.findobj() can be used to enhance user interaction with plots.
Troubleshooting Common Issues with Matplotlib.artist.Artist.findobj() in Python
When working with Matplotlib.artist.Artist.findobj() in Python, you may encounter some common issues. Let’s explore these issues and how to resolve them.
Example 19: Dealing with nested artists
import matplotlib.pyplot as plt
import numpy as np

fig, (ax1, ax2) = plt.subplots(1, 2, figsize=(10, 5))

x = np.linspace(0, 10, 100)
ax1.plot(x, np.sin(x), label='sin(x)')
ax2.plot(x, np.cos(x), label='cos(x)')

def find_all_lines(artist):
    lines = artist.findobj(plt.Line2D)
    if isinstance(artist, plt.Figure):
        for ax in artist.axes:
            lines.extend(find_all_lines(ax))
    return lines

all_lines = find_all_lines(fig)

for line in all_lines:
    line.set_linewidth(3)
    line.set_alpha(0.7)

plt.suptitle('How2matplotlib.com - Dealing with Nested Artists')
plt.show()
Output:
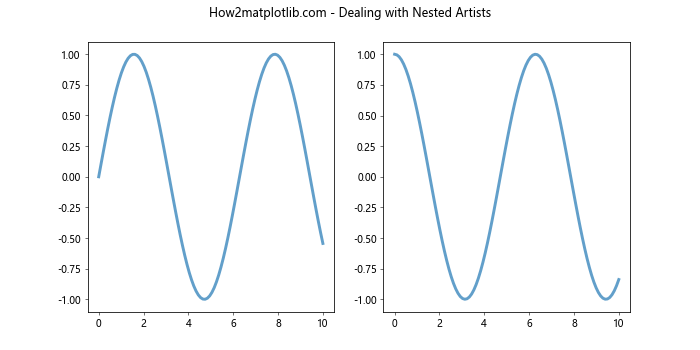
In this example, we demonstrate how to deal with nested artists when using Matplotlib.artist.Artist.findobj() in Python. By recursively searching through the figure and its axes, we can find all Line2D objects regardless of their hierarchy.
Example 20: Handling dynamically created objects
import matplotlib.pyplot as plt
import numpy as np

fig, ax = plt.subplots()

x = np.linspace(0, 10, 100)
line, = ax.plot(x, np.sin(x), label='sin(x)')

def add_random_point(event):
    if event.inaxes == ax:
        ax.plot(event.xdata, event.ydata, 'ro')
        fig.canvas.draw_idle()

def change_all_colors(event):
    if event.key == 'c':
        all_artists = ax.findobj()
        for artist in all_artists:
            if isinstance(artist, plt.Line2D):
                artist.set_color('blue')
            elif isinstance(artist, plt.Circle):
                artist.set_facecolor('green')
        fig.canvas.draw_idle()

fig.canvas.mpl_connect('button_press_event', add_random_point)
fig.canvas.mpl_connect('key_press_event', change_all_colors)

plt.title('How2matplotlib.com - Handling Dynamic Objects')
plt.show()
Output:
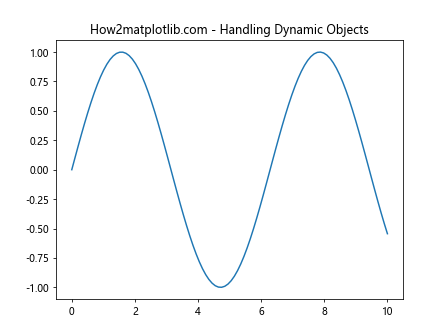
In this example, we demonstrate how to handle dynamically created objects when using Matplotlib.artist.Artist.findobj() in Python. By searching for all artists after new objects are added, we can ensure that all objects, including those created dynamically, are modified.
Conclusion
Matplotlib.artist.Artist.findobj() in Python is a powerful tool for manipulating and customizing plots in Matplotlib. Throughout this comprehensive guide, we’ve explored various aspects of this method, from basic usage to advanced applications. We’ve seen how Matplotlib.artist.Artist.findobj() can be used to find specific objects, modify their properties, create interactive visualizations, and integrate with larger data analysis workflows.