Comprehensive Guide to Matplotlib.artist.Artist.format_cursor_data() in Python
Matplotlib.artist.Artist.format_cursor_data() in Python is a powerful method that plays a crucial role in customizing the display of cursor data in Matplotlib plots. This function is an essential component of the Matplotlib library, which is widely used for creating static, animated, and interactive visualizations in Python. In this comprehensive guide, we’ll explore the intricacies of Matplotlib.artist.Artist.format_cursor_data(), its usage, and its impact on data visualization.
Understanding Matplotlib.artist.Artist.format_cursor_data()
Matplotlib.artist.Artist.format_cursor_data() is a method that belongs to the Artist class in Matplotlib. This method is responsible for formatting the cursor data that is displayed when hovering over a plot element. By default, it returns a string representation of the x and y coordinates of the cursor position. However, the real power of this method lies in its ability to be overridden to provide custom formatting for specific types of data.
Let’s start with a simple example to illustrate the basic usage of Matplotlib.artist.Artist.format_cursor_data():
import matplotlib.pyplot as plt
import numpy as np

class CustomArtist(plt.Artist):
    def format_cursor_data(self, data):
        return f"Custom data: {data:.2f} (how2matplotlib.com)"

fig, ax = plt.subplots()
x = np.linspace(0, 10, 100)
y = np.sin(x)
line, = ax.plot(x, y)
line.__class__ = CustomArtist

plt.show()
Output:
In this example, we create a custom Artist class that overrides the format_cursor_data() method. When you hover over the plot, you’ll see the custom formatted data instead of the default coordinate display.
Customizing Cursor Data Format for Different Plot Types
Matplotlib.artist.Artist.format_cursor_data() can be customized for various types of plots to provide more meaningful information when hovering over data points. Let’s explore how to implement this for different plot types.
Line Plots
For line plots, we might want to display both the x and y values with specific formatting:
import matplotlib.pyplot as plt
import numpy as np

class CustomLine(plt.Line2D):
    def format_cursor_data(self, data):
        return f"X: {data[0]:.2f}, Y: {data[1]:.2f} (how2matplotlib.com)"

fig, ax = plt.subplots()
x = np.linspace(0, 10, 100)
y = np.sin(x)
line = CustomLine(x, y)
ax.add_line(line)
ax.set_xlim(0, 10)
ax.set_ylim(-1, 1)

plt.show()
Output:
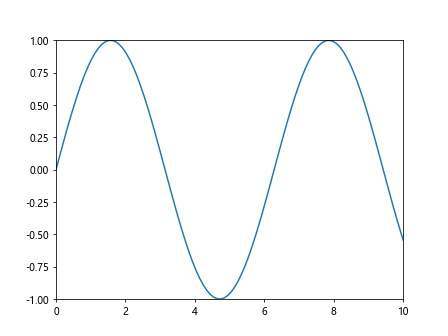
This example creates a custom Line2D class that formats the cursor data to show both x and y values with two decimal places.
Scatter Plots
For scatter plots, we might want to include additional information about each point:
import matplotlib.pyplot as plt
import numpy as np

class CustomScatter(plt.PathCollection):
    def format_cursor_data(self, data):
        return f"Point: ({data[0]:.2f}, {data[1]:.2f}), Size: {data[2]:.2f} (how2matplotlib.com)"

fig, ax = plt.subplots()
x = np.random.rand(50)
y = np.random.rand(50)
sizes = np.random.rand(50) * 100

scatter = ax.scatter(x, y, s=sizes)
scatter.__class__ = CustomScatter

plt.show()
In this example, we customize the cursor data for a scatter plot to include the point coordinates and the size of each point.
Bar Plots
For bar plots, we might want to display the category and value of each bar:
import matplotlib.pyplot as plt
import numpy as np

class CustomBar(plt.Rectangle):
    def format_cursor_data(self, data):
        return f"Category: {self.get_x():.0f}, Value: {data:.2f} (how2matplotlib.com)"

fig, ax = plt.subplots()
categories = range(5)
values = np.random.rand(5) * 10

bars = ax.bar(categories, values)
for bar in bars:
    bar.__class__ = CustomBar

plt.show()
Output:
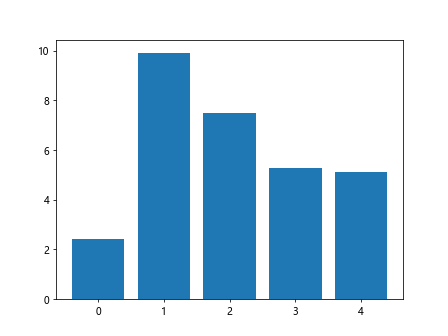
This example customizes the cursor data for a bar plot to show the category and value of each bar.
Advanced Formatting Techniques
Matplotlib.artist.Artist.format_cursor_data() can be used to implement more advanced formatting techniques. Let’s explore some of these possibilities.
Formatting Date Data
When working with time series data, it’s often useful to format the cursor data to display dates in a readable format:
import matplotlib.pyplot as plt
import numpy as np
from datetime import datetime, timedelta

class DateLine(plt.Line2D):
    def format_cursor_data(self, data):
        date = datetime.fromordinal(int(data[0])).strftime('%Y-%m-%d')
        return f"Date: {date}, Value: {data[1]:.2f} (how2matplotlib.com)"

fig, ax = plt.subplots()
dates = [datetime.now() + timedelta(days=i) for i in range(30)]
values = np.random.rand(30) * 100

line = DateLine(dates, values)
ax.add_line(line)
ax.set_xlim(dates[0], dates[-1])
ax.set_ylim(0, 100)

plt.show()
Output:
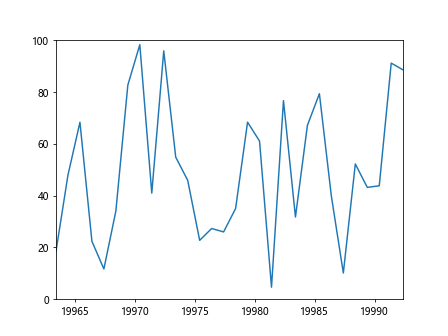
This example formats the cursor data to display dates in a YYYY-MM-DD format along with the corresponding value.
Formatting Categorical Data
For plots with categorical data, we can customize the cursor data to display category names instead of numeric indices:
import matplotlib.pyplot as plt
import numpy as np

class CategoryLine(plt.Line2D):
    def __init__(self, x, y, categories, **kwargs):
        super().__init__(x, y, **kwargs)
        self.categories = categories

    def format_cursor_data(self, data):
        category = self.categories[int(data[0])]
        return f"Category: {category}, Value: {data[1]:.2f} (how2matplotlib.com)"

fig, ax = plt.subplots()
categories = ['A', 'B', 'C', 'D', 'E']
x = range(len(categories))
y = np.random.rand(len(categories)) * 10

line = CategoryLine(x, y, categories)
ax.add_line(line)
ax.set_xlim(-0.5, len(categories) - 0.5)
ax.set_ylim(0, 10)

plt.show()
Output:
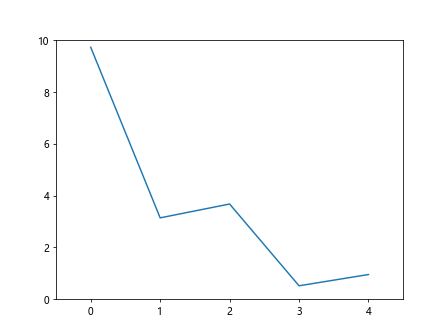
This example uses a custom Line2D class that maps numeric x-values to category names in the cursor data display.
Implementing Matplotlib.artist.Artist.format_cursor_data() for Custom Artists
When creating custom Artist subclasses, implementing Matplotlib.artist.Artist.format_cursor_data() can greatly enhance the interactivity of your plots. Let’s look at an example of a custom artist that represents a circular marker with a custom cursor data format:
import matplotlib.pyplot as plt
import numpy as np

class CustomMarker(plt.Circle):
    def __init__(self, xy, radius, **kwargs):
        super().__init__(xy, radius, **kwargs)
        self.center = xy

    def format_cursor_data(self, data):
        distance = np.sqrt((data[0] - self.center[0])**2 + (data[1] - self.center[1])**2)
        return f"Center: ({self.center[0]:.2f}, {self.center[1]:.2f}), Distance: {distance:.2f} (how2matplotlib.com)"

fig, ax = plt.subplots()
marker = CustomMarker((0.5, 0.5), 0.1, facecolor='red')
ax.add_artist(marker)
ax.set_xlim(0, 1)
ax.set_ylim(0, 1)

plt.show()
Output:
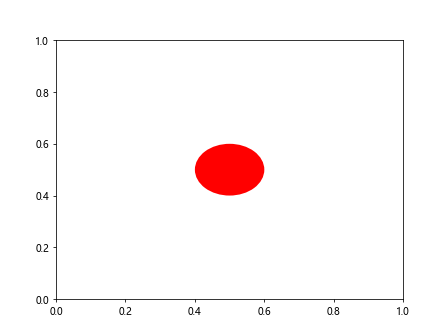
In this example, we create a custom circular marker that displays its center coordinates and the distance from the cursor to the center when hovered over.
Handling Multiple Artists with Matplotlib.artist.Artist.format_cursor_data()
When dealing with plots that contain multiple artists, it’s important to consider how Matplotlib.artist.Artist.format_cursor_data() will behave. By default, Matplotlib will use the format_cursor_data() method of the topmost artist under the cursor. However, we can implement more complex behavior by overriding the format_coord() method of the Axes object.
Here’s an example that demonstrates how to handle multiple artists:
import matplotlib.pyplot as plt
import numpy as np

class CustomLine(plt.Line2D):
    def format_cursor_data(self, data):
        return f"Line - X: {data[0]:.2f}, Y: {data[1]:.2f} (how2matplotlib.com)"

class CustomScatter(plt.PathCollection):
    def format_cursor_data(self, data):
        return f"Scatter - X: {data[0]:.2f}, Y: {data[1]:.2f} (how2matplotlib.com)"

fig, ax = plt.subplots()

x = np.linspace(0, 10, 100)
y1 = np.sin(x)
y2 = np.cos(x)

line1 = CustomLine(x, y1, color='blue')
line2 = CustomLine(x, y2, color='red')
scatter = ax.scatter(x[::10], y1[::10], c='green')
scatter.__class__ = CustomScatter

ax.add_line(line1)
ax.add_line(line2)

def format_coord(x, y):
    artists = ax.get_children()
    for artist in reversed(artists):
        if hasattr(artist, 'contains') and artist.contains(plt.Point(x, y))[0]:
            return artist.format_cursor_data((x, y))
    return f"Background - X: {x:.2f}, Y: {y:.2f} (how2matplotlib.com)"

ax.format_coord = format_coord

plt.show()
This example creates a plot with multiple artists (two lines and a scatter plot) and implements a custom format_coord() method that checks which artist is under the cursor and uses its format_cursor_data() method accordingly.
Integrating Matplotlib.artist.Artist.format_cursor_data() with Interactive Features
Matplotlib.artist.Artist.format_cursor_data() can be particularly useful when combined with other interactive features of Matplotlib. Let’s explore how to integrate this method with tooltips and hover effects.
Implementing Hover Effects
We can also use Matplotlib.artist.Artist.format_cursor_data() to implement hover effects that change the appearance of plot elements:
import matplotlib.pyplot as plt
import numpy as np

class HoverLine(plt.Line2D):
    def __init__(self, *args, **kwargs):
        super().__init__(*args, **kwargs)
        self.original_color = self.get_color()

    def format_cursor_data(self, data):
        return f"X: {data[0]:.2f}, Y: {data[1]:.2f} (how2matplotlib.com)"

    def handle_hover(self, event):
        if self.contains(event)[0]:
            self.set_color('red')
            self.set_linewidth(3)
            plt.gcf().canvas.draw_idle()
        else:
            self.set_color(self.original_color)
            self.set_linewidth(1)
            plt.gcf().canvas.draw_idle()

fig, ax = plt.subplots()
x = np.linspace(0, 10, 100)
y = np.sin(x)

line = HoverLine(x, y)
ax.add_line(line)
ax.set_xlim(0, 10)
ax.set_ylim(-1, 1)

fig.canvas.mpl_connect("motion_notify_event", line.handle_hover)

plt.show()
Output:
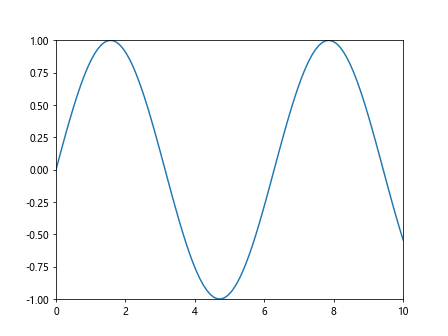
This example creates a line plot that changes color and thickness when hovered over, while also displaying the formatted cursor data.
Best Practices for Using Matplotlib.artist.Artist.format_cursor_data()
When working with Matplotlib.artist.Artist.format_cursor_data(), it’s important to follow some best practices to ensure your visualizations are both informative and performant:
- Keep it simple: While it’s tempting to include a lot of information in the cursor data, remember that users will be reading this information quickly as they move their cursor. Stick to the most important details.
Use appropriate precision: Format numeric values with a precision that makes sense for your data. Too many decimal places can make the information harder to read at a glance.
Consider performance: If your format_cursor_data() method involves complex calculations, it may slow down the responsiveness of your plot. Try to keep the calculations simple and efficient.
Be consistent: If you’re customizing cursor data for multiple types of plots in the same figure, try to use a consistent format across all of them.
Handle edge cases: Make sure your format_cursor_data() method can handle edge cases, such as NaN values or data points at the extremes of your plot.
Here’s an example that demonstrates these best practices: