Comprehensive Guide to Matplotlib.artist.Artist.get_alpha() in Python
Matplotlib.artist.Artist.get_alpha() in Python is a powerful method that allows you to retrieve the alpha (transparency) value of an Artist object in Matplotlib. This function is essential for managing the visibility and blending of graphical elements in your plots. In this comprehensive guide, we’ll explore the ins and outs of Matplotlib.artist.Artist.get_alpha(), providing detailed explanations, numerous examples, and practical use cases to help you master this important aspect of data visualization with Matplotlib.
Understanding Matplotlib.artist.Artist.get_alpha() in Python
Matplotlib.artist.Artist.get_alpha() in Python is a method that belongs to the Artist class in Matplotlib. The Artist class is the base class for all visible elements in a Matplotlib figure, including lines, text, patches, and more. The get_alpha() method specifically returns the alpha value of an Artist object, which determines its transparency level.
Let’s start with a simple example to demonstrate how to use Matplotlib.artist.Artist.get_alpha() in Python:
import matplotlib.pyplot as plt

# Create a figure and axis
fig, ax = plt.subplots()

# Create a circle patch
circle = plt.Circle((0.5, 0.5), 0.2, alpha=0.7)
ax.add_patch(circle)

# Get the alpha value of the circle
alpha_value = circle.get_alpha()

# Print the alpha value
print(f"The alpha value of the circle is: {alpha_value}")

plt.title("How2Matplotlib.com: Using get_alpha()")
plt.show()
Output:
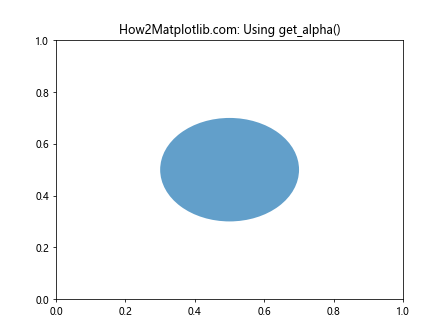
In this example, we create a circle patch with an alpha value of 0.7. We then use the get_alpha() method to retrieve this value and print it. This demonstrates the basic usage of Matplotlib.artist.Artist.get_alpha() in Python.
The Importance of Alpha in Matplotlib
Before diving deeper into Matplotlib.artist.Artist.get_alpha() in Python, it’s crucial to understand the significance of alpha values in data visualization. Alpha represents the opacity or transparency of an object, ranging from 0 (completely transparent) to 1 (completely opaque).
Here’s an example that illustrates the effect of different alpha values:
import matplotlib.pyplot as plt
import numpy as np

# Create data
x = np.linspace(0, 10, 100)
y1 = np.sin(x)
y2 = np.cos(x)

# Create a figure and axis
fig, ax = plt.subplots()

# Plot lines with different alpha values
line1 = ax.plot(x, y1, label='Sine', alpha=0.5)[0]
line2 = ax.plot(x, y2, label='Cosine', alpha=1.0)[0]

# Get and print alpha values
print(f"Alpha of Sine: {line1.get_alpha()}")
print(f"Alpha of Cosine: {line2.get_alpha()}")

plt.title("How2Matplotlib.com: Alpha Values in Action")
plt.legend()
plt.show()
Output:
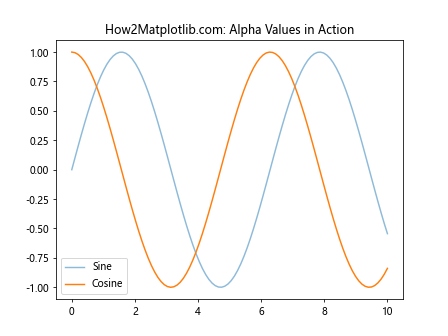
This example demonstrates how different alpha values affect the appearance of lines in a plot. We use Matplotlib.artist.Artist.get_alpha() in Python to retrieve and print the alpha values of both lines.
Exploring the Artist Hierarchy
To fully grasp the concept of Matplotlib.artist.Artist.get_alpha() in Python, it’s essential to understand the Artist hierarchy in Matplotlib. The Artist class is the base class for all visible elements in a figure, and it provides a set of methods and properties that are inherited by its subclasses.
Here’s an example that explores different types of Artists and their alpha values:
import matplotlib.pyplot as plt
import matplotlib.patches as patches

# Create a figure and axis
fig, ax = plt.subplots()

# Create various Artist objects
line = ax.plot([0, 1], [0, 1], alpha=0.8)[0]
circle = plt.Circle((0.5, 0.5), 0.2, alpha=0.6)
rectangle = patches.Rectangle((0.2, 0.2), 0.3, 0.3, alpha=0.4)
text = ax.text(0.5, 0.9, "How2Matplotlib.com", alpha=0.7)

# Add patches to the axis
ax.add_patch(circle)
ax.add_patch(rectangle)

# Get and print alpha values
print(f"Line alpha: {line.get_alpha()}")
print(f"Circle alpha: {circle.get_alpha()}")
print(f"Rectangle alpha: {rectangle.get_alpha()}")
print(f"Text alpha: {text.get_alpha()}")

plt.title("How2Matplotlib.com: Artist Hierarchy")
plt.show()
Output:
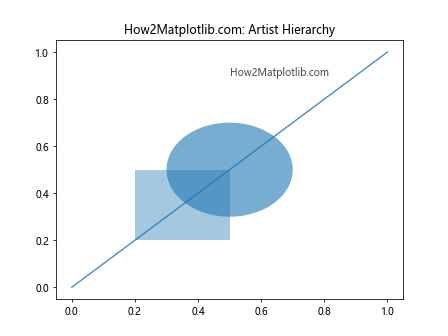
This example creates different types of Artist objects (Line2D, Circle, Rectangle, and Text) with various alpha values. We then use Matplotlib.artist.Artist.get_alpha() in Python to retrieve and print these values, demonstrating how the method works across different Artist subclasses.
Using get_alpha() with Composite Artists
Composite Artists are objects that contain other Artists. Examples include Axes, Figure, and Legend. When working with composite Artists, it’s important to understand how Matplotlib.artist.Artist.get_alpha() in Python behaves.
Let’s explore this with an example:
import matplotlib.pyplot as plt

# Create a figure and axis
fig, ax = plt.subplots()

# Plot some data
ax.plot([0, 1, 2], [0, 1, 0], label='Data')

# Create a legend
legend = ax.legend()

# Set alpha for the legend
legend.set_alpha(0.5)

# Get alpha values
print(f"Figure alpha: {fig.get_alpha()}")
print(f"Axes alpha: {ax.get_alpha()}")
print(f"Legend alpha: {legend.get_alpha()}")

plt.title("How2Matplotlib.com: Composite Artists")
plt.show()
Output:
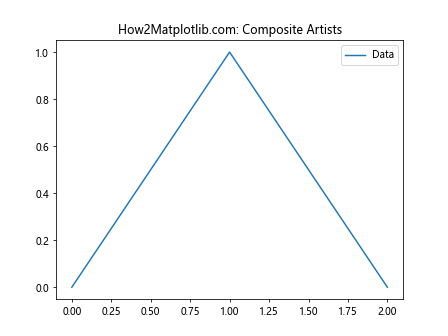
In this example, we create a figure with a plot and a legend. We set the alpha value for the legend and then use Matplotlib.artist.Artist.get_alpha() in Python to retrieve alpha values for the figure, axes, and legend. This demonstrates how get_alpha() works with composite Artists.
Handling None Values
It’s important to note that Matplotlib.artist.Artist.get_alpha() in Python may return None if no alpha value has been explicitly set. This behavior can be useful in certain scenarios, but it’s crucial to handle it properly in your code.
Here’s an example that demonstrates how to handle None values:
import matplotlib.pyplot as plt

# Create a figure and axis
fig, ax = plt.subplots()

# Create two lines, one with alpha set and one without
line1 = ax.plot([0, 1], [0, 1], alpha=0.5, label='With Alpha')[0]
line2 = ax.plot([0, 1], [1, 0], label='Without Alpha')[0]

# Get alpha values
alpha1 = line1.get_alpha()
alpha2 = line2.get_alpha()

# Print alpha values, handling None
print(f"Line 1 alpha: {alpha1 if alpha1 is not None else 'Not set'}")
print(f"Line 2 alpha: {alpha2 if alpha2 is not None else 'Not set'}")

plt.title("How2Matplotlib.com: Handling None Alpha Values")
plt.legend()
plt.show()
Output:
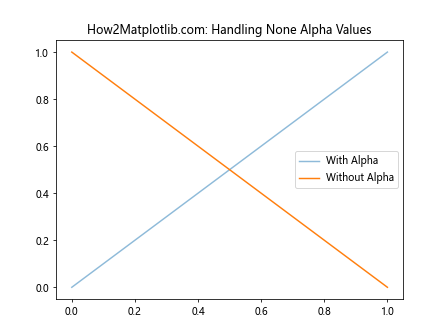
This example creates two lines, one with an explicit alpha value and one without. We then use Matplotlib.artist.Artist.get_alpha() in Python to retrieve the alpha values and demonstrate how to handle the case where None is returned.
Combining get_alpha() with set_alpha()
While Matplotlib.artist.Artist.get_alpha() in Python is useful for retrieving alpha values, it’s often used in conjunction with set_alpha() to dynamically adjust transparency. Let’s explore how these methods can work together:
import matplotlib.pyplot as plt
import numpy as np

# Create data
x = np.linspace(0, 10, 100)
y = np.sin(x)

# Create a figure and axis
fig, ax = plt.subplots()

# Plot the data
line = ax.plot(x, y)[0]

# Get the current alpha value
current_alpha = line.get_alpha()
print(f"Current alpha: {current_alpha if current_alpha is not None else 'Not set'}")

# Set a new alpha value
line.set_alpha(0.5)

# Get the new alpha value
new_alpha = line.get_alpha()
print(f"New alpha: {new_alpha}")

plt.title("How2Matplotlib.com: Combining get_alpha() and set_alpha()")
plt.show()
Output:
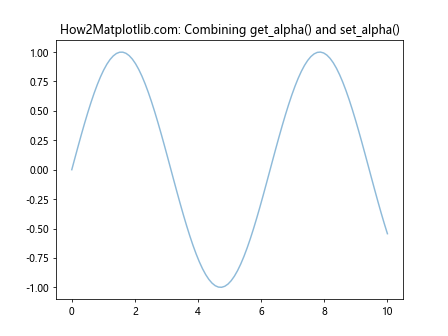
This example demonstrates how to use Matplotlib.artist.Artist.get_alpha() in Python to retrieve the current alpha value, set a new value using set_alpha(), and then confirm the change by calling get_alpha() again.
Working with Collections
Collections are groups of similar Artist objects in Matplotlib. When working with collections, Matplotlib.artist.Artist.get_alpha() in Python behaves slightly differently. Let’s explore this with an example:
import matplotlib.pyplot as plt
import numpy as np

# Create data
x = np.random.rand(50)
y = np.random.rand(50)
colors = np.random.rand(50)
sizes = 1000 * np.random.rand(50)

# Create a figure and axis
fig, ax = plt.subplots()

# Create a scatter plot (which returns a PathCollection)
scatter = ax.scatter(x, y, c=colors, s=sizes, alpha=0.6)

# Get the alpha value of the collection
collection_alpha = scatter.get_alpha()
print(f"Collection alpha: {collection_alpha}")

# Get alpha values of individual elements (returns an array)
element_alphas = scatter.get_alpha()
print(f"Element alphas: {element_alphas}")

plt.title("How2Matplotlib.com: Working with Collections")
plt.show()
Output:
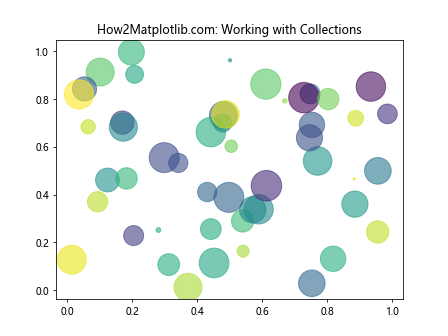
In this example, we create a scatter plot, which returns a PathCollection. We then use Matplotlib.artist.Artist.get_alpha() in Python to retrieve the alpha value of the entire collection and demonstrate how it differs from getting alpha values of individual elements.
Alpha in Colormaps and Color Cycles
When working with colormaps and color cycles in Matplotlib, alpha values can play an important role. Let’s explore how Matplotlib.artist.Artist.get_alpha() in Python interacts with these features:
import matplotlib.pyplot as plt
import numpy as np

# Create data
x = np.linspace(0, 10, 100)
y1 = np.sin(x)
y2 = np.cos(x)
y3 = np.tan(x)

# Create a figure and axis
fig, ax = plt.subplots()

# Plot lines with a colormap
lines = ax.plot(x, y1, x, y2, x, y3, alpha=0.7)

# Set a colormap
plt.set_cmap('viridis')

# Get alpha values
for i, line in enumerate(lines):
    alpha = line.get_alpha()
    print(f"Line {i+1} alpha: {alpha}")

plt.title("How2Matplotlib.com: Alpha in Colormaps")
plt.show()
Output:
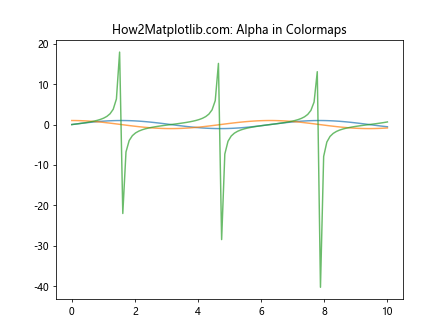
This example demonstrates how to use Matplotlib.artist.Artist.get_alpha() in Python when working with multiple lines and colormaps. We set a global alpha value for all lines and then retrieve individual alpha values to show how they interact with the colormap.
Alpha in 3D Plots
Matplotlib.artist.Artist.get_alpha() in Python can also be used with 3D plots. Let’s explore this with an example:
import matplotlib.pyplot as plt
import numpy as np
from mpl_toolkits.mplot3d import Axes3D

# Create data
x = np.linspace(-5, 5, 100)
y = np.linspace(-5, 5, 100)
X, Y = np.meshgrid(x, y)
Z = np.sin(np.sqrt(X**2 + Y**2))

# Create a 3D figure
fig = plt.figure()
ax = fig.add_subplot(111, projection='3d')

# Create a surface plot
surf = ax.plot_surface(X, Y, Z, cmap='viridis', alpha=0.8)

# Get the alpha value of the surface
surface_alpha = surf.get_alpha()
print(f"Surface alpha: {surface_alpha}")

plt.title("How2Matplotlib.com: Alpha in 3D Plots")
plt.show()
Output:
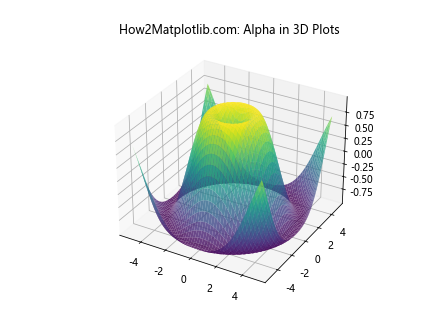
This example creates a 3D surface plot and demonstrates how to use Matplotlib.artist.Artist.get_alpha() in Python to retrieve the alpha value of the surface.
Alpha in Animations
When creating animations with Matplotlib, Matplotlib.artist.Artist.get_alpha() in Python can be useful for dynamically changing transparency. Here’s an example:
import matplotlib.pyplot as plt
import matplotlib.animation as animation
import numpy as np

# Create data
x = np.linspace(0, 2*np.pi, 100)
y = np.sin(x)

# Create a figure and axis
fig, ax = plt.subplots()
line, = ax.plot(x, y)

# Animation function
def animate(frame):
    alpha = (frame % 100) / 100  # Cycle alpha from 0 to 1
    line.set_alpha(alpha)
    return line,

# Create animation
anim = animation.FuncAnimation(fig, animate, frames=200, interval=50, blit=True)

# Function to print current alpha
def print_alpha(event):
    current_alpha = line.get_alpha()
    print(f"Current alpha: {current_alpha}")

# Connect the function to a timer
timer = fig.canvas.new_timer(interval=1000)  # Print every second
timer.add_callback(print_alpha)
timer.start()

plt.title("How2Matplotlib.com: Alpha in Animations")
plt.show()
Output:
This example creates an animation where the alpha value of a line changes over time. We use Matplotlib.artist.Artist.get_alpha() in Python to periodically print the current alpha value, demonstrating how it can be used in dynamic visualizations.
Handling Alpha in Custom Artists
When creating custom Artist subclasses, it’s important to properly implement alpha handling. Here’s an example of a custom Artist that uses Matplotlib.artist.Artist.get_alpha() in Python:
import matplotlib.pyplot as plt
from matplotlib.artist import Artist
from matplotlib.patches import Circle

class AlphaCircle(Artist):
    def __init__(self, xy, radius, **kwargs):
        super().__init__()
        self.circle = Circle(xy, radius, **kwargs)

    def draw(self, renderer):
        self.circle.draw(renderer)

    def get_alpha(self):
        return self.circle.get_alpha()

    def set_alpha(self, alpha):
        self.circle.set_alpha(alpha)

# Create a figure and axis
fig, ax = plt.subplots()

# Create and add the custom artist
alpha_circle = AlphaCircle((0.5, 0.5), 0.2, alpha=0.7)
ax.add_artist(alpha_circle)

# Get and print the alpha value
print(f"Alpha Circle alpha: {alpha_circle.get_alpha()}")

plt.title("How2Matplotlib.com: Custom Artist with Alpha")
plt.show()
Output:
This example demonstrates how to create a custom Artist subclass that properly implements alpha handling, including the use of Matplotlib.artist.Artist.get_alpha() in Python.
Alpha in Layered Visualizations
When creating layered visualizations, understanding how to use Matplotlib.artist.Artist.get_alpha() in Python becomes crucial. Let’s explore this with an example:
import matplotlib.pyplot as plt
import numpy as np

# Create data
x = np.linspace(0, 10, 100)
y1 = np.sin(x)
y2 = np.cos(x)
y3 = np.tan(x)

# Create a figure and axis
fig, ax = plt.subplots()

# Create layered plot
line1 = ax.plot(x, y1, color='red', alpha=0.3, label='Layer 1')[0]
line2 = ax.plot(x, y2, color='green', alpha=0.5, label='Layer 2')[0]
line3 = ax.plot(x, y3, color='blue', alpha=0.7, label='Layer 3')[0]

# Get and print alpha values
print(f"Layer 1 alpha: {line1.get_alpha()}")
print(f"Layer 2 alpha: {line2.get_alpha()}")
print(f"Layer 3 alpha: {line3.get_alpha()}")

plt.title("How2Matplotlib.com: Layered Visualization")
plt.legend()
plt.show()
Output:
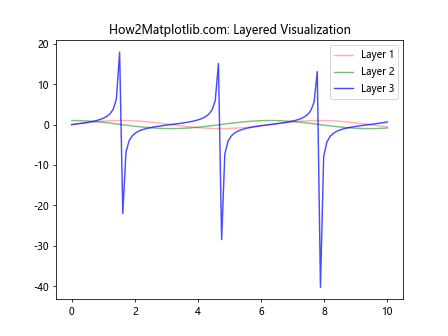
This example creates a layered visualization with three lines, each with a different alpha value. We use Matplotlib.artist.Artist.get_alpha() in Python to retrieve and print these values, demonstrating how alpha can be used to create depth in visualizations.
Alpha in Filled Areas
Matplotlib.artist.Artist.get_alpha() in Python can also be used with filled areas. Let’s explore this with an example:
import matplotlib.pyplot as plt
import numpy as np

# Create data
x = np.linspace(0, 10, 100)
y1 = np.sin(x)
y2 = np.cos(x)

# Create a figure and axis
fig, ax = plt.subplots()

# Create filled areas
area1 = ax.fill_between(x, 0, y1, alpha=0.3, label='Area 1')
area2 = ax.fill_between(x, 0, y2, alpha=0.5, label='Area 2')

# Get and print alpha values
print(f"Area 1 alpha: {area1.get_alpha()}")
print(f"Area 2 alpha: {area2.get_alpha()}")

plt.title("How2Matplotlib.com: Alpha in Filled Areas")
plt.legend()
plt.show()
Output:
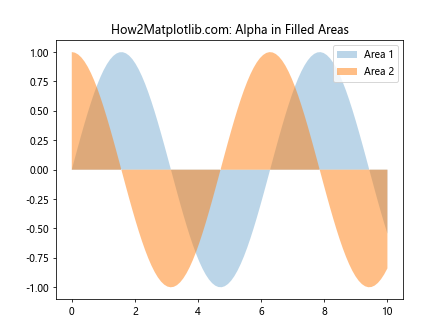
This example demonstrates how to use Matplotlib.artist.Artist.get_alpha() in Python with filled areas. We create two filled areas with different alpha values and then retrieve and print these values.
Alpha in Contour Plots
Contour plots can also benefit from alpha transparency. Let’s see how Matplotlib.artist.Artist.get_alpha() in Python works with contour plots:
import matplotlib.pyplot as plt
import numpy as np

# Create data
x = np.linspace(-3, 3, 100)
y = np.linspace(-3, 3, 100)
X, Y = np.meshgrid(x, y)
Z = np.exp(-(X**2 + Y**2))

# Create a figure and axis
fig, ax = plt.subplots()

# Create contour plot
contour = ax.contourf(X, Y, Z, levels=10, alpha=0.7, cmap='viridis')

# Get and print alpha value
print(f"Contour alpha: {contour.get_alpha()}")

plt.title("How2Matplotlib.com: Alpha in Contour Plots")
plt.colorbar(contour)
plt.show()
Output:
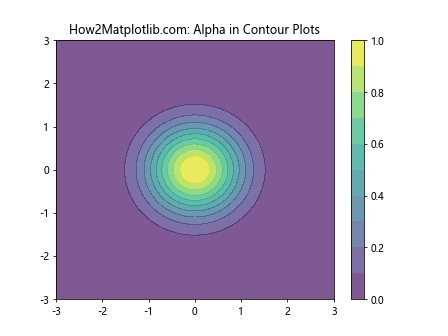
This example creates a contour plot with a specified alpha value. We then use Matplotlib.artist.Artist.get_alpha() in Python to retrieve and print this value, demonstrating how alpha works in contour plots.
Alpha in Polar Plots
Matplotlib.artist.Artist.get_alpha() in Python can also be used with polar plots. Let’s explore this with an example:
import matplotlib.pyplot as plt
import numpy as np

# Create data
r = np.linspace(0, 2, 100)
theta = 2 * np.pi * r

# Create a figure and polar axis
fig, ax = plt.subplots(subplot_kw=dict(projection='polar'))

# Create polar plot
line = ax.plot(theta, r, alpha=0.6)[0]

# Get and print alpha value
print(f"Polar line alpha: {line.get_alpha()}")

plt.title("How2Matplotlib.com: Alpha in Polar Plots")
plt.show()
Output:
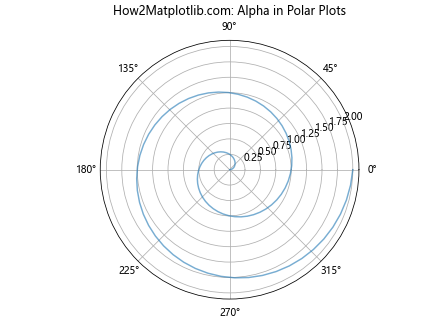
This example demonstrates how to use Matplotlib.artist.Artist.get_alpha() in Python with polar plots. We create a polar plot with a specified alpha value and then retrieve and print this value.
Conclusion
In this comprehensive guide, we’ve explored the many facets of Matplotlib.artist.Artist.get_alpha() in Python. From basic usage to advanced applications in various types of plots and visualizations, we’ve seen how this method plays a crucial role in managing transparency in Matplotlib.
Understanding how to use Matplotlib.artist.Artist.get_alpha() in Python effectively can greatly enhance your data visualization capabilities. It allows you to create more nuanced and visually appealing plots by controlling the transparency of different elements.
Remember that Matplotlib.artist.Artist.get_alpha() in Python is just one part of the broader alpha-related functionality in Matplotlib. It works hand in hand with set_alpha() and other methods to provide fine-grained control over the appearance of your plots.