How to Change the Figure Size with Subplots in Matplotlib
How to Change the Figure Size with Subplots in Matplotlib is an essential skill for data visualization enthusiasts and professionals alike. Matplotlib, a powerful plotting library for Python, offers extensive customization options for creating visually appealing and informative plots. One of the fundamental aspects of plot customization is adjusting the figure size, especially when working with subplots. In this comprehensive guide, we’ll explore various techniques and best practices for changing the figure size with subplots in Matplotlib, providing you with the knowledge and tools to create stunning visualizations.
Understanding Figure Size and Subplots in Matplotlib
Before diving into the specifics of how to change the figure size with subplots in Matplotlib, it’s crucial to understand the concepts of figure size and subplots. In Matplotlib, a figure is the top-level container that holds all the plot elements. The figure size determines the overall dimensions of the plot, including its width and height. Subplots, on the other hand, are individual plotting areas within a figure, allowing you to create multiple plots in a single figure.
When working with subplots, knowing how to change the figure size becomes even more important, as it affects the layout and appearance of all the subplots within the figure. By mastering the techniques to adjust figure size with subplots, you can create visually appealing and well-organized plots that effectively communicate your data.
Let’s start with a basic example of how to change the figure size with subplots in Matplotlib:
import matplotlib.pyplot as plt
import numpy as np

# Create a figure with subplots and specify the figure size
fig, (ax1, ax2) = plt.subplots(1, 2, figsize=(12, 6))

# Generate sample data
x = np.linspace(0, 10, 100)
y1 = np.sin(x)
y2 = np.cos(x)

# Plot data on subplots
ax1.plot(x, y1, label='Sine')
ax1.set_title('Sine Wave - how2matplotlib.com')
ax1.legend()

ax2.plot(x, y2, label='Cosine')
ax2.set_title('Cosine Wave - how2matplotlib.com')
ax2.legend()

# Adjust layout and display the plot
plt.tight_layout()
plt.show()
Output:
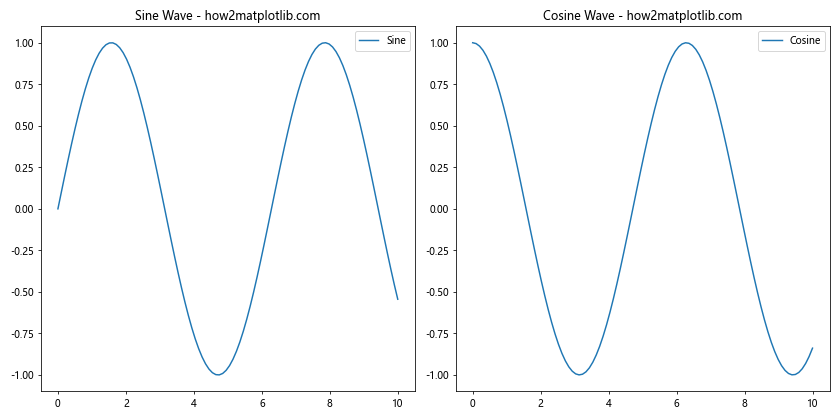
In this example, we create a figure with two subplots side by side and set the figure size to 12 inches wide and 6 inches tall using the figsize parameter. The figsize parameter takes a tuple of (width, height) in inches. By adjusting these values, you can change the overall size of the figure containing the subplots.
Changing Figure Size for Different Subplot Layouts
When working with different subplot layouts, you may need to adjust the figure size accordingly to ensure that all subplots are visible and properly sized. Let’s explore how to change the figure size with subplots in Matplotlib for various layouts.
2×2 Subplot Layout
Here’s an example of how to change the figure size with a 2×2 subplot layout:
import matplotlib.pyplot as plt
import numpy as np
# Create a figure with a 2x2 subplot layout and specify the figure size
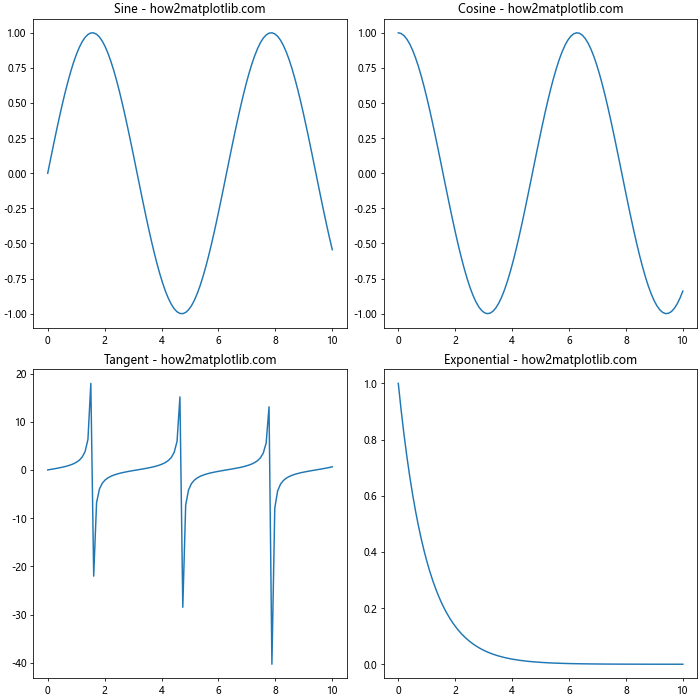
fig, ((ax1, ax2), (ax3, ax4)) = plt.subplots(2, 2, figsize=(10, 10))
# Generate sample data
x = np.linspace(0, 10, 100)
y1 = np.sin(x)
y2 = np.cos(x)
y3 = np.tan(x)
y4 = np.exp(x)
# Plot data on subplots
ax1.plot(x, y1)
ax1.set_title('Sine - how2matplotlib.com')
ax2.plot(x, y2)
ax2.set_title('Cosine - how2matplotlib.com')
ax3.plot(x, y3)
ax3.set_title('Tangent - how2matplotlib.com')
ax4.plot(x, y4)
ax4.set_title('Exponential - how2matplotlib.com')
# Adjust layout and display the plot
plt.tight_layout()
plt.show()
Output:
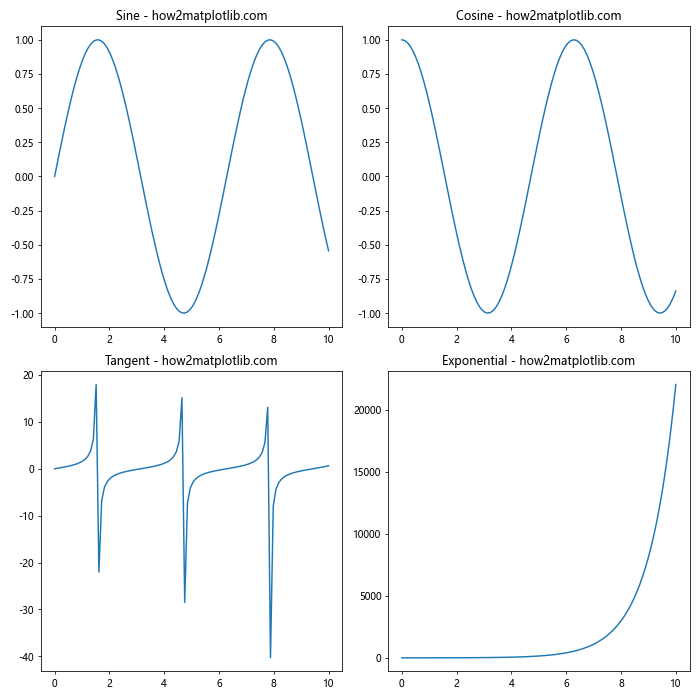
In this example, we create a 2×2 subplot layout and set the figure size to 10×10 inches. This square figure size works well for a balanced 2×2 layout, ensuring that each subplot has enough space to display its content clearly.
3×1 Subplot Layout
Now, let’s see how to change the figure size with a 3×1 subplot layout:
import matplotlib.pyplot as plt
import numpy as np
# Create a figure with a 3x1 subplot layout and specify the figure size
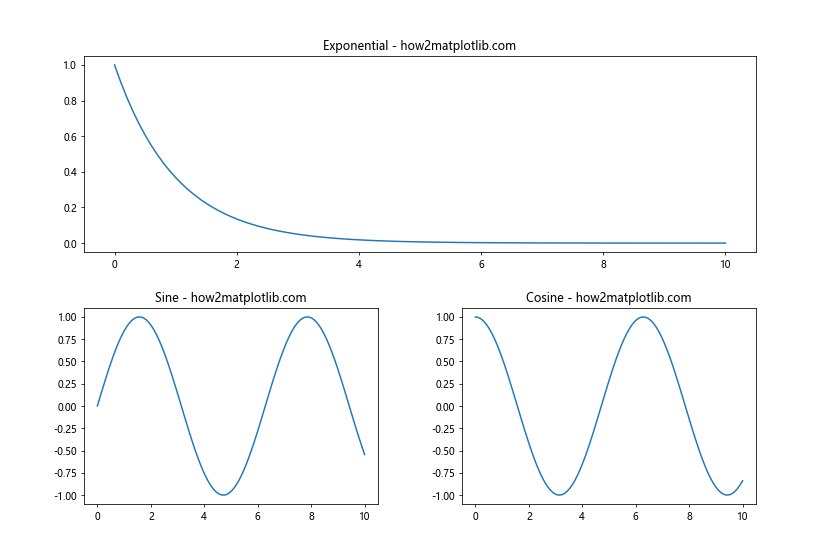
fig, (ax1, ax2, ax3) = plt.subplots(3, 1, figsize=(8, 12))
# Generate sample data
x = np.linspace(0, 10, 100)
y1 = np.sin(x)
y2 = np.cos(x)
y3 = np.tan(x)
# Plot data on subplots
ax1.plot(x, y1)
ax1.set_title('Sine - how2matplotlib.com')
ax2.plot(x, y2)
ax2.set_title('Cosine - how2matplotlib.com')
ax3.plot(x, y3)
ax3.set_title('Tangent - how2matplotlib.com')
# Adjust layout and display the plot
plt.tight_layout()
plt.show()
Output:
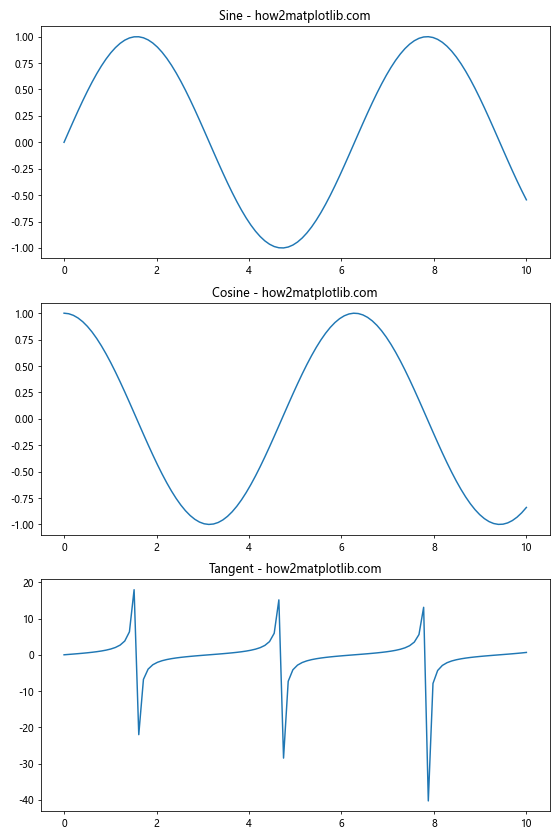
For a 3×1 subplot layout, we set the figure size to 8 inches wide and 12 inches tall. This vertical orientation allows each subplot to have sufficient height while maintaining a reasonable overall figure size.
Adjusting Figure Size Dynamically
Sometimes, you may need to change the figure size dynamically based on the number of subplots or other factors. Here’s an example of how to change the figure size with subplots in Matplotlib dynamically:
import matplotlib.pyplot as plt
import numpy as np

def create_subplots(num_plots):
    # Calculate the number of rows and columns for the subplots
    num_rows = int(np.ceil(np.sqrt(num_plots)))
    num_cols = int(np.ceil(num_plots / num_rows))

    # Calculate the figure size based on the number of subplots
    fig_width = 4 * num_cols
    fig_height = 3 * num_rows

    # Create the figure and subplots
    fig, axes = plt.subplots(num_rows, num_cols, figsize=(fig_width, fig_height))

    # Generate sample data and plot on subplots
    x = np.linspace(0, 10, 100)
    for i, ax in enumerate(axes.flat):
        if i < num_plots:
            y = np.sin(x + i)
            ax.plot(x, y)
            ax.set_title(f'Plot {i+1} - how2matplotlib.com')
        else:
            ax.axis('off')

    # Adjust layout and display the plot
    plt.tight_layout()
    plt.show()

# Example usage
create_subplots(5)
In this example, we define a function create_subplots that takes the number of desired subplots as an argument. The function calculates the appropriate number of rows and columns for the subplot layout and adjusts the figure size accordingly. This approach allows you to change the figure size dynamically based on the number of subplots you need.
Fine-tuning Subplot Sizes within a Figure
While changing the overall figure size is important, you may also want to fine-tune the sizes of individual subplots within the figure. Matplotlib provides several ways to achieve this. Let's explore some techniques for how to change the figure size with subplots in Matplotlib while adjusting individual subplot sizes.
Using GridSpec
GridSpec is a powerful tool in Matplotlib that allows you to create complex subplot layouts with fine-grained control over subplot sizes. Here's an example of how to use GridSpec to change the figure size and adjust subplot sizes:
import matplotlib.pyplot as plt
import matplotlib.gridspec as gridspec
import numpy as np

# Create a figure and GridSpec
fig = plt.figure(figsize=(12, 8))
gs = gridspec.GridSpec(2, 3, width_ratios=[1, 2, 1], height_ratios=[1, 1.5])

# Generate sample data
x = np.linspace(0, 10, 100)
y1 = np.sin(x)
y2 = np.cos(x)
y3 = np.tan(x)

# Create subplots with different sizes
ax1 = fig.add_subplot(gs[0, 0])
ax1.plot(x, y1)
ax1.set_title('Sine - how2matplotlib.com')

ax2 = fig.add_subplot(gs[0, 1:])
ax2.plot(x, y2)
ax2.set_title('Cosine - how2matplotlib.com')

ax3 = fig.add_subplot(gs[1, :])
ax3.plot(x, y3)
ax3.set_title('Tangent - how2matplotlib.com')

# Adjust layout and display the plot
plt.tight_layout()
plt.show()
Output:
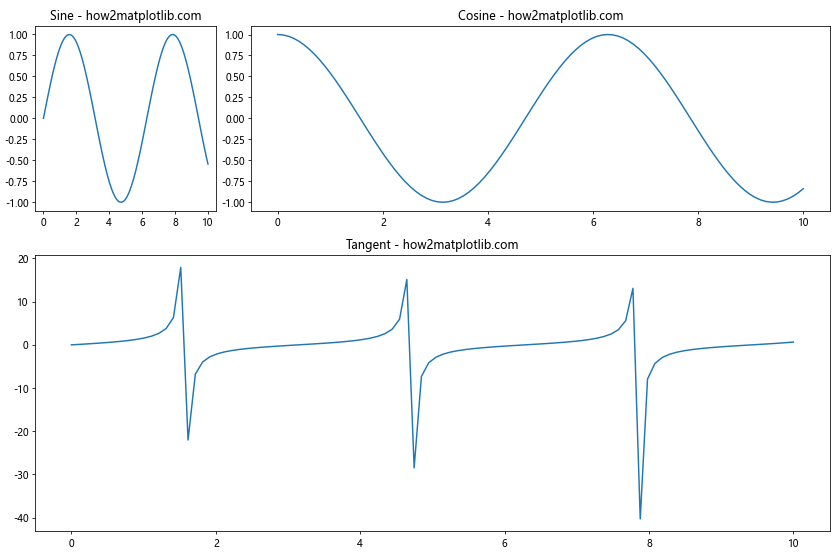
In this example, we use GridSpec to create a 2x3 grid with custom width and height ratios. We then add subplots to specific grid cells, allowing us to create subplots of different sizes within the same figure.
Adjusting Subplot Positions
Another way to fine-tune subplot sizes is by adjusting their positions within the figure. Here's an example of how to change the figure size with subplots in Matplotlib while manually adjusting subplot positions:
import matplotlib.pyplot as plt
import numpy as np

# Create a figure with a custom size
fig = plt.figure(figsize=(12, 8))

# Generate sample data
x = np.linspace(0, 10, 100)
y1 = np.sin(x)
y2 = np.cos(x)
y3 = np.exp(-x)

# Create subplots with custom positions
ax1 = fig.add_axes([0.1, 0.1, 0.35, 0.35])
ax1.plot(x, y1)
ax1.set_title('Sine - how2matplotlib.com')

ax2 = fig.add_axes([0.55, 0.1, 0.35, 0.35])
ax2.plot(x, y2)
ax2.set_title('Cosine - how2matplotlib.com')

ax3 = fig.add_axes([0.1, 0.55, 0.8, 0.35])
ax3.plot(x, y3)
ax3.set_title('Exponential - how2matplotlib.com')

# Display the plot
plt.show()
Output:
In this example, we use the fig.add_axes() method to create subplots with custom positions and sizes. The arguments for add_axes() are [left, bottom, width, height], where all values are fractions of the figure dimensions.
Handling Aspect Ratios
When changing the figure size with subplots in Matplotlib, it's important to consider the aspect ratios of your plots, especially when dealing with images or plots that require specific proportions. Let's explore how to handle aspect ratios while adjusting figure sizes.
Preserving Aspect Ratios for Image Plots
Here's an example of how to change the figure size with subplots in Matplotlib while preserving the aspect ratio of image plots:
import matplotlib.pyplot as plt
import numpy as np

# Create a figure with subplots
fig, (ax1, ax2) = plt.subplots(1, 2, figsize=(12, 6))

# Generate sample image data
image1 = np.random.rand(100, 100)
image2 = np.random.rand(100, 200)

# Plot images while preserving aspect ratios
im1 = ax1.imshow(image1, aspect='equal')
ax1.set_title('Square Image - how2matplotlib.com')

im2 = ax2.imshow(image2, aspect='equal')
ax2.set_title('Rectangular Image - how2matplotlib.com')

# Add colorbars
fig.colorbar(im1, ax=ax1)
fig.colorbar(im2, ax=ax2)

# Adjust layout and display the plot
plt.tight_layout()
plt.show()
Output:
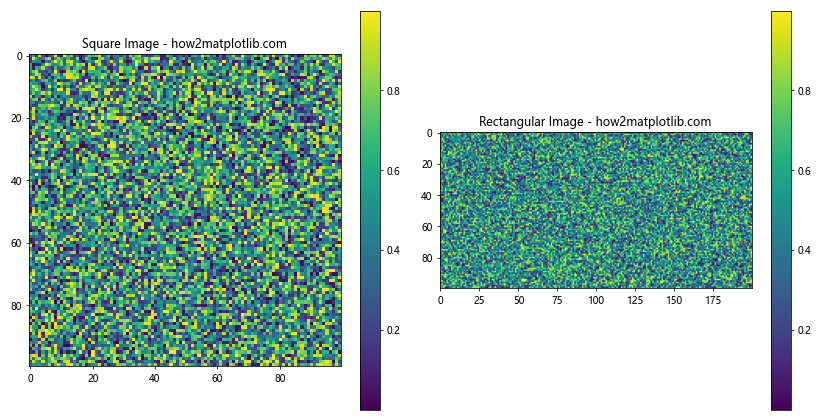
In this example, we use the aspect='equal' parameter in the imshow() function to preserve the aspect ratio of the images. This ensures that the images are displayed with the correct proportions, regardless of the figure size.
Adjusting Aspect Ratios for Data Plots
For data plots, you may want to control the aspect ratio to emphasize certain features of your data. Here's an example of how to change the figure size with subplots in Matplotlib while adjusting aspect ratios for data plots:
import matplotlib.pyplot as plt
import numpy as np

# Create a figure with subplots
fig, (ax1, ax2) = plt.subplots(1, 2, figsize=(12, 6))

# Generate sample data
x = np.linspace(0, 10, 100)
y = np.sin(x)

# Plot data with different aspect ratios
ax1.plot(x, y)
ax1.set_title('Default Aspect Ratio - how2matplotlib.com')
ax1.set_aspect('auto')

ax2.plot(x, y)
ax2.set_title('Adjusted Aspect Ratio - how2matplotlib.com')
ax2.set_aspect(0.5)

# Adjust layout and display the plot
plt.tight_layout()
plt.show()
Output:
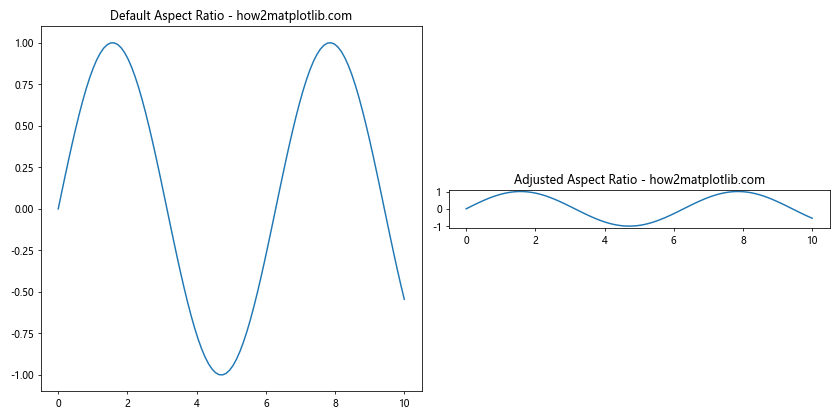
In this example, we use the set_aspect() method to control the aspect ratio of the plots. The 'auto' value (default) allows Matplotlib to determine the aspect ratio automatically, while numeric values adjust the aspect ratio relative to the data units.
Advanced Techniques for Changing Figure Size with Subplots
As you become more proficient with Matplotlib, you may want to explore advanced techniques for changing figure size with subplots. Let's look at some more sophisticated approaches to fine-tune your plot layouts.
Using Constrained Layout
Constrained Layout is a newer automatic layout adjustment feature in Matplotlib that can help optimize the use of figure space. Here's an example of how to change the figure size with subplots in Matplotlib using Constrained Layout:
import matplotlib.pyplot as plt
import numpy as np

# Create a figure with subplots using Constrained Layout
fig, axs = plt.subplots(2, 2, figsize=(10, 10), constrained_layout=True)

# Generate sample data
x = np.linspace(0, 10, 100)
y1 = np.sin(x)
y2 = np.cos(x)
y3 = np.tan(x)
y4 = np.exp(-x)

# Plot data on subplots
axs[0, 0].plot(x, y1)
axs[0, 0].set_title('Sine - how2matplotlib.com')

axs[0, 1].plot(x, y2)
axs[0, 1].set_title('Cosine - how2matplotlib.com')

axs[1, 0].plot(x, y3)
axs[1, 0].set_title('Tangent - how2matplotlib.com')

axs[1, 1].plot(x, y4)
axs[1, 1].set_title('Exponential - how2matplotlib.com')

# Display the plot
plt.show()
Output:
Constrained Layout automatically adjusts the spacing between subplots and figure elements to make optimal use of the available space.
Creating Nested Subplots
For complex visualizations, you might need to create nested subplots within your figure. Here's an example of how to change the figure size with nested subplots in Matplotlib:
import matplotlib.pyplot as plt
import numpy as np

# Create a figure with nested subplots
fig = plt.figure(figsize=(12, 8))

# Create the main subplot areas
gs = fig.add_gridspec(2, 2)

# Generate sample data
x = np.linspace(0, 10, 100)
y1 = np.sin(x)
y2 = np.cos(x)
y3 = np.tan(x)

# Create nested subplots
ax1 = fig.add_subplot(gs[0, 0])
ax1.plot(x, y1)
ax1.set_title('Sine - how2matplotlib.com')

ax2 = fig.add_subplot(gs[0, 1])
ax2.plot(x, y2)
ax2.set_title('Cosine - how2matplotlib.com')

# Create nested subplots within a grid cell
gs_nested = gs[1, :].subgridspec(1, 2)
ax3 = fig.add_subplot(gs_nested[0, 0])
ax3.plot(x, y3)
ax3.set_title('Tangent - how2matplotlib.com')

ax4 = fig.add_subplot(gs_nested[0, 1])
ax4.plot(x, np.sin(x) * np.cos(x))
ax4.set_title('Sin*Cos - how2matplotlib.com')

# Adjust layout and display the plot
plt.tight_layout()
plt.show()
Output:
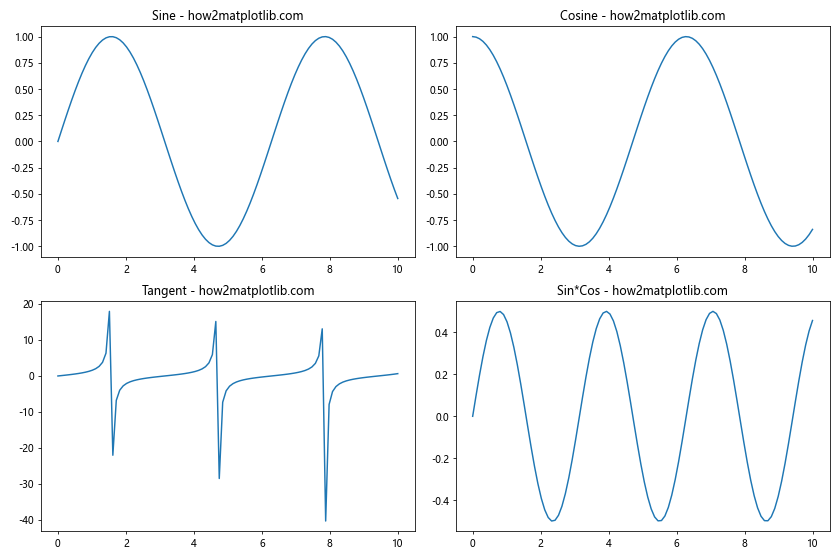
This example demonstrates how to create nested subplots within a larger grid, allowing for complex and flexible layouts.
Best Practices for Changing Figure Size with Subplots
As we conclude our comprehensive guide on how to change the figure size with subplots in Matplotlib, let's review some best practices to ensure your plots are both visually appealing and effective in communicating your data.
- Consider the content: When deciding on figure and subplot sizes, consider the complexity and amount of data you're presenting. More complex plots may require larger sizes to ensure readability.
Maintain consistency: If you're creating multiple figures for a report or presentation, try to maintain consistent figure sizes and layouts for a professional appearance.
Use relative units: When possible, use relative units (e.g., fractions of the figure size) rather than absolute pixel values to ensure your plots scale well across different devices and output formats.
Leverage Matplotlib's layout engines: Take advantage of Matplotlib's layout engines like
tight_layout()and Constrained Layout to automatically optimize the use of figure space.Test on different devices: If your plots will be viewed on various devices, test them on different screen sizes and resolutions to ensure they remain legible and visually appealing.
Balance aesthetics and information: While it's important to create visually appealing plots, always prioritize the clarity and accuracy of the information you're presenting.
Document your approach: When working on complex projects, document your figure size and subplot layout choices to maintain consistency and make future adjustments easier.
By following these best practices and utilizing the techniques we've covered in this guide, you'll be well-equipped to create professional-quality plots with optimal figure sizes and subplot layouts using Matplotlib. In conclusion, mastering how to change the figure size with subplots in Matplotlib is a crucial skill for creating effective data visualizations. From basic adjustments to advanced techniques, the flexibility and power of Matplotlib allow you to create plots that are not only visually appealing but also effectively communicate your data across various mediums and devices. As you continue to work with Matplotlib, experiment with different approaches and layouts to find the best solutions for your specific visualization needs.