How to Draw Shapes in Matplotlib with Python
How to Draw Shapes in Matplotlib with Python is an essential skill for data visualization and creating custom graphics. Matplotlib is a powerful Python library that allows you to create a wide variety of plots and charts, including the ability to draw various shapes. In this comprehensive guide, we’ll explore the different methods and techniques for drawing shapes in Matplotlib, providing detailed explanations and examples along the way.
Understanding the Basics of Drawing Shapes in Matplotlib
Before we dive into the specifics of how to draw shapes in Matplotlib with Python, it’s important to understand the basic concepts and components involved. Matplotlib provides a flexible framework for creating plots and graphics, and drawing shapes is just one aspect of its capabilities.
To get started with drawing shapes in Matplotlib, you’ll need to import the library and create a figure and axes object. Here’s a simple example to illustrate this:
import matplotlib.pyplot as plt

fig, ax = plt.subplots()
ax.set_xlim(0, 10)
ax.set_ylim(0, 10)
ax.set_title("How to Draw Shapes in Matplotlib - how2matplotlib.com")
plt.show()
Output:
This code creates a blank canvas with x and y limits set from 0 to 10. We’ll use this basic setup for most of our shape-drawing examples.
Drawing Basic Shapes: Rectangles and Squares
One of the most fundamental shapes you can draw in Matplotlib is a rectangle. Rectangles are versatile and can be used to create various visual elements in your plots. Let’s explore how to draw rectangles and squares using Matplotlib.
Drawing a Simple Rectangle
To draw a rectangle, we can use the Rectangle patch from Matplotlib. Here’s an example of how to draw a basic rectangle:
import matplotlib.pyplot as plt
from matplotlib.patches import Rectangle

fig, ax = plt.subplots()
ax.set_xlim(0, 10)
ax.set_ylim(0, 10)

rect = Rectangle((2, 2), 4, 3, facecolor='lightblue', edgecolor='blue')
ax.add_patch(rect)

ax.set_title("How to Draw a Rectangle in Matplotlib - how2matplotlib.com")
plt.show()
Output:
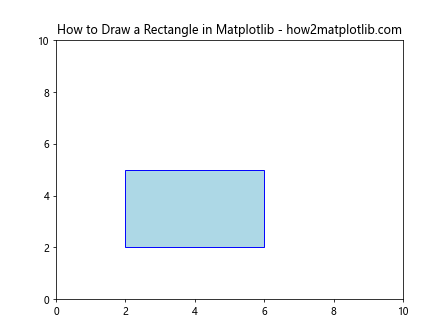
In this example, we create a Rectangle object with the following parameters:
(2, 2): The lower-left corner coordinates of the rectangle4: The width of the rectangle3: The height of the rectanglefacecolor='lightblue': The fill color of the rectangleedgecolor='blue': The color of the rectangle’s border
We then add the rectangle to the axes using ax.add_patch().
Drawing a Square
Drawing a square is similar to drawing a rectangle, but with equal width and height. Here’s how you can draw a square:
import matplotlib.pyplot as plt
from matplotlib.patches import Rectangle

fig, ax = plt.subplots()
ax.set_xlim(0, 10)
ax.set_ylim(0, 10)

square = Rectangle((3, 3), 4, 4, facecolor='lightgreen', edgecolor='green')
ax.add_patch(square)

ax.set_title("How to Draw a Square in Matplotlib - how2matplotlib.com")
plt.show()
Output:
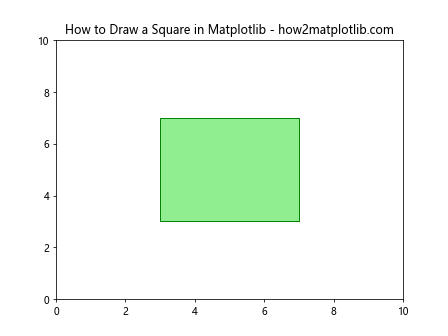
In this example, we create a square by setting both the width and height to 4.
Drawing Circles and Ellipses
Circles and ellipses are another set of common shapes that you might want to draw in Matplotlib. These shapes can be useful for highlighting specific areas of a plot or creating custom visualizations.
Drawing a Circle
To draw a circle in Matplotlib, we use the Circle patch. Here’s an example:
import matplotlib.pyplot as plt
from matplotlib.patches import Circle

fig, ax = plt.subplots()
ax.set_xlim(0, 10)
ax.set_ylim(0, 10)

circle = Circle((5, 5), radius=2, facecolor='lightyellow', edgecolor='orange')
ax.add_patch(circle)

ax.set_title("How to Draw a Circle in Matplotlib - how2matplotlib.com")
plt.show()
Output:
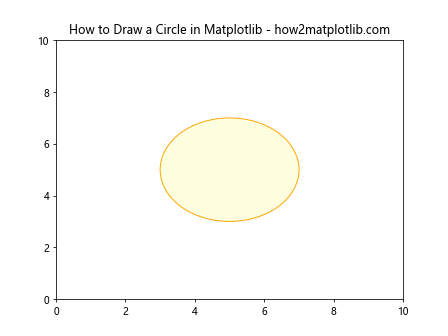
In this example, we create a Circle object with the following parameters:
(5, 5): The center coordinates of the circleradius=2: The radius of the circlefacecolor='lightyellow': The fill color of the circleedgecolor='orange': The color of the circle’s border
Drawing an Ellipse
Drawing an ellipse is similar to drawing a circle, but we use the Ellipse patch instead. Here’s how you can draw an ellipse:
import matplotlib.pyplot as plt
from matplotlib.patches import Ellipse

fig, ax = plt.subplots()
ax.set_xlim(0, 10)
ax.set_ylim(0, 10)

ellipse = Ellipse((5, 5), width=4, height=2, angle=30, facecolor='lightpink', edgecolor='red')
ax.add_patch(ellipse)

ax.set_title("How to Draw an Ellipse in Matplotlib - how2matplotlib.com")
plt.show()
Output:
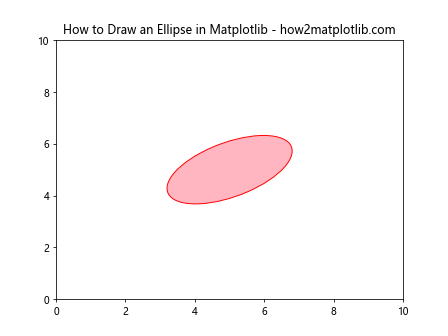
In this example, we create an Ellipse object with the following parameters:
(5, 5): The center coordinates of the ellipsewidth=4: The width of the ellipseheight=2: The height of the ellipseangle=30: The rotation angle of the ellipse in degreesfacecolor='lightpink': The fill color of the ellipseedgecolor='red': The color of the ellipse’s border
Drawing Polygons and Custom Shapes
Matplotlib also allows you to draw more complex shapes, such as polygons and custom shapes. These can be useful for creating unique visualizations or highlighting specific regions in your plots.
Drawing a Triangle
A triangle is a simple polygon that you can draw using the Polygon patch. Here’s an example:
import matplotlib.pyplot as plt
from matplotlib.patches import Polygon

fig, ax = plt.subplots()
ax.set_xlim(0, 10)
ax.set_ylim(0, 10)

triangle = Polygon([(2, 2), (8, 2), (5, 8)], facecolor='lightcoral', edgecolor='red')
ax.add_patch(triangle)

ax.set_title("How to Draw a Triangle in Matplotlib - how2matplotlib.com")
plt.show()
Output:
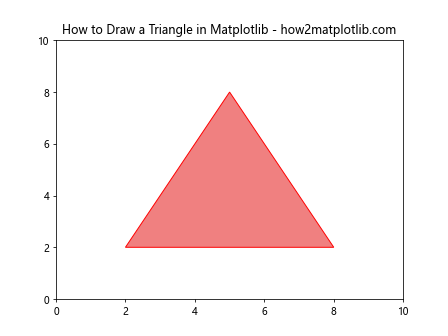
In this example, we create a Polygon object with a list of three vertex coordinates to form a triangle.
Drawing a Custom Polygon
You can create more complex polygons by specifying more vertices. Here’s an example of drawing a pentagon:
import matplotlib.pyplot as plt
from matplotlib.patches import Polygon
import numpy as np

fig, ax = plt.subplots()
ax.set_xlim(0, 10)
ax.set_ylim(0, 10)

# Generate pentagon vertices
n_sides = 5
radius = 3
center = (5, 5)
angles = np.linspace(0, 2*np.pi, n_sides, endpoint=False)
vertices = [(center[0] + radius*np.cos(angle), center[1] + radius*np.sin(angle)) for angle in angles]

pentagon = Polygon(vertices, facecolor='lightblue', edgecolor='blue')
ax.add_patch(pentagon)

ax.set_title("How to Draw a Pentagon in Matplotlib - how2matplotlib.com")
plt.show()
Output:
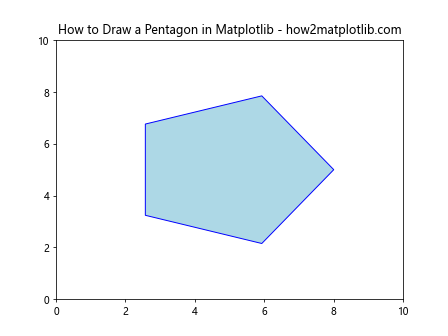
This example demonstrates how to generate vertices for a regular pentagon and create a Polygon object from those vertices.
Adding Text and Annotations to Shapes
When drawing shapes in Matplotlib, you might want to add text or annotations to provide additional information or context. Matplotlib provides several ways to add text to your plots.
Adding Text Inside a Shape
Here’s an example of how to add text inside a rectangle:
import matplotlib.pyplot as plt
from matplotlib.patches import Rectangle

fig, ax = plt.subplots()
ax.set_xlim(0, 10)
ax.set_ylim(0, 10)

rect = Rectangle((2, 2), 6, 4, facecolor='lightgreen', edgecolor='green')
ax.add_patch(rect)

ax.text(5, 4, "How to Draw Shapes\nin Matplotlib", ha='center', va='center', fontsize=12)

ax.set_title("Adding Text to Shapes in Matplotlib - how2matplotlib.com")
plt.show()
Output:
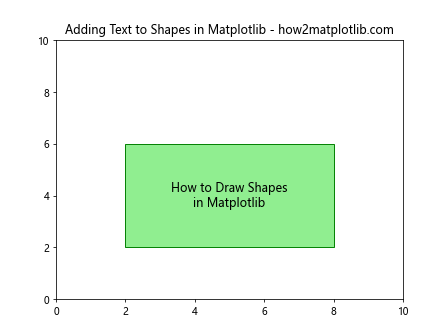
In this example, we use the ax.text() method to add text inside the rectangle. The ha and va parameters control the horizontal and vertical alignment of the text.
Adding Annotations to Shapes
Annotations can be used to point out specific features of a shape. Here’s an example of how to add an annotation to a circle:
import matplotlib.pyplot as plt
from matplotlib.patches import Circle

fig, ax = plt.subplots()
ax.set_xlim(0, 10)
ax.set_ylim(0, 10)

circle = Circle((5, 5), radius=2, facecolor='lightyellow', edgecolor='orange')
ax.add_patch(circle)

ax.annotate("Center", xy=(5, 5), xytext=(7, 7),
            arrowprops=dict(facecolor='black', shrink=0.05))

ax.set_title("Adding Annotations to Shapes in Matplotlib - how2matplotlib.com")
plt.show()
Output:
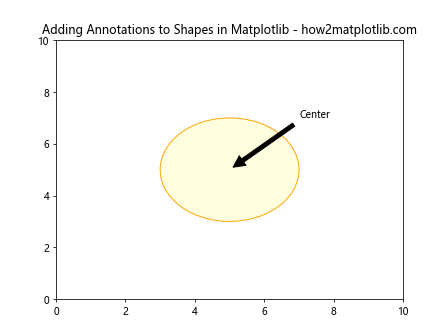
This example uses the ax.annotate() method to add an arrow pointing to the center of the circle with the text “Center”.
Styling and Customizing Shapes
Matplotlib offers various options for styling and customizing the appearance of shapes. You can adjust properties such as colors, line styles, transparency, and more.
Changing Line Styles and Colors
Here’s an example of how to customize the line style and color of a rectangle:
import matplotlib.pyplot as plt
from matplotlib.patches import Rectangle

fig, ax = plt.subplots()
ax.set_xlim(0, 10)
ax.set_ylim(0, 10)

rect = Rectangle((2, 2), 6, 4, facecolor='none', edgecolor='blue', linestyle='--', linewidth=2)
ax.add_patch(rect)

ax.set_title("Customizing Line Styles in Matplotlib - how2matplotlib.com")
plt.show()
Output:
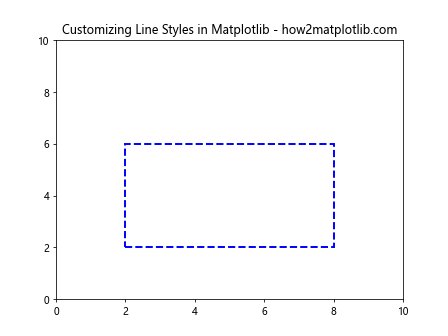
In this example, we set facecolor='none' to create a transparent rectangle and use linestyle='--' to create a dashed border.
Adding Transparency to Shapes
You can add transparency to shapes using the alpha parameter. Here’s an example with overlapping circles:
import matplotlib.pyplot as plt
from matplotlib.patches import Circle

fig, ax = plt.subplots()
ax.set_xlim(0, 10)
ax.set_ylim(0, 10)

circle1 = Circle((4, 5), radius=2, facecolor='red', alpha=0.5)
circle2 = Circle((6, 5), radius=2, facecolor='blue', alpha=0.5)

ax.add_patch(circle1)
ax.add_patch(circle2)

ax.set_title("Adding Transparency to Shapes in Matplotlib - how2matplotlib.com")
plt.show()
Output:
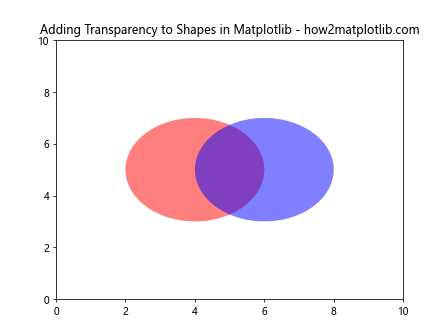
This example creates two overlapping circles with 50% transparency, allowing the overlapping area to be visible.
Creating Compound Shapes
You can create more complex shapes by combining multiple basic shapes. This technique allows you to build custom visualizations and diagrams.
Drawing a House Shape
Here’s an example of how to create a simple house shape using a combination of a rectangle and a triangle:
import matplotlib.pyplot as plt
from matplotlib.patches import Rectangle, Polygon

fig, ax = plt.subplots()
ax.set_xlim(0, 10)
ax.set_ylim(0, 10)

# House body
house_body = Rectangle((3, 2), 4, 3, facecolor='lightblue', edgecolor='blue')
ax.add_patch(house_body)

# Roof
roof = Polygon([(3, 5), (7, 5), (5, 7)], facecolor='red', edgecolor='darkred')
ax.add_patch(roof)

# Door
door = Rectangle((4.5, 2), 1, 2, facecolor='brown', edgecolor='black')
ax.add_patch(door)

ax.set_title("Drawing a House Shape in Matplotlib - how2matplotlib.com")
plt.show()
Output:
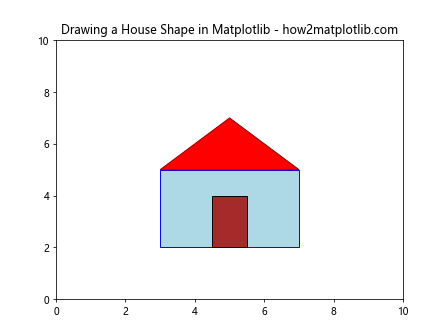
This example demonstrates how to combine a rectangle for the house body, a triangle for the roof, and another rectangle for the door to create a simple house shape.
Drawing Arrows and Lines
Arrows and lines are essential elements in many visualizations, especially when you want to show relationships or directions between different parts of your plot.
Drawing a Simple Arrow
Here’s how you can draw a simple arrow using the Arrow patch:
import matplotlib.pyplot as plt
from matplotlib.patches import Arrow

fig, ax = plt.subplots()
ax.set_xlim(0, 10)
ax.set_ylim(0, 10)

arrow = Arrow(2, 2, 6, 6, width=0.5, color='green')
ax.add_patch(arrow)

ax.set_title("Drawing an Arrow in Matplotlib - how2matplotlib.com")
plt.show()
Output:
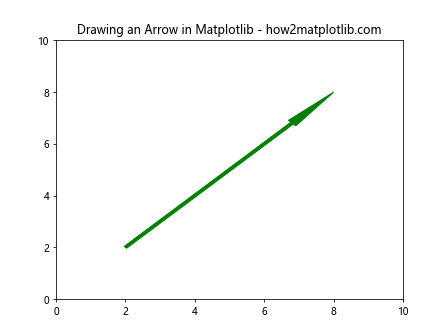
This example creates an arrow starting at (2, 2) and ending at (8, 8) with a width of 0.5 units.
Drawing Multiple Lines
You can draw multiple lines using the plot function. Here’s an example:
import matplotlib.pyplot as plt

fig, ax = plt.subplots()
ax.set_xlim(0, 10)
ax.set_ylim(0, 10)

ax.plot([1, 9], [2, 8], color='red', linestyle='-', linewidth=2)
ax.plot([1, 9], [8, 2], color='blue', linestyle='--', linewidth=2)

ax.set_title("Drawing Multiple Lines in Matplotlib - how2matplotlib.com")
plt.show()
Output:
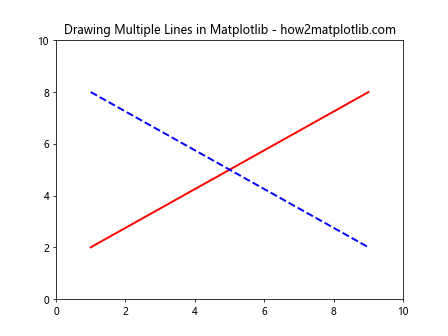
This example draws two lines: a solid red line and a dashed blue line.
Creating Patterns and Textures
Matplotlib allows you to create patterns and textures to fill shapes, adding more visual interest to your plots.
Using Hatch Patterns
You can use hatch patterns to fill shapes with different textures. Here’s an example:
import matplotlib.pyplot as plt
from matplotlib.patches import Rectangle

fig, ax = plt.subplots()
ax.set_xlim(0, 10)
ax.set_ylim(0, 10)

patterns = ['/', '\\', '|', '-', '+', 'x', 'o', 'O', '.', '*']

for i, pattern in enumerate(patterns):
    rect = Rectangle((i, 0), 1, 10, facecolor='none', edgecolor='black', hatch=pattern)
    ax.add_patch(rect)

ax.set_title("Hatch Patterns in Matplotlib - how2matplotlib.com")
plt.show()
Output:
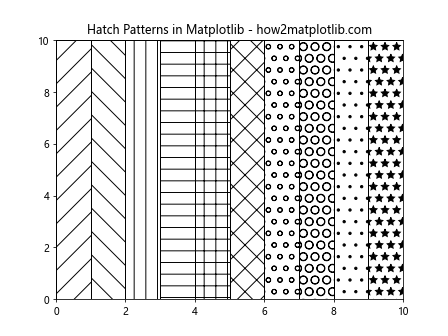
This example demonstrates various hatch patterns available in Matplotlib by creating a series of rectangles with different hatch styles.
Animating Shapes
Matplotlib also supports animation, allowing you to create dynamic visualizations with moving shapes.
Creating a Simple Shape Animation
Here’s an example of how to create a simple animation of a growing circle:
import matplotlib.pyplot as plt
from matplotlib.patches import Circle
from matplotlib.animation import FuncAnimation

fig, ax = plt.subplots()
ax.set_xlim(0, 10)
ax.set_ylim(0, 10)

circle = Circle((5, 5), radius=0, facecolor='lightblue', edgecolor='blue')
ax.add_patch(circle)

def update(frame):
    circle.set_radius(frame / 10)
    return circle,

ani = FuncAnimation(fig, update, frames=range(1, 51), interval=50, blit=True)

ax.set_title("Animating Shapes in Matplotlib - how2matplotlib.com")
plt.show()
Output:
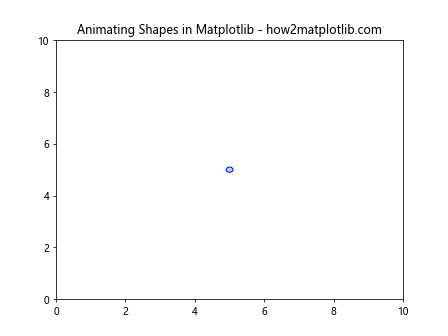
This example creates an animation of a circle growing from a radius of 0 to 5 over 50 frames.
Drawing 3D Shapes
While we’ve focused on 2D shapes so far, Matplotlib also supports drawing 3D shapes. Let’s explore how to create some basic 3D shapes.
Drawing a 3D Cube
Here’s an example of how to draw a 3D cube using Matplotlib:
import matplotlib.pyplot as plt
from mpl_toolkits.mplot3d import Axes3D
import numpy as np

fig = plt.figure()
ax = fig.add_subplot(111, projection='3d')

# Define the vertices of the cube
vertices = np.array([[0, 0, 0], [1, 0, 0], [1, 1, 0], [0, 1, 0],
                     [0, 0, 1], [1, 0, 1], [1, 1, 1], [0, 1, 1]])

# Define the faces of the cube
faces = [[vertices[j] for j in [0, 1, 2, 3]],
         [vertices[j] for j in [4, 5, 6, 7]],
         [vertices[j] for j in [0, 3, 7, 4]],
         [vertices[j] for j in [1, 2, 6, 5]],
         [vertices[j] for j in [0, 1, 5, 4]],
         [vertices[j] for j in [2, 3, 7, 6]]]

# Plot the faces
for face in faces:
    face = np.array(face)
    ax.add_collection3d(plt.Poly3DCollection([face], facecolors='cyan', linewidths=1, edgecolors='r', alpha=.25))

ax.set_xlim(0, 1)
ax.set_ylim(0, 1)
ax.set_zlim(0, 1)

ax.set_title("Drawing a 3D Cube in Matplotlib - how2matplotlib.com")
plt.show()
This example creates a 3D cube by defining its vertices and faces, then using Poly3DCollection to draw the faces.
Combining Shapes with Data Visualization
One of the powerful aspects of drawing shapes in Matplotlib is the ability to combine them with data visualization techniques. Let’s explore a few examples of how shapes can enhance data plots.
Using Shapes to Highlight Data Points
Here’s an example of how to use circles to highlight specific data points on a scatter plot:
import matplotlib.pyplot as plt
import numpy as np
from matplotlib.patches import Circle

fig, ax = plt.subplots()

# Generate some random data
np.random.seed(42)
x = np.random.rand(50)
y = np.random.rand(50)

# Create a scatter plot
ax.scatter(x, y, color='blue', alpha=0.6)

# Highlight specific points with circles
highlight_indices = [10, 20, 30]
for idx in highlight_indices:
    circle = Circle((x[idx], y[idx]), radius=0.03, facecolor='none', edgecolor='red', linewidth=2)
    ax.add_patch(circle)

ax.set_xlim(0, 1)
ax.set_ylim(0, 1)
ax.set_title("Highlighting Data Points with Shapes - how2matplotlib.com")
plt.show()
Output:
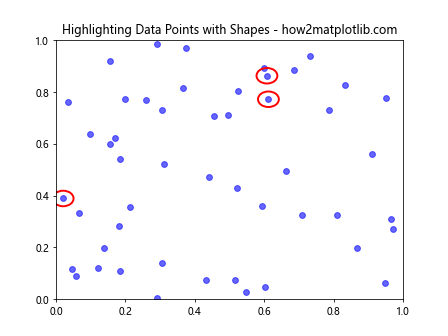
This example creates a scatter plot and uses circles to highlight specific data points.
Creating a Custom Legend with Shapes
You can also use shapes to create custom legends for your plots. Here’s an example:
import matplotlib.pyplot as plt
from matplotlib.patches import Rectangle, Circle, Polygon

fig, ax = plt.subplots()
ax.set_xlim(0, 10)
ax.set_ylim(0, 10)

# Create some example shapes
rect = Rectangle((2, 2), 2, 2, facecolor='lightblue', edgecolor='blue')
circle = Circle((5, 5), radius=1, facecolor='lightgreen', edgecolor='green')
triangle = Polygon([(8, 2), (9, 4), (7, 4)], facecolor='lightcoral', edgecolor='red')

# Add shapes to the plot
ax.add_patch(rect)
ax.add_patch(circle)
ax.add_patch(triangle)

# Create a custom legend
legend_elements = [
    Rectangle((0, 0), 1, 1, facecolor='lightblue', edgecolor='blue', label='Rectangle'),
    Circle((0.5, 0.5), radius=0.5, facecolor='lightgreen', edgecolor='green', label='Circle'),
    Polygon([(0, 0), (1, 0.5), (0, 1)], facecolor='lightcoral', edgecolor='red', label='Triangle')
]

ax.legend(handles=legend_elements, loc='upper right')

ax.set_title("Custom Legend with Shapes in Matplotlib - how2matplotlib.com")
plt.show()
Output:
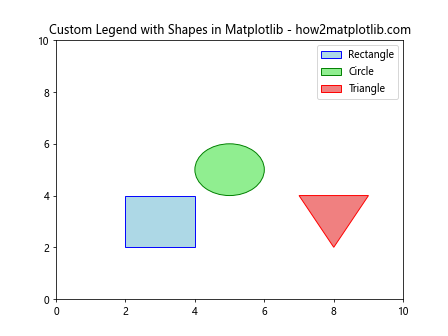
This example demonstrates how to create a custom legend using different shapes to represent different elements in your plot.
Advanced Shape Techniques
As you become more comfortable with drawing shapes in Matplotlib, you can explore more advanced techniques to create complex visualizations.
Creating a Venn Diagram
Venn diagrams are a great way to visualize set relationships. Here’s how you can create a simple Venn diagram using circles:
import matplotlib.pyplot as plt
from matplotlib.patches import Circle
import numpy as np

fig, ax = plt.subplots()
ax.set_xlim(0, 10)
ax.set_ylim(0, 10)

circle1 = Circle((4, 5), radius=2, facecolor='red', alpha=0.5)
circle2 = Circle((6, 5), radius=2, facecolor='blue', alpha=0.5)

ax.add_patch(circle1)
ax.add_patch(circle2)

ax.text(3, 5, "A", fontsize=20, ha='center', va='center')
ax.text(7, 5, "B", fontsize=20, ha='center', va='center')
ax.text(5, 5, "A ∩ B", fontsize=16, ha='center', va='center')

ax.set_title("Venn Diagram using Shapes in Matplotlib - how2matplotlib.com")
plt.axis('off')
plt.show()
Output:
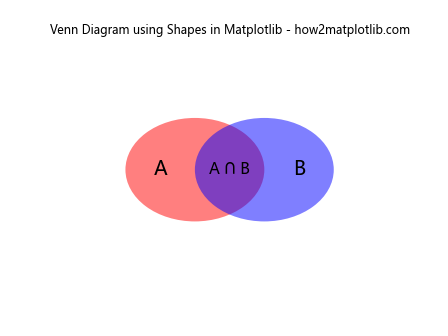
This example creates a simple two-set Venn diagram using overlapping circles.
Drawing a Custom Flowchart
You can use various shapes to create custom flowcharts or diagrams. Here’s an example of a simple flowchart:
import matplotlib.pyplot as plt
from matplotlib.patches import Rectangle, Arrow

fig, ax = plt.subplots(figsize=(10, 6))
ax.set_xlim(0, 10)
ax.set_ylim(0, 6)

# Create flowchart elements
start = Rectangle((4, 5), 2, 1, facecolor='lightgreen', edgecolor='green')
process1 = Rectangle((2, 3), 2, 1, facecolor='lightblue', edgecolor='blue')
process2 = Rectangle((6, 3), 2, 1, facecolor='lightblue', edgecolor='blue')
end = Rectangle((4, 1), 2, 1, facecolor='lightcoral', edgecolor='red')

# Add elements to the plot
ax.add_patch(start)
ax.add_patch(process1)
ax.add_patch(process2)
ax.add_patch(end)

# Add arrows
ax.add_patch(Arrow(5, 5, 0, -1, width=0.3, color='gray'))
ax.add_patch(Arrow(3, 3, 0, -1, width=0.3, color='gray'))
ax.add_patch(Arrow(7, 3, 0, -1, width=0.3, color='gray'))
ax.add_patch(Arrow(4, 3.5, -1, 0, width=0.3, color='gray'))
ax.add_patch(Arrow(6, 3.5, 1, 0, width=0.3, color='gray'))

# Add text
ax.text(5, 5.5, "Start", ha='center', va='center')
ax.text(3, 3.5, "Process A", ha='center', va='center')
ax.text(7, 3.5, "Process B", ha='center', va='center')
ax.text(5, 1.5, "End", ha='center', va='center')

ax.set_title("Custom Flowchart using Shapes in Matplotlib - how2matplotlib.com")
plt.axis('off')
plt.show()
Output:
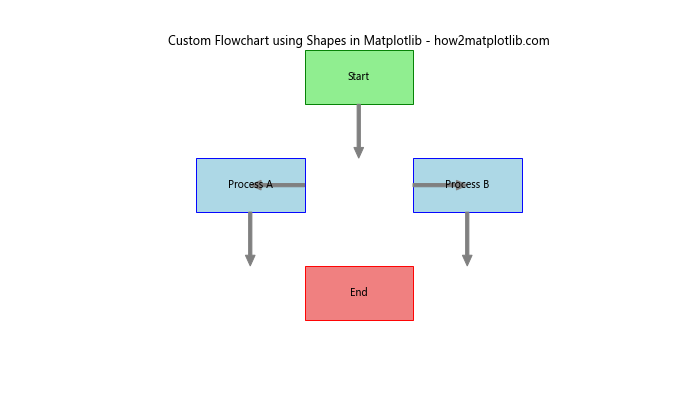
This example demonstrates how to create a simple flowchart using rectangles for nodes and arrows for connections.
Best Practices for Drawing Shapes in Matplotlib
As you continue to work with shapes in Matplotlib, keep these best practices in mind:
- Keep it simple: Start with basic shapes and gradually build complexity as needed.
- Use appropriate colors: Choose colors that are visually appealing and enhance the readability of your plot.
- Maintain consistency: Use consistent styles and colors for similar elements throughout your visualization.
- Add labels and annotations: Provide context for your shapes with clear labels and annotations.
- Consider accessibility: Use color combinations that are accessible to color-blind individuals.
- Optimize for performance: When working with many shapes, consider using collections for better performance.
- Experiment and iterate: Don’t be afraid to try different approaches and refine your visualizations.
Conclusion
Learning how to draw shapes in Matplotlib with Python opens up a world of possibilities for creating custom visualizations and enhancing your data plots. From basic geometric shapes like rectangles and circles to more complex compound shapes and 3D objects, Matplotlib provides a flexible and powerful toolkit for bringing your ideas to life.
By mastering the techniques covered in this guide, you’ll be well-equipped to create visually appealing and informative graphics that effectively communicate your data and ideas. Remember to experiment with different combinations of shapes, colors, and styles to find the perfect visual representation for your specific needs.