How to Change Point to Comma in Matplotlib Graphics in Python
How to change point to comma in Matplotlib graphics in Python is an essential skill for data visualization, especially when working with international data formats. This article will provide a detailed explanation of various methods and techniques to accomplish this task, along with practical examples and code snippets.
Understanding the Need to Change Point to Comma in Matplotlib
Before diving into the specifics of how to change point to comma in Matplotlib graphics in Python, it’s important to understand why this might be necessary. In many countries, especially in Europe, the comma is used as a decimal separator instead of a point. When creating visualizations for an international audience, it’s crucial to adapt to local conventions to ensure clarity and avoid confusion.
Matplotlib, being a powerful plotting library in Python, provides several ways to customize the appearance of numbers on axes, legends, and other plot elements. By learning how to change point to comma in Matplotlib graphics, you can create more accessible and culturally appropriate visualizations.
Basic Matplotlib Setup for Changing Point to Comma
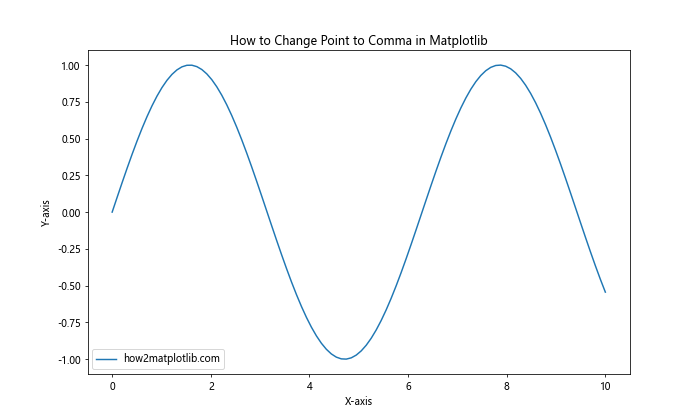
To begin with, let’s set up a basic Matplotlib plot and then explore how to change point to comma. First, we’ll import the necessary libraries and create a simple plot.
import matplotlib.pyplot as plt
import numpy as np

x = np.linspace(0, 10, 100)
y = np.sin(x)

plt.figure(figsize=(10, 6))
plt.plot(x, y, label='how2matplotlib.com')
plt.title('How to Change Point to Comma in Matplotlib')
plt.xlabel('X-axis')
plt.ylabel('Y-axis')
plt.legend()
plt.show()
Output:

This code creates a simple sine wave plot. Now, let’s explore various methods to change the decimal point to a comma in this Matplotlib graphic.
Using Locale Settings to Change Point to Comma
One of the most straightforward ways to change point to comma in Matplotlib graphics in Python is by using the locale settings. The locale module in Python allows you to adapt your program to use the conventions of a particular country or language for displaying numbers, dates, and other formatting options.
Here’s how you can use locale settings to change point to comma in Matplotlib:
import matplotlib.pyplot as plt
import numpy as np
import locale

# Set locale to a country that uses comma as decimal separator
locale.setlocale(locale.LC_ALL, 'fr_FR.UTF-8')

x = np.linspace(0, 10, 100)
y = np.sin(x)

plt.figure(figsize=(10, 6))
plt.plot(x, y, label='how2matplotlib.com')
plt.title('How to Change Point to Comma in Matplotlib')
plt.xlabel('X-axis')
plt.ylabel('Y-axis')
plt.legend()

# Format the tick labels to use comma
plt.gca().format_coord = lambda x, y: f'x={x:n}, y={y:n}'

plt.show()
Output:
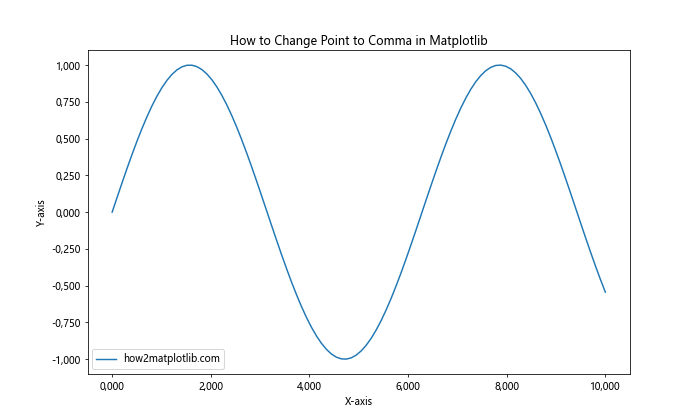
In this example, we set the locale to French, which uses a comma as the decimal separator. The format_coord function is then used to format the coordinate display in the plot.
Using FuncFormatter to Change Point to Comma
The FuncFormatter class in Matplotlib provides a flexible way to customize the formatting of tick labels. This method is particularly useful when you want to change point to comma in Matplotlib graphics in Python with more control over the formatting process.
Here’s an example of how to use FuncFormatter:
import matplotlib.pyplot as plt
import numpy as np
from matplotlib.ticker import FuncFormatter

def comma_formatter(x, pos):
    return f"{x:.3f}".replace(".", ",")

x = np.linspace(0, 10, 100)
y = np.sin(x)

plt.figure(figsize=(10, 6))
plt.plot(x, y, label='how2matplotlib.com')
plt.title('How to Change Point to Comma in Matplotlib')
plt.xlabel('X-axis')
plt.ylabel('Y-axis')
plt.legend()

formatter = FuncFormatter(comma_formatter)
plt.gca().xaxis.set_major_formatter(formatter)
plt.gca().yaxis.set_major_formatter(formatter)

plt.show()
Output:
In this example, we define a custom comma_formatter function that replaces the decimal point with a comma. We then use FuncFormatter to apply this function to both the x and y axes.
Changing Point to Comma in Specific Plot Elements
Sometimes, you may want to change point to comma in Matplotlib graphics in Python for specific elements of your plot, such as annotations or text labels. Here’s how you can do that:
import matplotlib.pyplot as plt
import numpy as np

x = np.linspace(0, 10, 100)
y = np.sin(x)

plt.figure(figsize=(10, 6))
plt.plot(x, y, label='how2matplotlib.com')
plt.title('How to Change Point to Comma in Matplotlib')
plt.xlabel('X-axis')
plt.ylabel('Y-axis')
plt.legend()

# Add an annotation with comma as decimal separator
max_y = np.max(y)
max_x = x[np.argmax(y)]
plt.annotate(f'Max: ({max_x:.2f}, {max_y:.2f})'.replace('.', ','),
             xy=(max_x, max_y), xytext=(max_x+1, max_y),
             arrowprops=dict(facecolor='black', shrink=0.05))

plt.show()
Output:
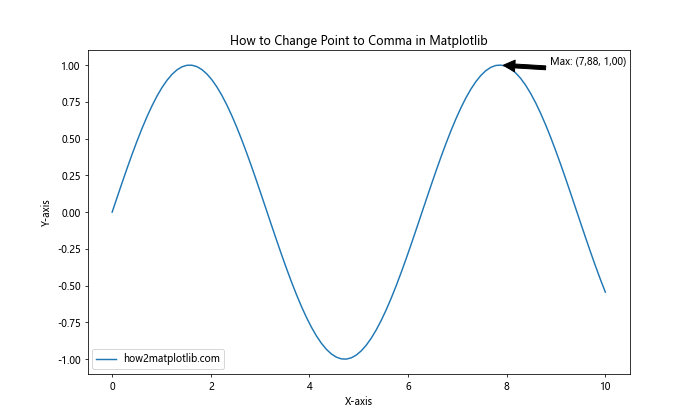
In this example, we add an annotation to the plot showing the maximum point of the sine wave. We use string replacement to change the decimal point to a comma in the annotation text.
Changing Point to Comma in Colorbar Labels
When working with colorbars in Matplotlib, you might also want to change point to comma in the colorbar labels. Here’s how you can achieve this:
import matplotlib.pyplot as plt
import numpy as np

def comma_formatter(x, pos):
    return f"{x:.2f}".replace(".", ",")

x = np.linspace(0, 10, 100)
y = np.linspace(0, 10, 100)
X, Y = np.meshgrid(x, y)
Z = np.sin(X) * np.cos(Y)

plt.figure(figsize=(10, 8))
c = plt.pcolormesh(X, Y, Z, cmap='viridis')
plt.title('How to Change Point to Comma in Matplotlib Colorbar')
plt.xlabel('X-axis')
plt.ylabel('Y-axis')

cbar = plt.colorbar(format=comma_formatter)
cbar.set_label('how2matplotlib.com')

plt.show()
Output:
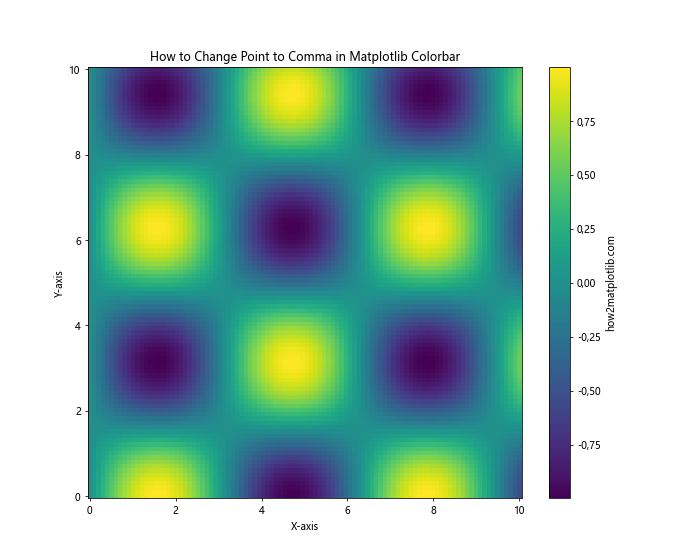
In this example, we create a 2D plot with a colorbar. We use a custom formatter function to change the decimal point to a comma in the colorbar labels.
Changing Point to Comma in Legend Labels
When you have numerical values in your legend labels, you might want to change point to comma in these labels as well. Here’s how you can do it:
import matplotlib.pyplot as plt
import numpy as np

x = np.linspace(0, 10, 100)
y1 = np.sin(x)
y2 = np.cos(x)

plt.figure(figsize=(10, 6))
plt.plot(x, y1, label=f'Sin (Max: {np.max(y1):.2f})'.replace('.', ','))
plt.plot(x, y2, label=f'Cos (Max: {np.max(y2):.2f})'.replace('.', ','))
plt.title('How to Change Point to Comma in Matplotlib Legend')
plt.xlabel('X-axis')
plt.ylabel('Y-axis')
plt.legend(title='how2matplotlib.com')

plt.show()
Output:
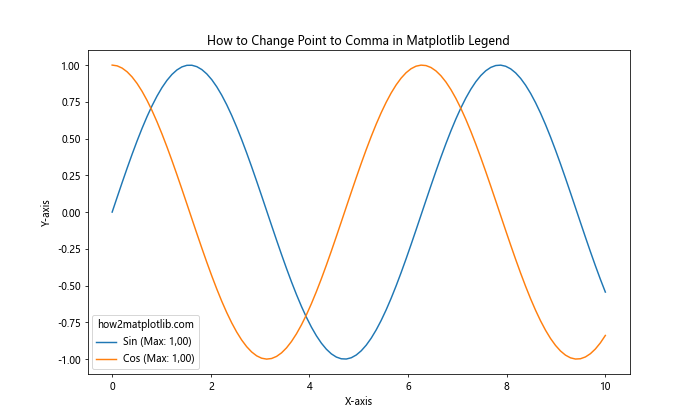
In this example, we include the maximum values of the sine and cosine functions in the legend labels, using string replacement to change the decimal point to a comma.
Changing Point to Comma in Multiple Subplots
When working with multiple subplots, you might want to change point to comma consistently across all subplots. Here’s how you can achieve this:
import matplotlib.pyplot as plt
import numpy as np
from matplotlib.ticker import FuncFormatter

def comma_formatter(x, pos):
    return f"{x:.2f}".replace(".", ",")

x = np.linspace(0, 10, 100)
y1 = np.sin(x)
y2 = np.cos(x)

fig, (ax1, ax2) = plt.subplots(2, 1, figsize=(10, 10))
fig.suptitle('How to Change Point to Comma in Matplotlib Subplots')

ax1.plot(x, y1)
ax1.set_title('Sine Wave')
ax1.set_xlabel('X-axis')
ax1.set_ylabel('Y-axis')

ax2.plot(x, y2)
ax2.set_title('Cosine Wave')
ax2.set_xlabel('X-axis')
ax2.set_ylabel('Y-axis')

formatter = FuncFormatter(comma_formatter)
for ax in (ax1, ax2):
    ax.xaxis.set_major_formatter(formatter)
    ax.yaxis.set_major_formatter(formatter)

plt.figtext(0.5, 0.01, 'how2matplotlib.com', ha='center')
plt.tight_layout()
plt.show()
Output:
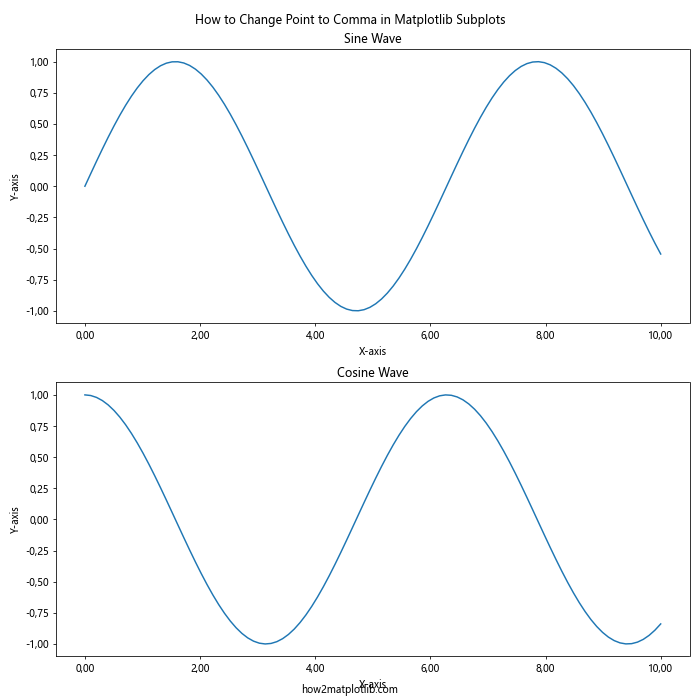
In this example, we create two subplots and apply the comma formatter to both x and y axes of each subplot.
Changing Point to Comma in Date Plots
When working with date plots in Matplotlib, you might encounter decimal numbers in the y-axis. Here’s how you can change point to comma in such plots:
import matplotlib.pyplot as plt
import numpy as np
from matplotlib.dates import DateFormatter
from matplotlib.ticker import FuncFormatter
import datetime

def comma_formatter(x, pos):
    return f"{x:.2f}".replace(".", ",")

dates = [datetime.datetime(2023, 1, 1) + datetime.timedelta(days=i) for i in range(100)]
values = np.cumsum(np.random.randn(100))

plt.figure(figsize=(12, 6))
plt.plot(dates, values, label='how2matplotlib.com')
plt.title('How to Change Point to Comma in Matplotlib Date Plot')
plt.xlabel('Date')
plt.ylabel('Value')
plt.legend()

plt.gca().xaxis.set_major_formatter(DateFormatter('%Y-%m-%d'))
plt.gca().yaxis.set_major_formatter(FuncFormatter(comma_formatter))

plt.gcf().autofmt_xdate()  # Rotate and align the tick labels
plt.tight_layout()
plt.show()
Output:
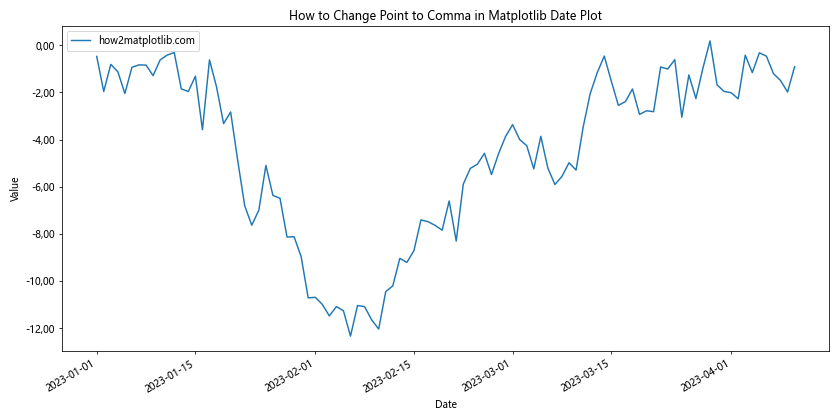
In this example, we create a date plot and use the FuncFormatter to change the decimal point to a comma on the y-axis, while keeping the date format on the x-axis.
Changing Point to Comma in Histogram Plots
Histograms often display decimal numbers in bin labels or y-axis values. Here’s how you can change point to comma in a histogram plot:
import matplotlib.pyplot as plt
import numpy as np
from matplotlib.ticker import FuncFormatter

def comma_formatter(x, pos):
    return f"{x:.2f}".replace(".", ",")

data = np.random.normal(0, 1, 1000)

plt.figure(figsize=(10, 6))
plt.hist(data, bins=30, edgecolor='black')
plt.title('How to Change Point to Comma in Matplotlib Histogram')
plt.xlabel('Value')
plt.ylabel('Frequency')

formatter = FuncFormatter(comma_formatter)
plt.gca().xaxis.set_major_formatter(formatter)
plt.gca().yaxis.set_major_formatter(formatter)

plt.text(0.5, -0.1, 'how2matplotlib.com', ha='center', va='center', transform=plt.gca().transAxes)
plt.tight_layout()
plt.show()
Output:
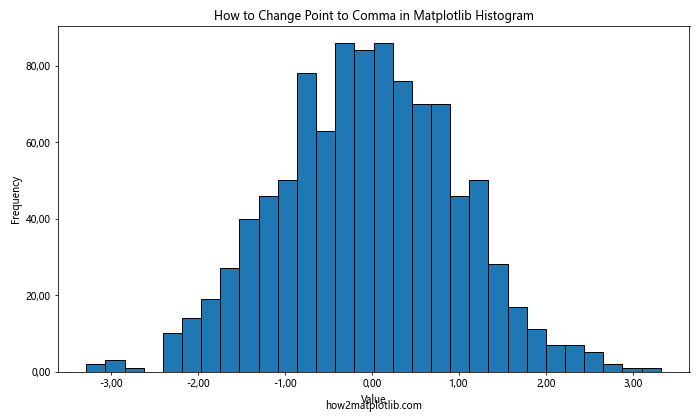
In this example, we create a histogram and apply the comma formatter to both x and y axes to change the decimal point to a comma.
Changing Point to Comma in Scatter Plots
Scatter plots often involve decimal numbers in both x and y coordinates. Here’s how you can change point to comma in a scatter plot:
import matplotlib.pyplot as plt
import numpy as np
from matplotlib.ticker import FuncFormatter

def comma_formatter(x, pos):
    return f"{x:.2f}".replace(".", ",")

x = np.random.rand(50)
y = np.random.rand(50)
colors = np.random.rand(50)
sizes = 1000 * np.random.rand(50)

plt.figure(figsize=(10, 8))
plt.scatter(x, y, c=colors, s=sizes, alpha=0.5, cmap='viridis')
plt.title('How to Change Point to Comma in Matplotlib Scatter Plot')
plt.xlabel('X-axis')
plt.ylabel('Y-axis')

formatter = FuncFormatter(comma_formatter)
plt.gca().xaxis.set_major_formatter(formatter)
plt.gca().yaxis.set_major_formatter(formatter)

cbar = plt.colorbar(format=formatter)
cbar.set_label('how2matplotlib.com')

plt.tight_layout()
plt.show()
Output:
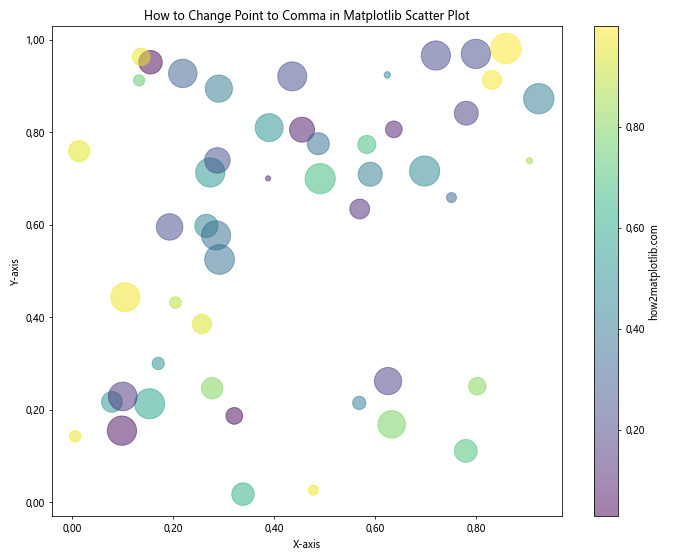
In this example, we create a scatter plot and apply the comma formatter to both x and y axes, as well as to the colorbar.
Changing Point to Comma in 3D Plots
When working with 3D plots in Matplotlib, you might want to change point to comma for all three axes. Here’s how you can do it:
import matplotlib.pyplot as plt
import numpy as np
from mpl_toolkits.mplot3d import Axes3D
from matplotlib.ticker import FuncFormatter

def comma_formatter(x, pos):
    return f"{x:.2f}".replace(".", ",")

fig = plt.figure(figsize=(12, 8))
ax = fig.add_subplot(111, projection='3d')

x = np.linspace(-5, 5, 100)
y = np.linspace(-5, 5, 100)
X, Y = np.meshgrid(x, y)
Z = np.sin(np.sqrt(X**2 + Y**2))

surf = ax.plot_surface(X, Y, Z, cmap='viridis')

ax.set_title('How to Change Point to Comma in Matplotlib 3D Plot')
ax.set_xlabel('X-axis')
ax.set_ylabel('Y-axis')
ax.set_zlabel('Z-axis')

formatter =FuncFormatter(comma_formatter)
ax.xaxis.set_major_formatter(formatter)
ax.yaxis.set_major_formatter(formatter)
ax.zaxis.set_major_formatter(formatter)

cbar = fig.colorbar(surf, format=formatter)
cbar.set_label('how2matplotlib.com')

plt.tight_layout()
plt.show()
Output:
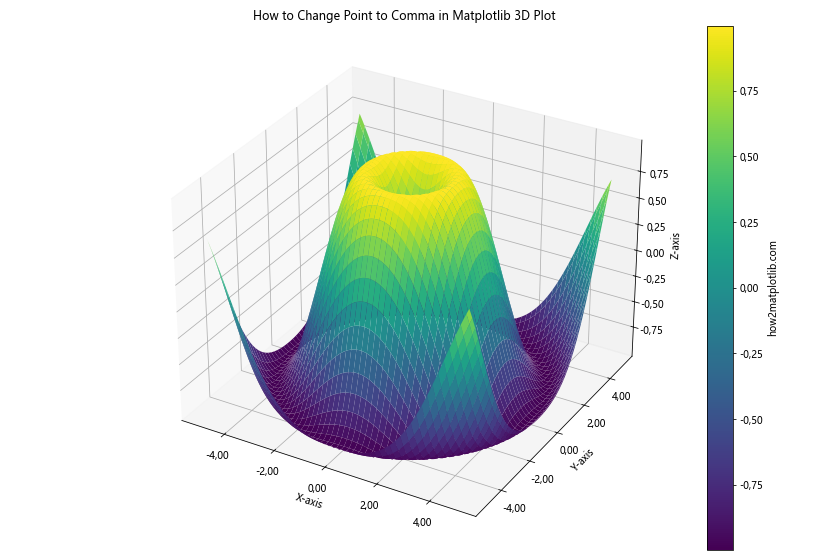
In this example, we create a 3D surface plot and apply the comma formatter to all three axes and the colorbar.
Changing Point to Comma in Polar Plots
Polar plots can also benefit from changing point to comma for better readability in certain regions. Here’s how you can achieve this:
import matplotlib.pyplot as plt
import numpy as np
from matplotlib.ticker import FuncFormatter

def comma_formatter(x, pos):
    return f"{x:.2f}".replace(".", ",")

r = np.arange(0, 2, 0.01)
theta = 2 * np.pi * r

fig, ax = plt.subplots(subplot_kw=dict(projection='polar'), figsize=(10, 10))
ax.plot(theta, r)
ax.set_title('How to Change Point to Comma in Matplotlib Polar Plot')

formatter = FuncFormatter(comma_formatter)
ax.xaxis.set_major_formatter(formatter)
ax.yaxis.set_major_formatter(formatter)

plt.text(0.5, -0.1, 'how2matplotlib.com', ha='center', va='center', transform=ax.transAxes)
plt.tight_layout()
plt.show()
Output:
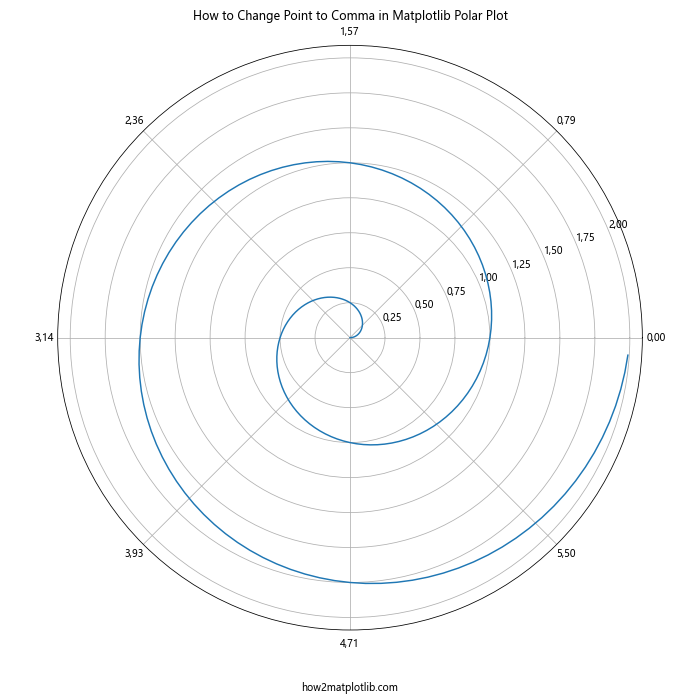
In this example, we create a polar plot and apply the comma formatter to both the radial and angular axes.
Changing Point to Comma in Logarithmic Plots
When working with logarithmic scales, changing point to comma can be particularly important for readability. Here’s how you can do it:
import matplotlib.pyplot as plt
import numpy as np
from matplotlib.ticker import FuncFormatter

def comma_formatter(x, pos):
    return f"{x:.2f}".replace(".", ",")

x = np.logspace(0, 5, 100)
y = x**2

plt.figure(figsize=(10, 6))
plt.loglog(x, y, label='how2matplotlib.com')
plt.title('How to Change Point to Comma in Matplotlib Logarithmic Plot')
plt.xlabel('X-axis (log scale)')
plt.ylabel('Y-axis (log scale)')
plt.legend()

formatter = FuncFormatter(comma_formatter)
plt.gca().xaxis.set_major_formatter(formatter)
plt.gca().yaxis.set_major_formatter(formatter)

plt.tight_layout()
plt.show()
Output:
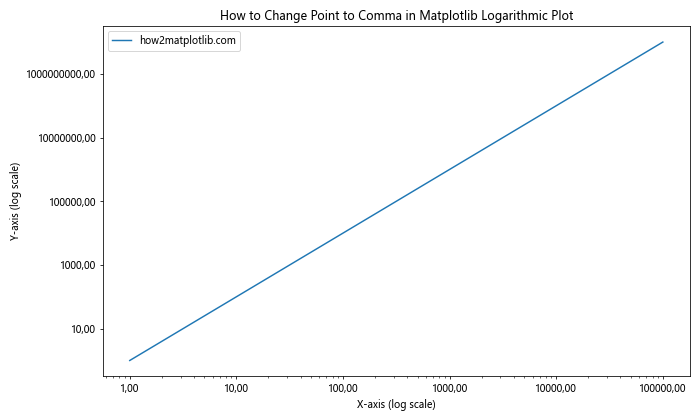
In this example, we create a log-log plot and apply the comma formatter to both axes, ensuring that even in logarithmic scale, the decimal separator is a comma.
Changing Point to Comma in Contour Plots
Contour plots often involve many decimal numbers in their labels. Here’s how you can change point to comma in a contour plot:
import matplotlib.pyplot as plt
import numpy as np
from matplotlib.ticker import FuncFormatter

def comma_formatter(x, pos):
    return f"{x:.2f}".replace(".", ",")

x = np.linspace(-3, 3, 100)
y = np.linspace(-3, 3, 100)
X, Y = np.meshgrid(x, y)
Z = np.sin(X) * np.cos(Y)

plt.figure(figsize=(10, 8))
cs = plt.contourf(X, Y, Z, levels=20, cmap='viridis')
plt.title('How to Change Point to Comma in Matplotlib Contour Plot')
plt.xlabel('X-axis')
plt.ylabel('Y-axis')

formatter = FuncFormatter(comma_formatter)
plt.gca().xaxis.set_major_formatter(formatter)
plt.gca().yaxis.set_major_formatter(formatter)

cbar = plt.colorbar(format=formatter)
cbar.set_label('how2matplotlib.com')

plt.tight_layout()
plt.show()
Output:
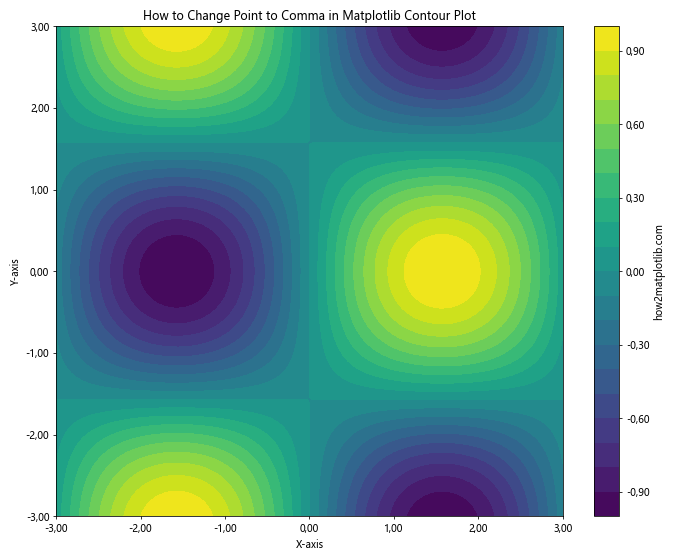
In this example, we create a contour plot and apply the comma formatter to both axes and the colorbar.
Changing Point to Comma in Custom Tick Locations
Sometimes you might want to set custom tick locations and change point to comma for these specific ticks. Here’s how you can do it:
import matplotlib.pyplot as plt
import numpy as np
from matplotlib.ticker import FixedLocator, FuncFormatter

def comma_formatter(x, pos):
    return f"{x:.2f}".replace(".", ",")

x = np.linspace(0, 10, 100)
y = np.sin(x)

plt.figure(figsize=(10, 6))
plt.plot(x, y, label='how2matplotlib.com')
plt.title('How to Change Point to Comma in Matplotlib with Custom Ticks')
plt.xlabel('X-axis')
plt.ylabel('Y-axis')
plt.legend()

custom_ticks = [0, 1.57, 3.14, 4.71, 6.28]
plt.gca().xaxis.set_major_locator(FixedLocator(custom_ticks))
plt.gca().xaxis.set_major_formatter(FuncFormatter(comma_formatter))
plt.gca().yaxis.set_major_formatter(FuncFormatter(comma_formatter))

plt.tight_layout()
plt.show()
Output:
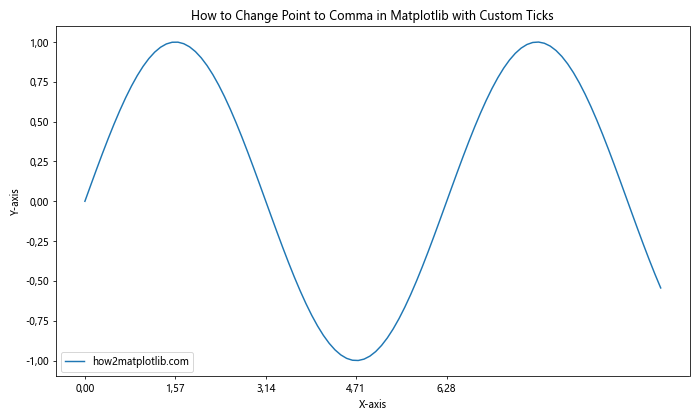
In this example, we set custom tick locations on the x-axis and apply the comma formatter to both axes.
Conclusion
Changing point to comma in Matplotlib graphics in Python is a crucial skill for creating visualizations that are accessible and appropriate for international audiences. Throughout this article, we’ve explored various methods to achieve this, including:
- Using locale settings
- Implementing custom formatters with ScalarFormatter
- Using FuncFormatter for flexible formatting
- Changing decimal separators in specific plot elements
- Modifying colorbar labels
- Adjusting legend labels
- Handling multiple subplots
- Working with date plots
- Formatting histogram plots
- Adapting scatter plots
- Modifying 3D plots
- Adjusting polar plots
- Handling logarithmic scales
- Formatting contour plots
- Setting custom tick locations
By mastering these techniques, you’ll be able to create Matplotlib graphics that are not only visually appealing but also culturally appropriate and easily understood by a global audience. Remember that consistency is key when changing point to comma in your visualizations, so apply the formatting uniformly across all relevant elements of your plots.