How to Create a Histogram with Total Height Equal to 1 Using Matplotlib
Plotting a histogram with total height equal to 1 is a powerful visualization technique in data analysis and statistics. This article will explore various aspects of creating such histograms using Matplotlib, a popular plotting library in Python. We’ll cover the fundamentals, advanced techniques, and best practices for plotting a histogram with total height equal to 1.
Understanding the Concept of Plotting a Histogram with Total Height Equal to 1
When plotting a histogram with total height equal to 1, we’re essentially creating a normalized histogram. This type of histogram is particularly useful for comparing distributions of different sizes or for visualizing probability density functions. The key feature of a histogram with total height equal to 1 is that the sum of the heights of all bars equals 1, regardless of the number of bins or the range of data.
Let’s start with a basic example of plotting a histogram with total height equal to 1:
import matplotlib.pyplot as plt
import numpy as np

# Generate sample data
data = np.random.normal(0, 1, 1000)

# Create histogram with total height equal to 1
plt.hist(data, bins=30, density=True)
plt.title('Histogram with Total Height Equal to 1 - how2matplotlib.com')
plt.xlabel('Value')
plt.ylabel('Density')
plt.show()
Output:
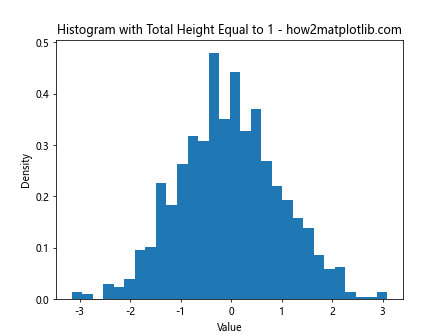
In this example, we use NumPy to generate random data from a normal distribution. The key parameter in the plt.hist() function is density=True, which ensures that the histogram is normalized so that the total area of the bars equals 1.
Benefits of Plotting a Histogram with Total Height Equal to 1
Plotting a histogram with total height equal to 1 offers several advantages:
- Normalization: It allows for easy comparison between datasets of different sizes.
- Probability interpretation: The y-axis represents probability density, making it easier to interpret probabilities.
- Consistency: It provides a consistent scale for comparing different distributions.
Let’s illustrate these benefits with an example comparing two datasets:
import matplotlib.pyplot as plt
import numpy as np

# Generate two datasets
data1 = np.random.normal(0, 1, 1000)
data2 = np.random.normal(2, 1.5, 1500)

# Plot histograms with total height equal to 1
plt.hist(data1, bins=30, density=True, alpha=0.7, label='Dataset 1')
plt.hist(data2, bins=30, density=True, alpha=0.7, label='Dataset 2')
plt.title('Comparing Distributions - how2matplotlib.com')
plt.xlabel('Value')
plt.ylabel('Density')
plt.legend()
plt.show()
Output:
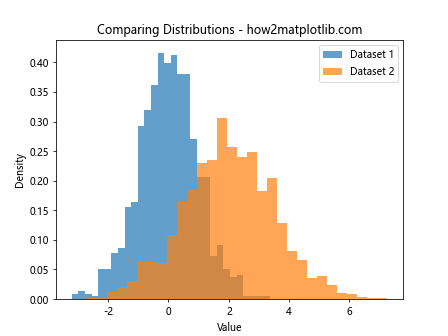
This example demonstrates how plotting histograms with total height equal to 1 allows for easy comparison between two datasets of different sizes and distributions.
Techniques for Plotting a Histogram with Total Height Equal to 1
There are several techniques and variations for plotting a histogram with total height equal to 1. Let’s explore some of these methods:
Using numpy.histogram
While Matplotlib provides a convenient hist() function, we can also use NumPy’s histogram() function for more control over the binning process:
import matplotlib.pyplot as plt
import numpy as np

data = np.random.exponential(2, 1000)

# Calculate histogram data
hist, bin_edges = np.histogram(data, bins=30, density=True)

# Plot the histogram
plt.bar(bin_edges[:-1], hist, width=np.diff(bin_edges), align='edge')
plt.title('Histogram with Total Height Equal to 1 using numpy - how2matplotlib.com')
plt.xlabel('Value')
plt.ylabel('Density')
plt.show()
Output:
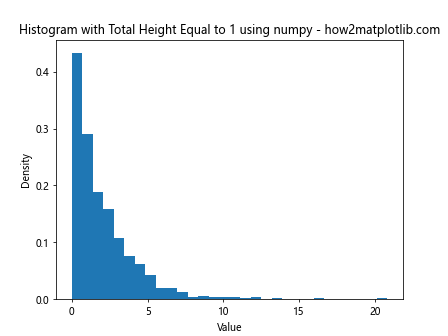
This method allows for more flexibility in how we plot the histogram, as we can use the plt.bar() function to create the bars manually.
Cumulative Histogram
We can also create a cumulative histogram with total height equal to 1, which is useful for visualizing the cumulative distribution function:
import matplotlib.pyplot as plt
import numpy as np

data = np.random.normal(0, 1, 1000)

plt.hist(data, bins=30, density=True, cumulative=True)
plt.title('Cumulative Histogram with Total Height Equal to 1 - how2matplotlib.com')
plt.xlabel('Value')
plt.ylabel('Cumulative Density')
plt.show()
Output:
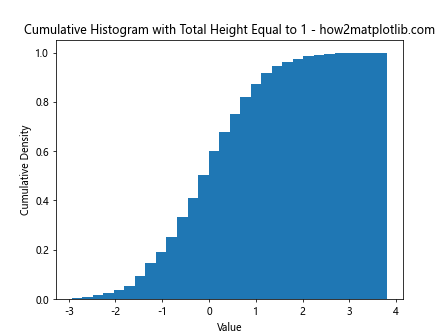
This example shows how to create a cumulative histogram where the final bar reaches a height of 1.
Customizing Histograms with Total Height Equal to 1
When plotting a histogram with total height equal to 1, we can apply various customizations to enhance the visualization:
Changing Bin Sizes
The number and size of bins can significantly affect the appearance of the histogram:
import matplotlib.pyplot as plt
import numpy as np

data = np.random.normal(0, 1, 1000)

plt.hist(data, bins=50, density=True, color='skyblue', edgecolor='black')
plt.title('Histogram with More Bins - how2matplotlib.com')
plt.xlabel('Value')
plt.ylabel('Density')
plt.show()
Output:
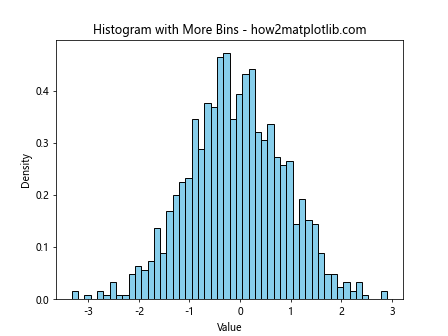
This example uses more bins to provide a finer-grained view of the distribution.
Adding a Kernel Density Estimate
We can overlay a kernel density estimate (KDE) on the histogram for a smoother representation of the distribution:
import matplotlib.pyplot as plt
import numpy as np
from scipy.stats import gaussian_kde

data = np.random.normal(0, 1, 1000)

plt.hist(data, bins=30, density=True, alpha=0.7)
kde = gaussian_kde(data)
x_range = np.linspace(data.min(), data.max(), 100)
plt.plot(x_range, kde(x_range), 'r-', label='KDE')
plt.title('Histogram with KDE - how2matplotlib.com')
plt.xlabel('Value')
plt.ylabel('Density')
plt.legend()
plt.show()
Output:
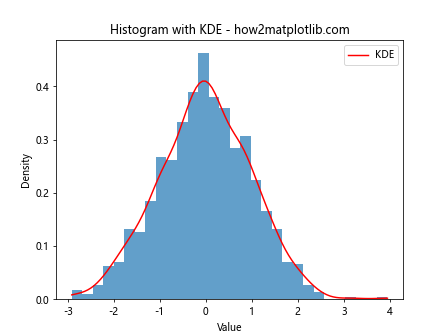
This example adds a KDE curve to the histogram, providing a smooth estimate of the probability density function.
Advanced Techniques for Plotting Histograms with Total Height Equal to 1
Let’s explore some advanced techniques for creating and customizing histograms with total height equal to 1:
Multiple Histograms on the Same Plot
We can plot multiple histograms on the same axes for easy comparison:
import matplotlib.pyplot as plt
import numpy as np

data1 = np.random.normal(0, 1, 1000)
data2 = np.random.normal(2, 1.5, 1000)

plt.hist(data1, bins=30, density=True, alpha=0.7, label='Dataset 1')
plt.hist(data2, bins=30, density=True, alpha=0.7, label='Dataset 2')
plt.title('Multiple Histograms - how2matplotlib.com')
plt.xlabel('Value')
plt.ylabel('Density')
plt.legend()
plt.show()
Output:
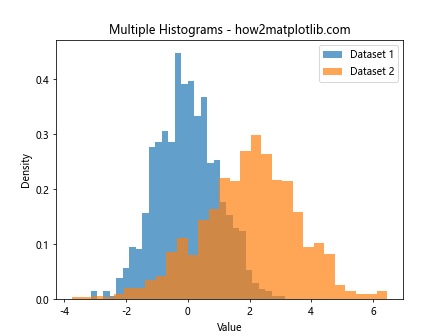
This example shows how to overlay multiple histograms for easy comparison of different distributions.
2D Histograms
We can create 2D histograms to visualize the joint distribution of two variables:
import matplotlib.pyplot as plt
import numpy as np

x = np.random.normal(0, 1, 1000)
y = np.random.normal(0, 1, 1000)

plt.hist2d(x, y, bins=30, density=True)
plt.colorbar(label='Density')
plt.title('2D Histogram - how2matplotlib.com')
plt.xlabel('X Value')
plt.ylabel('Y Value')
plt.show()
Output:
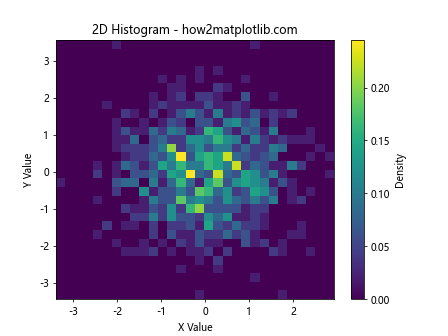
This example creates a 2D histogram where the color intensity represents the density of points in each bin.
Stacked Histograms
Stacked histograms can be useful for comparing multiple categories within a dataset:
import matplotlib.pyplot as plt
import numpy as np

data1 = np.random.normal(0, 1, 1000)
data2 = np.random.normal(1, 1, 1000)
data3 = np.random.normal(2, 1, 1000)

plt.hist([data1, data2, data3], bins=30, density=True, stacked=True, label=['Group 1', 'Group 2', 'Group 3'])
plt.title('Stacked Histogram - how2matplotlib.com')
plt.xlabel('Value')
plt.ylabel('Density')
plt.legend()
plt.show()
Output:
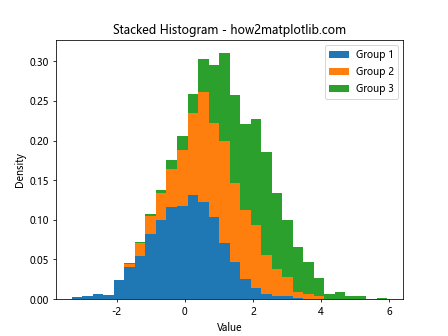
This example demonstrates how to create a stacked histogram where each category is represented by a different color.
Best Practices for Plotting Histograms with Total Height Equal to 1
When creating histograms with total height equal to 1, it’s important to follow some best practices to ensure clear and informative visualizations:
- Choose appropriate bin sizes
- Label axes and provide a title
- Use color effectively
- Include a legend when necessary
- Consider adding additional statistical information
Let’s implement these best practices in an example:
import matplotlib.pyplot as plt
import numpy as np
from scipy import stats

data = np.random.normal(0, 1, 1000)

plt.figure(figsize=(10, 6))
n, bins, patches = plt.hist(data, bins='auto', density=True, alpha=0.7, color='skyblue', edgecolor='black')

# Add a normal distribution curve
mu, sigma = stats.norm.fit(data)
x = np.linspace(mu - 3*sigma, mu + 3*sigma, 100)
plt.plot(x, stats.norm.pdf(x, mu, sigma), 'r-', lw=2, label='Normal Distribution')

plt.title('Histogram with Total Height Equal to 1 - Best Practices - how2matplotlib.com')
plt.xlabel('Value')
plt.ylabel('Density')
plt.legend()

# Add statistical information
plt.text(0.05, 0.95, f'Mean: {mu:.2f}\nStd Dev: {sigma:.2f}', transform=plt.gca().transAxes,
         verticalalignment='top', bbox=dict(boxstyle='round', facecolor='white', alpha=0.8))

plt.show()
Output:
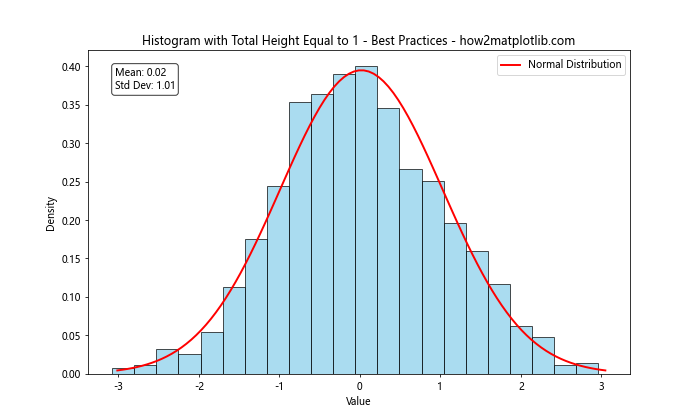
This example incorporates several best practices, including appropriate bin sizing, clear labeling, effective use of color, a legend, and additional statistical information.
Common Pitfalls When Plotting Histograms with Total Height Equal to 1
When creating histograms with total height equal to 1, there are several common pitfalls to avoid:
- Misinterpreting the y-axis
- Using inappropriate bin sizes
- Forgetting to normalize the histogram
- Overlooking outliers
Let’s address these pitfalls with an example:
import matplotlib.pyplot as plt
import numpy as np

# Generate data with outliers
data = np.concatenate([np.random.normal(0, 1, 990), np.random.normal(10, 1, 10)])

fig, (ax1, ax2) = plt.subplots(1, 2, figsize=(12, 5))

# Incorrect: Not normalized, inappropriate bins
ax1.hist(data, bins=10)
ax1.set_title('Incorrect Histogram - how2matplotlib.com')
ax1.set_xlabel('Value')
ax1.set_ylabel('Count')

# Correct: Normalized, appropriate bins, handling outliers
ax2.hist(data, bins='auto', density=True, range=(data.mean() - 3*data.std(), data.mean() + 3*data.std()))
ax2.set_title('Correct Histogram with Total Height Equal to 1 - how2matplotlib.com')
ax2.set_xlabel('Value')
ax2.set_ylabel('Density')

plt.tight_layout()
plt.show()
Output:
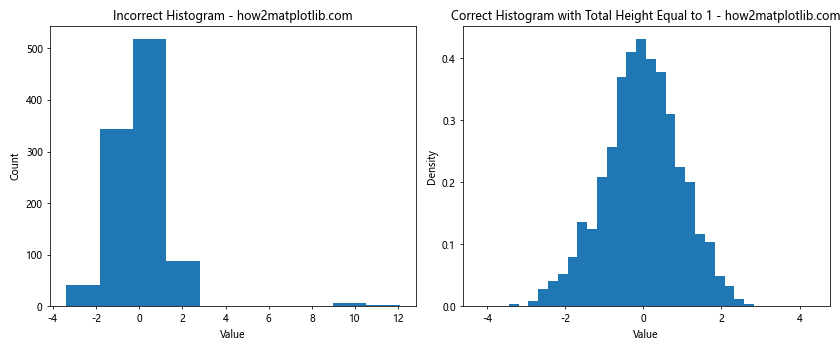
This example demonstrates the difference between an incorrect approach (not normalized, inappropriate bins) and a correct approach (normalized, appropriate bins, handling outliers) when plotting a histogram with total height equal to 1.
Applications of Histograms with Total Height Equal to 1
Histograms with total height equal to 1 have numerous applications across various fields:
- Data Analysis: Comparing distributions of different sizes
- Statistics: Visualizing probability density functions
- Machine Learning: Analyzing feature distributions
- Finance: Examining return distributions
- Natural Sciences: Studying measurement distributions
Let’s explore an example in the context of finance:
import matplotlib.pyplot as plt
import numpy as np

# Simulating daily returns for two stocks
stock1_returns = np.random.normal(0.001, 0.02, 1000)
stock2_returns = np.random.normal(0.002, 0.03, 1000)

plt.hist(stock1_returns, bins=30, density=True, alpha=0.7, label='Stock 1')
plt.hist(stock2_returns, bins=30, density=True, alpha=0.7, label='Stock 2')
plt.title('Daily Returns Distribution - how2matplotlib.com')
plt.xlabel('Daily Return')
plt.ylabel('Density')
plt.legend()
plt.show()
Output:
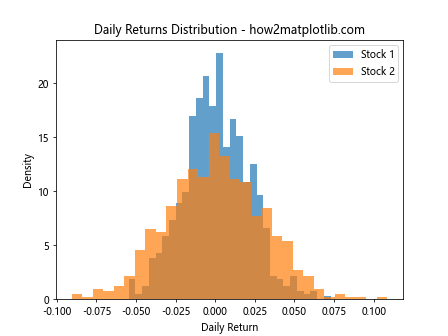
This example demonstrates how histograms with total height equal to 1 can be used to compare the return distributions of two different stocks.
Advanced Customization for Histograms with Total Height Equal to 1
For more sophisticated visualizations, we can apply advanced customization techniques to our histograms:
Custom Color Maps
We can use custom color maps to enhance the visual appeal of our histograms:
import matplotlib.pyplot as plt
import numpy as np

data = np.random.normal(0, 1, 1000)

plt.hist(data, bins=30, density=True, color=plt.cm.viridis(np.linspace(0, 1, 30)))
plt.title('Histogram with Custom Color Map - how2matplotlib.com')
plt.xlabel('Value')
plt.ylabel('Density')
plt.colorbar(label='Bin Index')
plt.show()
This example uses a custom color map to color the histogram bars based on their position.
Logarithmic Scale
For data with a wide range of values, a logarithmic scale can be useful:
import matplotlib.pyplot as plt
import numpy as np

data = np.random.lognormal(0, 1, 1000)

plt.hist(data, bins=30, density=True)
plt.xscale('log')
plt.title('Histogram with Logarithmic X-axis - how2matplotlib.com')
plt.xlabel('Value (log scale)')
plt.ylabel('Density')
plt.show()
Output:
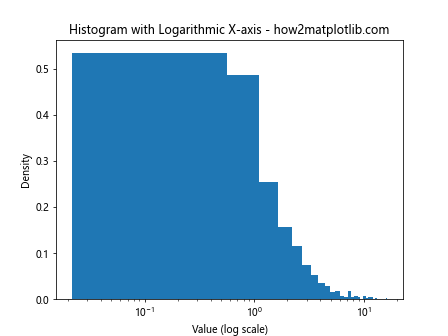
This example demonstrates how to use a logarithmic scale on the x-axis for better visualization of data with a wide range of values.
Comparing Different Methods for Plotting Histograms with Total Height Equal to 1
There are several methods for plotting histograms with total height equal to 1. Let’s compare some of these methods:
import matplotlib.pyplot as plt
import numpy as np
from scipy import stats

data = np.random.normal(0, 1, 1000)

fig, ((ax1, ax2), (ax3, ax4)) = plt.subplots(2, 2, figsize=(12, 10))

# Method 1: Using plt.hist with density=True
ax1.hist(data, bins=30, density=True)
ax1.set_title('plt.hist with density=True - how2matplotlib.com')

# Method 2: Using numpy.histogram
hist, bin_edges = np.histogram(data, bins=30, density=True)
ax2.bar(bin_edges[:-1], hist, width=np.diff(bin_edges), align='edge')
ax2.set_title('numpy.histogram - how2matplotlib.com')

# Method 3: Using scipy.stats.gaussian_kde
kde = stats.gaussian_kde(data)
x_range = np.linspace(data.min(), data.max(), 100)
ax3.plot(x_range, kde(x_range))
ax3.set_title('scipy.stats.gaussian_kde - how2matplotlib.com')

# Method 4: Using seaborn.kdeplot
import seaborn as sns

sns.kdeplot(data, ax=ax4)
ax4.set_title('seaborn.kdeplot - how2matplotlib.com')

for ax in (ax1, ax2, ax3, ax4):
    ax.set_xlabel('Value')
    ax.set_ylabel('Density')

plt.tight_layout()
plt.show()
Output:
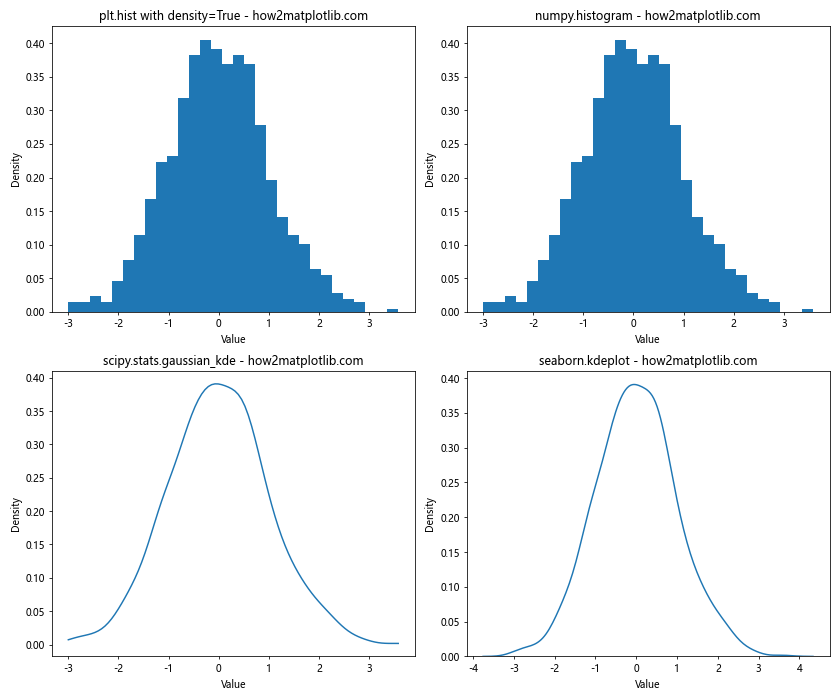
This example compares four different methods for plotting histograms or density estimates with total height equal to 1, showcasing the versatility of approaches available in Python.
Integrating Histograms with Total Height Equal to 1 into Larger Visualizations
Histograms with total height equal to 1 can be integrated into larger, more complex visualizations to provide additional context or information:
import matplotlib.pyplot as plt
import numpy as np

# Generate correlated data
mean = [0, 0]
cov = [[1, 0.5], [0.5, 1]]
data = np.random.multivariate_normal(mean, cov, 1000)

# Create the main scatter plot
fig = plt.figure(figsize=(10, 10))
gs = fig.add_gridspec(3, 3)
ax_main = fig.add_subplot(gs[1:, :-1])
ax_main.scatter(data[:, 0], data[:, 1], alpha=0.5)
ax_main.set_xlabel('X Value')
ax_main.set_ylabel('Y Value')

# Add histograms on the sides
ax_top = fig.add_subplot(gs[0, :-1], sharex=ax_main)
ax_top.hist(data[:, 0], bins=30, density=True)
ax_top.set_title('Integrated Histogram Visualization - how2matplotlib.com')

ax_right = fig.add_subplot(gs[1:, -1], sharey=ax_main)
ax_right.hist(data[:, 1], bins=30, density=True, orientation='horizontal')

# Remove ticks from histograms
ax_top.tick_params(axis="x", labelbottom=False)
ax_right.tick_params(axis="y", labelleft=False)

plt.tight_layout()
plt.show()
Output:
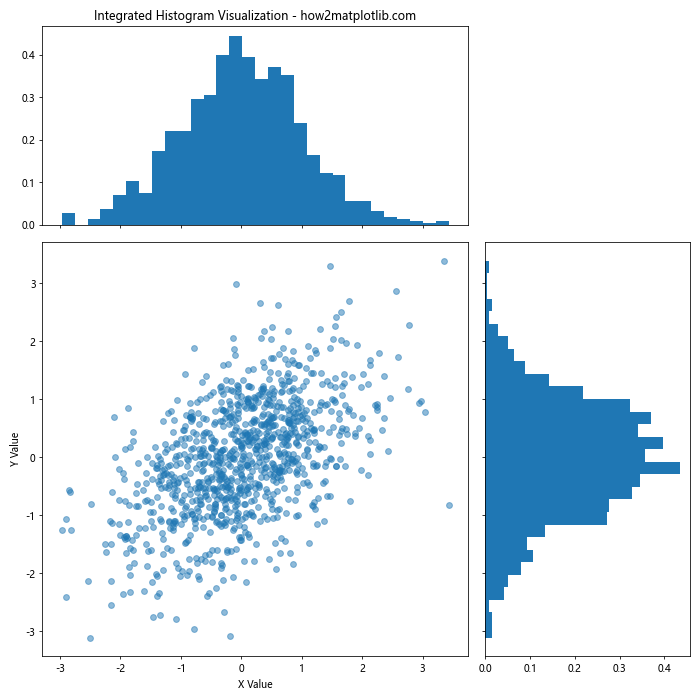
This example demonstrates how to integrate histograms with total height equal to 1 into a scatter plot, providing marginal distributions for each variable.
Handling Edge Cases When Plotting Histograms with Total Height Equal to 1
When working with real-world data, we often encounter edge cases that require special handling:
Dealing with Outliers
import matplotlib.pyplot as plt
import numpy as np

# Generate data with outliers
data = np.concatenate([np.random.normal(0, 1, 990), np.random.normal(10, 1, 10)])

fig, (ax1, ax2) = plt.subplots(1, 2, figsize=(12, 5))

# Without outlier handling
ax1.hist(data, bins=30, density=True)
ax1.set_title('Histogram without Outlier Handling - how2matplotlib.com')

# With outlier handling
q1, q3 = np.percentile(data, [25, 75])
iqr = q3 - q1
lower_bound = q1 - (1.5 * iqr)
upper_bound = q3 + (1.5 * iqr)
filtered_data = data[(data >= lower_bound) & (data <= upper_bound)]

ax2.hist(filtered_data, bins=30, density=True)
ax2.set_title('Histogram with Outlier Handling - how2matplotlib.com')

for ax in (ax1, ax2):
    ax.set_xlabel('Value')
    ax.set_ylabel('Density')

plt.tight_layout()
plt.show()
Output:
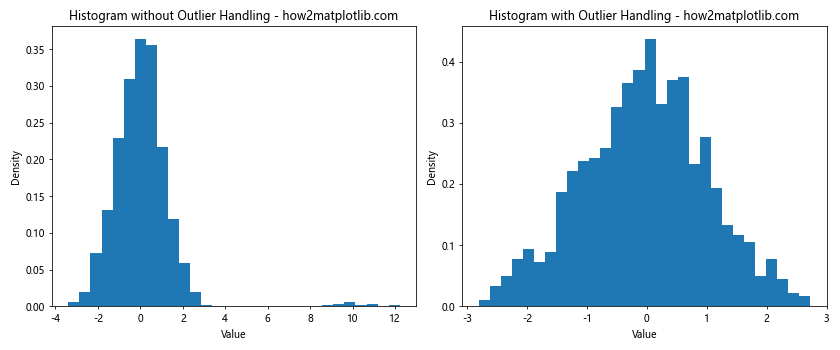
This example shows how to handle outliers when plotting a histogram with total height equal to 1.
Handling Zero-Inflated Data
import matplotlib.pyplot as plt
import numpy as np

# Generate zero-inflated data
zero_inflated_data = np.concatenate([np.zeros(500), np.random.exponential(2, 500)])

fig, (ax1, ax2) = plt.subplots(1, 2, figsize=(12, 5))

# Regular histogram
ax1.hist(zero_inflated_data, bins=30, density=True)
ax1.set_title('Regular Histogram - how2matplotlib.com')

# Log-scale histogram
ax2.hist(zero_inflated_data[zero_inflated_data > 0], bins=30, density=True)
ax2.set_xscale('log')
ax2.set_title('Log-scale Histogram (excluding zeros) - how2matplotlib.com')

for ax in (ax1, ax2):
    ax.set_xlabel('Value')
    ax.set_ylabel('Density')

plt.tight_layout()
plt.show()
Output:
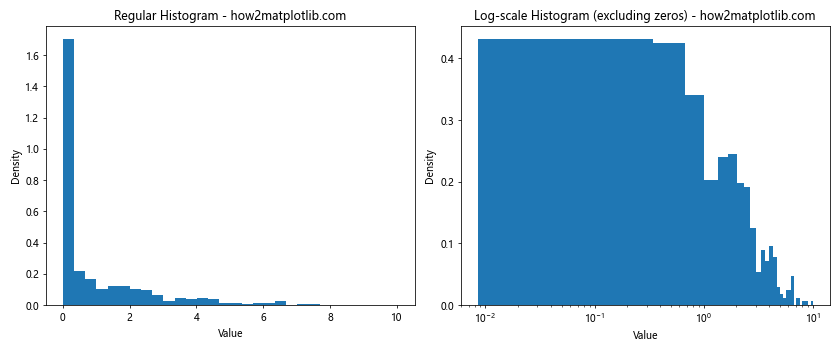
This example demonstrates how to handle zero-inflated data when plotting histograms with total height equal to 1.
Conclusion
Plotting a histogram with total height equal to 1 is a powerful technique for visualizing and comparing distributions. Throughout this article, we've explored various aspects of creating such histograms using Matplotlib, including basic concepts, advanced techniques, best practices, and handling of edge cases.
Key takeaways include:
- The importance of normalization for comparing distributions
- Various methods for creating histograms with total height equal to 1
- Customization options for enhancing visualizations
- Best practices for clear and informative histograms
- Handling of common pitfalls and edge cases
By mastering the techniques presented in this article, you'll be well-equipped to create effective and informative histograms with total height equal to 1 for your data analysis and visualization needs.
Remember to always consider the nature of your data and the story you want to tell when choosing how to plot your histograms. With the flexibility and power of Matplotlib, you can create histograms that not only accurately represent your data but also effectively communicate your insights.