How to Create Stunning Bar Graphs in Matplotlib from Pandas Series
Plotting Bar Graph in Matplotlib from a Pandas Series is a powerful way to visualize data in Python. This comprehensive guide will walk you through the process of creating beautiful and informative bar graphs using Matplotlib and Pandas. We’ll explore various techniques, customization options, and best practices for plotting bar graphs from Pandas Series data.
Introduction to Plotting Bar Graph in Matplotlib from a Pandas Series
Plotting Bar Graph in Matplotlib from a Pandas Series is a common task in data visualization. It allows you to represent categorical data in a visually appealing and easy-to-understand format. By combining the power of Pandas for data manipulation and Matplotlib for visualization, you can create stunning bar graphs that effectively communicate your data insights.
Let’s start with a simple example of Plotting Bar Graph in Matplotlib from a Pandas Series:
import pandas as pd
import matplotlib.pyplot as plt

# Create a Pandas Series
data = pd.Series({'Apple': 30, 'Banana': 25, 'Orange': 20, 'Mango': 15})

# Create a bar graph
plt.figure(figsize=(10, 6))
data.plot(kind='bar')
plt.title('Fruit Sales - how2matplotlib.com')
plt.xlabel('Fruit')
plt.ylabel('Sales')
plt.show()
Output:
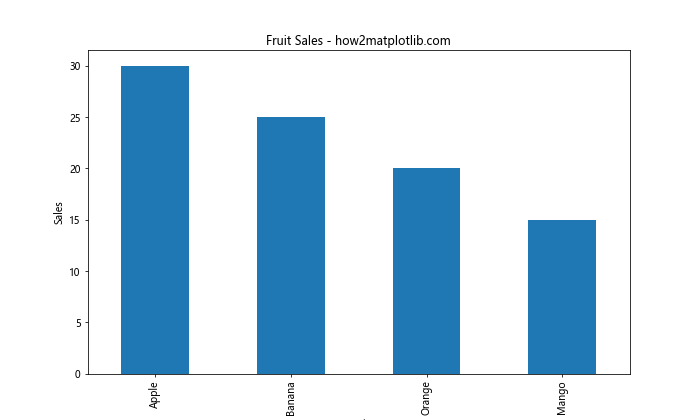
In this example, we create a Pandas Series with fruit sales data and use the plot() method to create a bar graph. The kind='bar' parameter specifies that we want to create a bar graph.
Understanding the Basics of Plotting Bar Graph in Matplotlib from a Pandas Series
When Plotting Bar Graph in Matplotlib from a Pandas Series, it’s essential to understand the basic components:
- Data: The Pandas Series containing the data to be plotted
- X-axis: The categories or labels for each bar
- Y-axis: The values represented by the height of each bar
- Bar width: The width of each bar in the graph
- Colors: The colors used for the bars
Let’s explore these components with another example:
import pandas as pd
import matplotlib.pyplot as plt

# Create a Pandas Series
data = pd.Series({'Red': 10, 'Blue': 20, 'Green': 15, 'Yellow': 25, 'Purple': 30})

# Create a bar graph with custom colors
plt.figure(figsize=(12, 6))
data.plot(kind='bar', color=['red', 'blue', 'green', 'yellow', 'purple'])
plt.title('Color Popularity - how2matplotlib.com')
plt.xlabel('Colors')
plt.ylabel('Popularity Score')
plt.xticks(rotation=0)
plt.show()
Output:
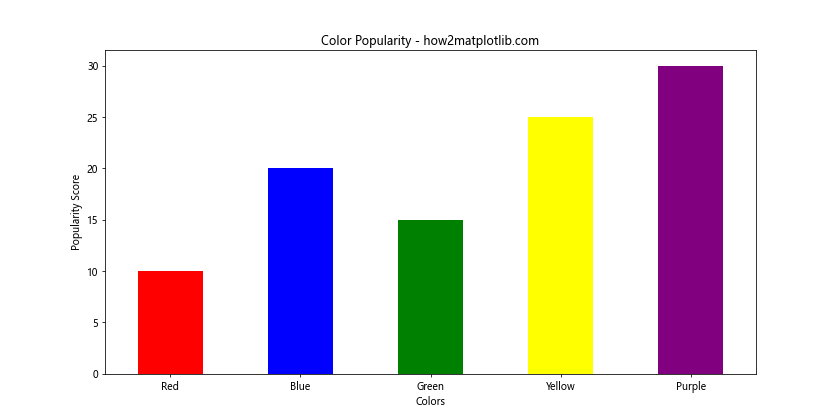
In this example, we customize the colors of the bars to match the color names in our data. We also set rotation=0 for the x-axis labels to make them horizontal.
Customizing Bar Graphs when Plotting Bar Graph in Matplotlib from a Pandas Series
Customization is key when Plotting Bar Graph in Matplotlib from a Pandas Series. You can adjust various aspects of your graph to make it more visually appealing and informative. Let’s explore some customization options:
Adjusting Bar Width
import pandas as pd
import matplotlib.pyplot as plt

data = pd.Series({'A': 10, 'B': 20, 'C': 15, 'D': 25, 'E': 30})

plt.figure(figsize=(10, 6))
data.plot(kind='bar', width=0.5)  # Adjust bar width
plt.title('Bar Width Example - how2matplotlib.com')
plt.xlabel('Categories')
plt.ylabel('Values')
plt.show()
Output:
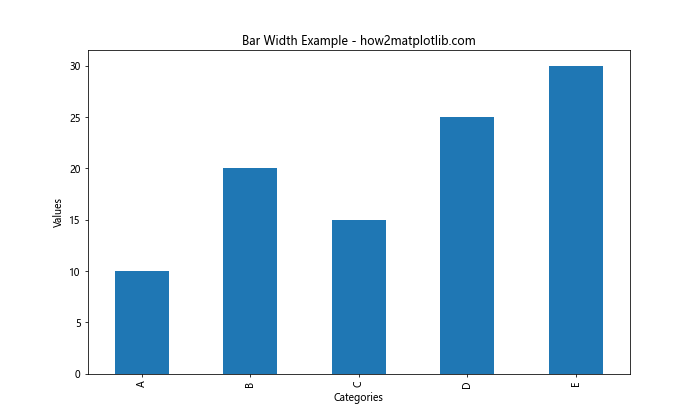
In this example, we set the width parameter to 0.5 to make the bars narrower.
Adding Error Bars
Error bars can be added to your bar graph to show the uncertainty or variability in your data:
import pandas as pd
import matplotlib.pyplot as plt
import numpy as np

data = pd.Series({'A': 10, 'B': 20, 'C': 15, 'D': 25, 'E': 30})
errors = pd.Series({'A': 1, 'B': 2, 'C': 1.5, 'D': 2.5, 'E': 3})

plt.figure(figsize=(10, 6))
data.plot(kind='bar', yerr=errors, capsize=5)
plt.title('Bar Graph with Error Bars - how2matplotlib.com')
plt.xlabel('Categories')
plt.ylabel('Values')
plt.show()
Output:
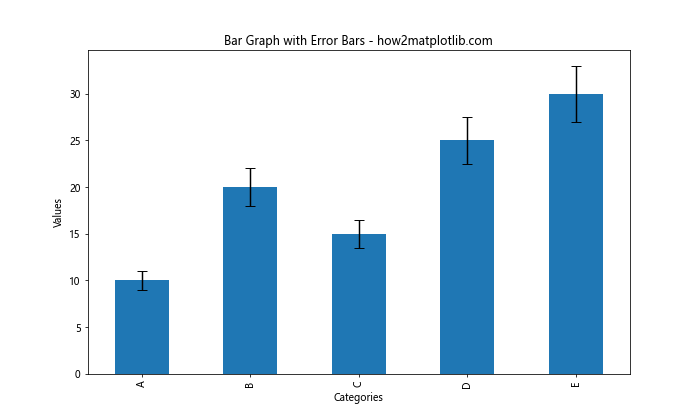
Here, we use the yerr parameter to specify the error values for each bar, and capsize to set the width of the error bar caps.
Advanced Techniques for Plotting Bar Graph in Matplotlib from a Pandas Series
As you become more comfortable with Plotting Bar Graph in Matplotlib from a Pandas Series, you can explore more advanced techniques to create even more impressive visualizations.
Stacked Bar Graphs
Stacked bar graphs are useful for showing the composition of each category:
import pandas as pd
import matplotlib.pyplot as plt

data = pd.DataFrame({
    'Category': ['A', 'B', 'C', 'D'],
    'Value1': [10, 20, 15, 25],
    'Value2': [5, 10, 8, 12],
    'Value3': [8, 12, 10, 15]
})
data.set_index('Category', inplace=True)

plt.figure(figsize=(10, 6))
data.plot(kind='bar', stacked=True)
plt.title('Stacked Bar Graph - how2matplotlib.com')
plt.xlabel('Categories')
plt.ylabel('Values')
plt.legend(title='Components')
plt.show()
Output:
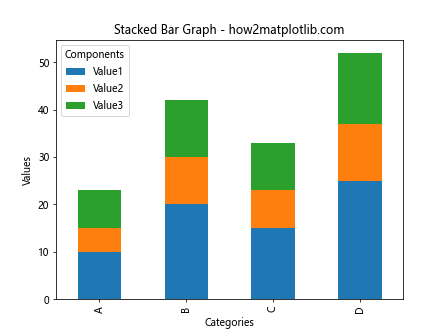
In this example, we create a stacked bar graph by setting stacked=True in the plot() method.
Grouped Bar Graphs
Grouped bar graphs allow you to compare multiple categories side by side:
import pandas as pd
import matplotlib.pyplot as plt
import numpy as np

data = pd.DataFrame({
    'Group': ['A', 'B', 'C', 'D'],
    '2020': [10, 20, 15, 25],
    '2021': [12, 22, 18, 28],
    '2022': [15, 25, 20, 30]
})
data.set_index('Group', inplace=True)

x = np.arange(len(data.index))
width = 0.25

fig, ax = plt.subplots(figsize=(12, 6))
ax.bar(x - width, data['2020'], width, label='2020')
ax.bar(x, data['2021'], width, label='2021')
ax.bar(x + width, data['2022'], width, label='2022')

ax.set_title('Grouped Bar Graph - how2matplotlib.com')
ax.set_xlabel('Groups')
ax.set_ylabel('Values')
ax.set_xticks(x)
ax.set_xticklabels(data.index)
ax.legend()

plt.show()
Output:
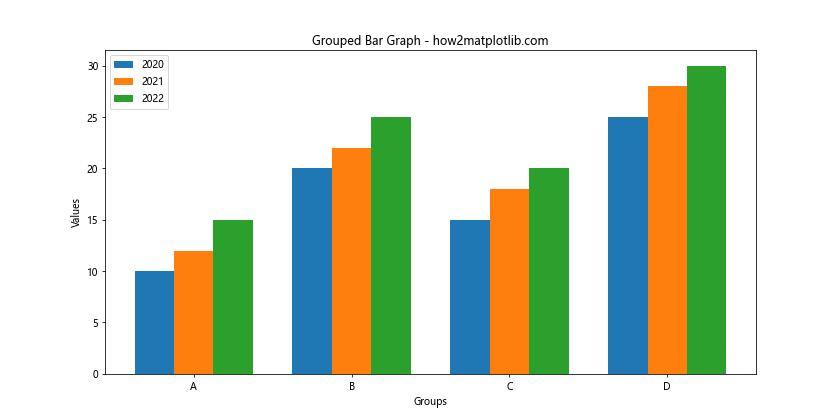
This example demonstrates how to create a grouped bar graph by manually positioning each set of bars.
Enhancing Aesthetics when Plotting Bar Graph in Matplotlib from a Pandas Series
Aesthetics play a crucial role in making your bar graphs more appealing and easier to understand. Let’s explore some techniques to enhance the visual appeal of your graphs.
Using Custom Color Palettes
import pandas as pd
import matplotlib.pyplot as plt
import seaborn as sns

data = pd.Series({'A': 10, 'B': 20, 'C': 15, 'D': 25, 'E': 30})

plt.figure(figsize=(10, 6))
sns.set_palette("husl")
data.plot(kind='bar')
plt.title('Custom Color Palette - how2matplotlib.com')
plt.xlabel('Categories')
plt.ylabel('Values')
plt.show()
Output:
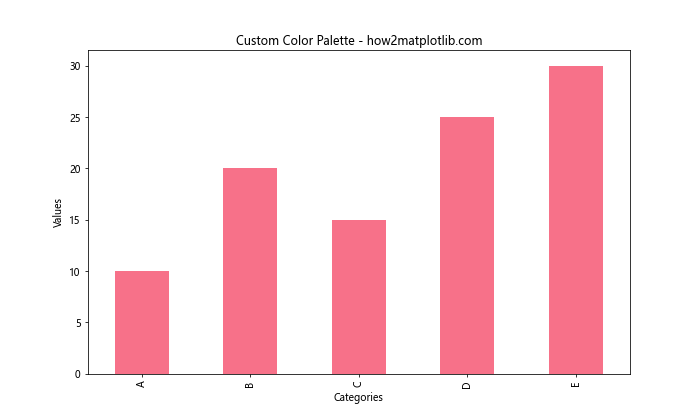
In this example, we use Seaborn’s set_palette() function to apply a custom color palette to our bar graph.
Adding Data Labels
Adding data labels to your bars can make it easier for viewers to read exact values:
import pandas as pd
import matplotlib.pyplot as plt

data = pd.Series({'A': 10, 'B': 20, 'C': 15, 'D': 25, 'E': 30})

fig, ax = plt.subplots(figsize=(10, 6))
bars = ax.bar(data.index, data.values)
ax.set_title('Bar Graph with Data Labels - how2matplotlib.com')
ax.set_xlabel('Categories')
ax.set_ylabel('Values')

for bar in bars:
    height = bar.get_height()
    ax.text(bar.get_x() + bar.get_width()/2., height,
            f'{height}',
            ha='center', va='bottom')

plt.show()
Output:
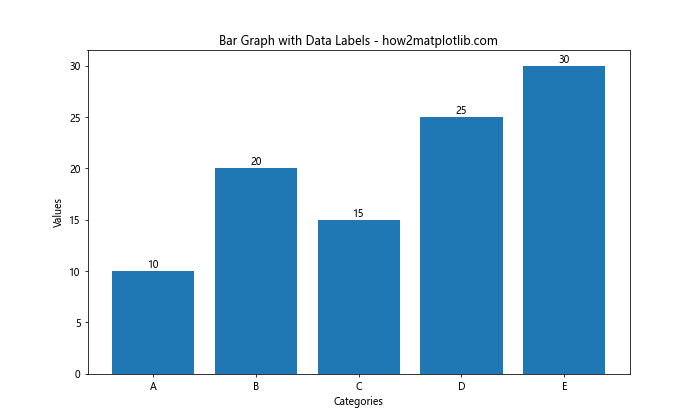
This example demonstrates how to add data labels above each bar in the graph.
Handling Large Datasets when Plotting Bar Graph in Matplotlib from a Pandas Series
When Plotting Bar Graph in Matplotlib from a Pandas Series with large datasets, you may need to employ different strategies to ensure your graph remains readable and informative.
Horizontal Bar Graphs
For datasets with many categories, horizontal bar graphs can be more readable:
import pandas as pd
import matplotlib.pyplot as plt

data = pd.Series({f'Category {i}': i*10 for i in range(1, 21)})

plt.figure(figsize=(10, 12))
data.sort_values(ascending=True).plot(kind='barh')
plt.title('Horizontal Bar Graph - how2matplotlib.com')
plt.xlabel('Values')
plt.ylabel('Categories')
plt.show()
Output:
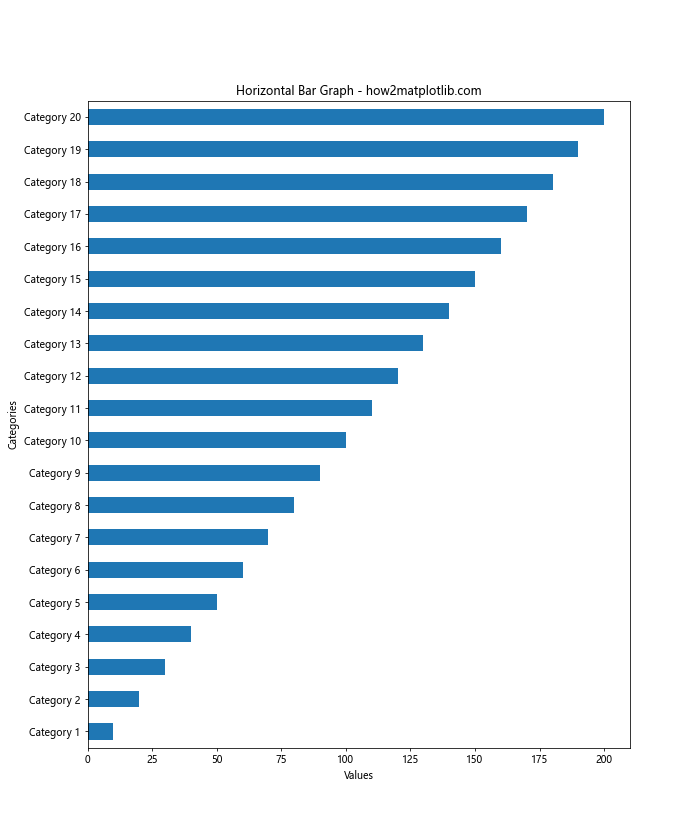
This example creates a horizontal bar graph with 20 categories, sorted in ascending order.
Aggregating Data
When dealing with large datasets, it can be helpful to aggregate the data before plotting:
import pandas as pd
import matplotlib.pyplot as plt
import numpy as np

# Generate a large dataset
np.random.seed(42)
data = pd.Series(np.random.randint(1, 100, 1000), index=[f'Item {i}' for i in range(1, 1001)])

# Aggregate data into bins
binned_data = pd.cut(data, bins=10).value_counts().sort_index()

plt.figure(figsize=(12, 6))
binned_data.plot(kind='bar')
plt.title('Aggregated Bar Graph - how2matplotlib.com')
plt.xlabel('Value Ranges')
plt.ylabel('Frequency')
plt.xticks(rotation=45, ha='right')
plt.tight_layout()
plt.show()
Output:
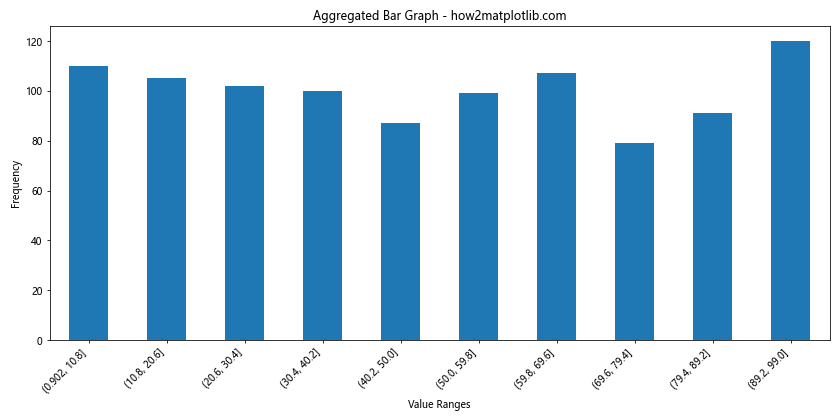
In this example, we aggregate a large dataset into bins and plot the frequency of each bin.
Comparing Multiple Series when Plotting Bar Graph in Matplotlib from a Pandas Series
Often, you may want to compare multiple Pandas Series in a single bar graph. Let’s explore some techniques for doing this effectively.
Side-by-Side Comparison
import pandas as pd
import matplotlib.pyplot as plt

series1 = pd.Series({'A': 10, 'B': 20, 'C': 15, 'D': 25})
series2 = pd.Series({'A': 12, 'B': 18, 'C': 22, 'D': 20})

fig, ax = plt.subplots(figsize=(10, 6))
x = range(len(series1))
width = 0.35

ax.bar([i - width/2 for i in x], series1.values, width, label='Series 1')
ax.bar([i + width/2 for i in x], series2.values, width, label='Series 2')

ax.set_title('Side-by-Side Bar Graph Comparison - how2matplotlib.com')
ax.set_xlabel('Categories')
ax.set_ylabel('Values')
ax.set_xticks(x)
ax.set_xticklabels(series1.index)
ax.legend()

plt.show()
Output:
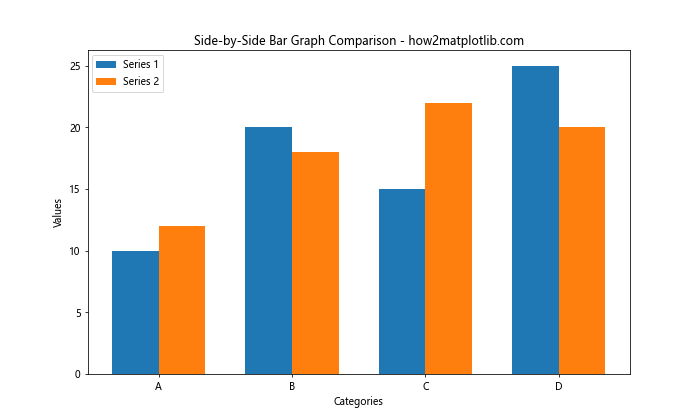
This example demonstrates how to create a side-by-side comparison of two Pandas Series.
Overlapping Bar Graphs
For a different perspective, you can create overlapping bar graphs:
import pandas as pd
import matplotlib.pyplot as plt

series1 = pd.Series({'A': 10, 'B': 20, 'C': 15, 'D': 25})
series2 = pd.Series({'A': 12, 'B': 18, 'C': 22, 'D': 20})

plt.figure(figsize=(10, 6))
series1.plot(kind='bar', alpha=0.5, label='Series 1')
series2.plot(kind='bar', alpha=0.5, label='Series 2')

plt.title('Overlapping Bar Graph Comparison - how2matplotlib.com')
plt.xlabel('Categories')
plt.ylabel('Values')
plt.legend()
plt.show()
Output:
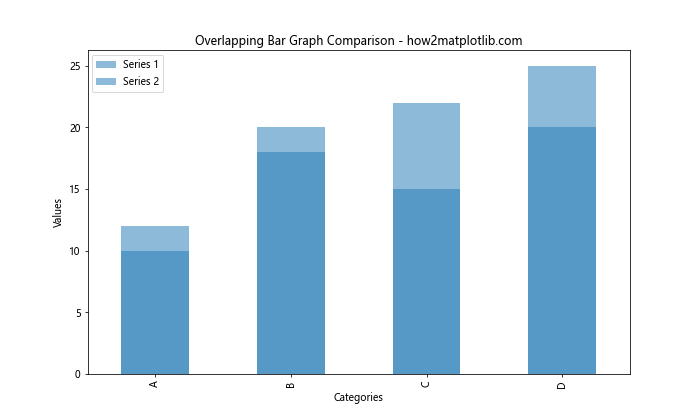
In this example, we use transparency (alpha) to create overlapping bar graphs for easy comparison.
Adding Annotations when Plotting Bar Graph in Matplotlib from a Pandas Series
Annotations can provide additional context and highlight important aspects of your bar graph. Let’s explore some annotation techniques.
Adding Text Annotations
import pandas as pd
import matplotlib.pyplot as plt

data = pd.Series({'A': 10, 'B': 20, 'C': 15, 'D': 25, 'E': 30})

fig, ax = plt.subplots(figsize=(10, 6))
data.plot(kind='bar', ax=ax)

ax.set_title('Bar Graph with Annotations - how2matplotlib.com')
ax.set_xlabel('Categories')
ax.set_ylabel('Values')

ax.annotate('Highest Value', xy=('E', 30), xytext=(4, 35),
            arrowprops=dict(facecolor='black', shrink=0.05))

ax.annotate('Lowest Value', xy=('A', 10), xytext=(-0.5, 15),
            arrowprops=dict(facecolor='black', shrink=0.05))

plt.tight_layout()
plt.show()
This example demonstrates how to add text annotations with arrows to highlight specific bars in your graph.
Adding Reference Lines
Reference lines can help viewers quickly identify important thresholds or averages:
import pandas as pd
import matplotlib.pyplot as plt

data = pd.Series({'A': 10, 'B': 20, 'C': 15, 'D': 25, 'E': 30})

fig, ax = plt.subplots(figsize=(10, 6))
data.plot(kind='bar', ax=ax)

ax.set_title('Bar Graph with Reference Line - how2matplotlib.com')
ax.set_xlabel('Categories')
ax.set_ylabel('Values')

mean_value = data.mean()
ax.axhline(mean_value, color='r', linestyle='--', label=f'Mean ({mean_value:.2f})')

ax.legend()
plt.tight_layout()
plt.show()
Output:
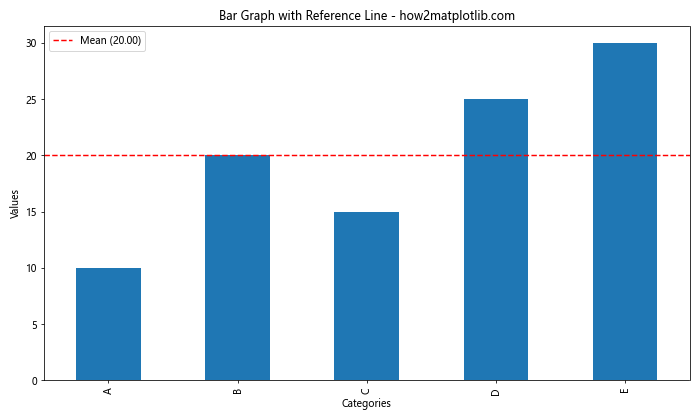
In this example, we add a horizontal reference line to show the mean value of the data.
Best Practices for Plotting Bar Graph in Matplotlib from a Pandas Series
When Plotting Bar Graph in Matplotlib from a Pandas Series, it’s important to follow best practices to ensure your visualizations are effective and easy to understand. Here are some key guidelines:
- Choose the right type of bar graph (vertical, horizontal, stacked, or grouped) based on your data and the message you want to convey.
- Use clear and descriptive titles, labels, and legends.
- Ensure your color choices are accessible and meaningful.
- Avoid cluttering your graph with unnecessary elements.
- Use appropriate scales and axis limits to accurately represent your data.
- Consider using error bars or confidence intervals when applicable.
- Provide context through annotations or reference lines when necessary.
Let’s apply these best practices in an example:
import pandas as pd
import matplotlib.pyplot as plt```python
import pandas as pd
import matplotlib.pyplot as plt
import seaborn as sns

# Create a Pandas Series with sample data
data = pd.Series({
    'Product A': 120,
    'Product B': 250,
    'Product C': 180,
    'Product D': 310,
    'Product E': 220
})

# Set up the plot style
sns.set_style("whitegrid")
plt.figure(figsize=(12, 6))

# Create the bar graph
bars = plt.bar(data.index, data.values, color=sns.color_palette("husl", len(data)))

# Customize the graph
plt.title('Sales Performance by Product - how2matplotlib.com', fontsize=16)
plt.xlabel('Products', fontsize=12)
plt.ylabel('Sales (in thousands)', fontsize=12)
plt.ylim(0, max(data.values) * 1.1)  # Set y-axis limit with some padding

# Add value labels on top of each bar
for bar in bars:
    height = bar.get_height()
    plt.text(bar.get_x() + bar.get_width()/2., height,
             f'${height}k',
             ha='center', va='bottom')

# Add a reference line for the average sales
average_sales = data.mean()
plt.axhline(average_sales, color='red', linestyle='--', label=f'Average Sales (${average_sales:.0f}k)')

# Add annotations
plt.annotate('Top Performer', xy=('Product D', 310), xytext=(3, 320),
             arrowprops=dict(facecolor='black', shrink=0.05))

# Customize tick labels
plt.xticks(rotation=45, ha='right')

# Add legend
plt.legend()

# Adjust layout and display the plot
plt.tight_layout()
plt.show()
This example incorporates several best practices:
- It uses a clear title and labeled axes.
- The colors are visually appealing and distinct.
- Value labels are added to each bar for easy reading.
- A reference line shows the average sales.
- An annotation highlights the top-performing product.
- The y-axis starts at zero to avoid misrepresentation.
- The layout is adjusted for better readability.
Handling Time Series Data when Plotting Bar Graph in Matplotlib from a Pandas Series
When Plotting Bar Graph in Matplotlib from a Pandas Series containing time series data, you may need to employ specific techniques to effectively visualize trends over time.
import pandas as pd
import matplotlib.pyplot as plt
import numpy as np

# Create a time series dataset
dates = pd.date_range(start='2023-01-01', end='2023-12-31', freq='M')
values = np.random.randint(100, 200, size=len(dates))
data = pd.Series(values, index=dates)

# Plot the bar graph
plt.figure(figsize=(14, 6))
data.plot(kind='bar')

plt.title('Monthly Sales in 2023 - how2matplotlib.com', fontsize=16)
plt.xlabel('Month', fontsize=12)
plt.ylabel('Sales', fontsize=12)

# Customize x-axis labels
plt.xticks(range(len(data)), [date.strftime('%b') for date in data.index], rotation=0)

# Add a trend line
trend = np.polyfit(range(len(data)), data.values, 1)
plt.plot(range(len(data)), np.poly1d(trend)(range(len(data))), color='red', linestyle='--', label='Trend')

plt.legend()
plt.tight_layout()
plt.show()
Output:
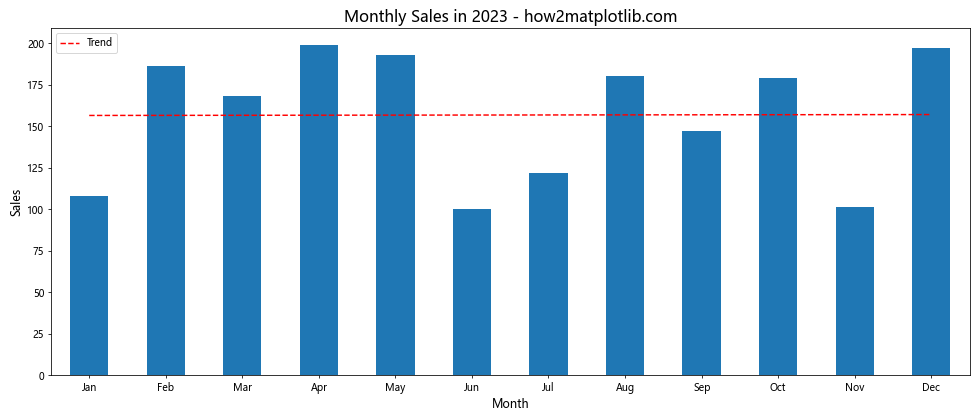
In this example, we create a bar graph from a time series dataset representing monthly sales. We customize the x-axis labels to show month abbreviations and add a trend line to highlight the overall trend in the data.
Creating Interactive Bar Graphs when Plotting Bar Graph in Matplotlib from a Pandas Series
While Matplotlib is primarily used for static visualizations, you can create interactive bar graphs using libraries like Plotly, which can be particularly useful for web-based applications or interactive data exploration.
Here’s an example using Plotly Express:
import pandas as pd
import plotly.express as px

# Create a Pandas Series
data = pd.Series({'A': 10, 'B': 20, 'C': 15, 'D': 25, 'E': 30})

# Create an interactive bar graph
fig = px.bar(x=data.index, y=data.values,
             title='Interactive Bar Graph - how2matplotlib.com',
             labels={'x': 'Categories', 'y': 'Values'})

# Show the plot
fig.show()
This example creates an interactive bar graph that allows users to hover over bars to see exact values, zoom in/out, and pan across the graph.
Combining Bar Graphs with Other Plot Types when Plotting Bar Graph in Matplotlib from a Pandas Series
Sometimes, combining bar graphs with other plot types can provide additional insights into your data. Let’s explore an example that combines a bar graph with a line plot.
import pandas as pd
import matplotlib.pyplot as plt

# Create two Pandas Series
bar_data = pd.Series({'A': 10, 'B': 20, 'C': 15, 'D': 25, 'E': 30})
line_data = pd.Series({'A': 12, 'B': 18, 'C': 22, 'D': 20, 'E': 28})

fig, ax1 = plt.subplots(figsize=(12, 6))

# Plot bar graph
ax1.bar(bar_data.index, bar_data.values, alpha=0.7, label='Bar Data')
ax1.set_xlabel('Categories')
ax1.set_ylabel('Bar Values', color='b')
ax1.tick_params(axis='y', labelcolor='b')

# Create a second y-axis
ax2 = ax1.twinx()

# Plot line graph
ax2.plot(line_data.index, line_data.values, color='r', marker='o', label='Line Data')
ax2.set_ylabel('Line Values', color='r')
ax2.tick_params(axis='y', labelcolor='r')

# Add title and legend
plt.title('Combined Bar and Line Graph - how2matplotlib.com', fontsize=16)
fig.legend(loc='upper right', bbox_to_anchor=(1, 1), bbox_transform=ax1.transAxes)

plt.tight_layout()
plt.show()
Output:
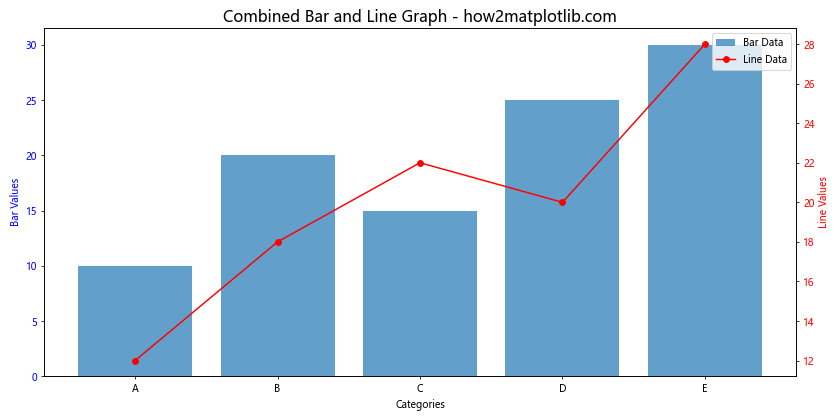
This example demonstrates how to combine a bar graph with a line plot using two y-axes, allowing for the comparison of two different datasets.
Conclusion
Plotting Bar Graph in Matplotlib from a Pandas Series is a powerful technique for visualizing categorical data. Throughout this comprehensive guide, we’ve explored various aspects of creating bar graphs, from basic plotting to advanced customization and best practices.
We’ve covered topics such as:
- Basic bar graph creation
- Customizing colors, widths, and labels
- Adding error bars and annotations
- Creating stacked and grouped bar graphs
- Handling large datasets and time series data
- Combining bar graphs with other plot types
- Creating interactive bar graphs
By mastering these techniques, you’ll be well-equipped to create informative and visually appealing bar graphs that effectively communicate your data insights. Remember to always consider your audience and the story you want to tell with your data when Plotting Bar Graph in Matplotlib from a Pandas Series.