Comprehensive Guide to Using Matplotlib.artist.Artist.remove() in Python for Data Visualization
Matplotlib.artist.Artist.remove() in Python is a powerful method used in the Matplotlib library for removing artists from figures or axes. This function is essential for managing and manipulating graphical elements in data visualizations. In this comprehensive guide, we’ll explore the various aspects of Matplotlib.artist.Artist.remove() in Python, providing detailed explanations and practical examples to help you master this important feature.
Understanding Matplotlib.artist.Artist.remove() in Python
Matplotlib.artist.Artist.remove() in Python is a method that belongs to the Artist class in Matplotlib. The Artist class is the base class for all drawable objects in Matplotlib, including lines, text, and patches. The remove() method is used to remove an artist from its container, which can be either a figure or an axes object.
Let’s start with a simple example to demonstrate how Matplotlib.artist.Artist.remove() in Python works:
import matplotlib.pyplot as plt

# Create a figure and axis
fig, ax = plt.subplots()

# Plot a line
line, = ax.plot([0, 1, 2, 3, 4], [0, 1, 4, 9, 16], label='Quadratic')

# Add a title
title = ax.set_title('How to use Matplotlib.artist.Artist.remove() - how2matplotlib.com')

# Remove the line
line.remove()

plt.show()
Output:
In this example, we create a simple line plot and then use Matplotlib.artist.Artist.remove() in Python to remove the line from the axes. When you run this code, you’ll see an empty plot with only the title.
The Importance of Matplotlib.artist.Artist.remove() in Python
Matplotlib.artist.Artist.remove() in Python plays a crucial role in dynamic visualizations and interactive plots. It allows you to update your plots by removing unwanted elements, which is particularly useful when you need to refresh or modify your visualizations based on user input or changing data.
Here’s an example that demonstrates the importance of Matplotlib.artist.Artist.remove() in Python in an interactive scenario:
import matplotlib.pyplot as plt
import numpy as np

fig, ax = plt.subplots()

x = np.linspace(0, 10, 100)
line, = ax.plot(x, np.sin(x), label='Sine Wave')

ax.set_title('Interactive Plot - how2matplotlib.com')

def update_plot(event):
    if event.key == 'r':
        line.remove()
        ax.plot(x, np.cos(x), label='Cosine Wave')
        ax.legend()
        fig.canvas.draw()

fig.canvas.mpl_connect('key_press_event', update_plot)

plt.show()
Output:
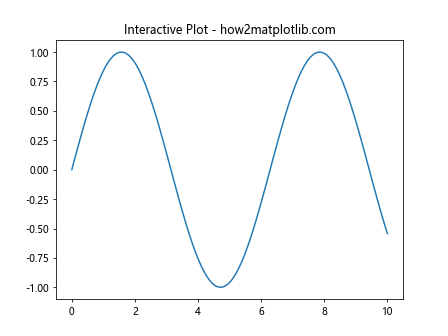
In this interactive example, pressing the ‘r’ key removes the sine wave and replaces it with a cosine wave using Matplotlib.artist.Artist.remove() in Python.
Common Use Cases for Matplotlib.artist.Artist.remove() in Python
Matplotlib.artist.Artist.remove() in Python is commonly used in various scenarios, including:
- Updating plots in real-time
- Removing temporary annotations or highlights
- Implementing undo functionality in interactive plots
- Cleaning up plots before saving or exporting
Let’s explore each of these use cases with examples.
Removing Temporary Annotations or Highlights
Matplotlib.artist.Artist.remove() in Python is also useful for managing temporary visual elements, such as annotations or highlights.
import matplotlib.pyplot as plt
import numpy as np

fig, ax = plt.subplots()

x = np.linspace(0, 10, 100)
y = np.sin(x)

line, = ax.plot(x, y)

highlight = ax.axvspan(3, 5, alpha=0.3, color='red')
annotation = ax.annotate('Temporary Highlight', xy=(4, 0.5), xytext=(6, 0.8),
                         arrowprops=dict(arrowstyle='->'))

plt.title('Temporary Annotations - how2matplotlib.com')
plt.pause(2)

highlight.remove()
annotation.remove()

plt.title('Annotations Removed - how2matplotlib.com')
plt.show()
Output:
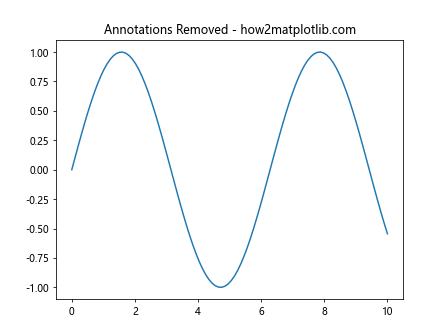
In this example, we use Matplotlib.artist.Artist.remove() in Python to remove temporary highlights and annotations after a brief pause.
Implementing Undo Functionality
Matplotlib.artist.Artist.remove() in Python can be used to implement undo functionality in interactive plots.
import matplotlib.pyplot as plt
import numpy as np

fig, ax = plt.subplots()
ax.set_xlim(0, 10)
ax.set_ylim(0, 10)

points = []

def on_click(event):
    if event.inaxes == ax:
        point, = ax.plot(event.xdata, event.ydata, 'ro')
        points.append(point)
        fig.canvas.draw()

def undo(event):
    if event.key == 'u' and points:
        point = points.pop()
        point.remove()
        fig.canvas.draw()

fig.canvas.mpl_connect('button_press_event', on_click)
fig.canvas.mpl_connect('key_press_event', undo)

plt.title('Undo Functionality - how2matplotlib.com')
plt.show()
Output:
This interactive example allows you to add points by clicking and remove them using the ‘u’ key, demonstrating how Matplotlib.artist.Artist.remove() in Python can be used for undo functionality.
Cleaning Up Plots
Matplotlib.artist.Artist.remove() in Python is useful for cleaning up plots before saving or exporting them.
import matplotlib.pyplot as plt
import numpy as np

fig, ax = plt.subplots()

x = np.linspace(0, 10, 100)
y1 = np.sin(x)
y2 = np.cos(x)

line1, = ax.plot(x, y1, label='Sine')
line2, = ax.plot(x, y2, label='Cosine')

ax.legend()
ax.set_title('Original Plot - how2matplotlib.com')

plt.savefig('original_plot.png')

# Clean up the plot
line2.remove()
ax.legend()
ax.set_title('Cleaned Up Plot - how2matplotlib.com')

plt.savefig('cleaned_up_plot.png')
plt.show()
Output:
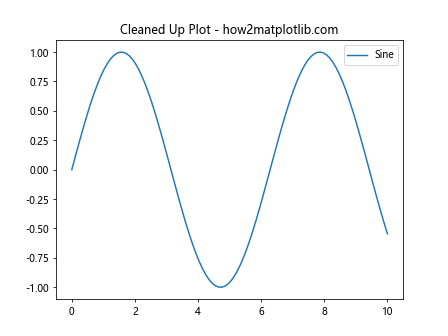
In this example, we use Matplotlib.artist.Artist.remove() in Python to remove one of the lines before saving a cleaned-up version of the plot.
Advanced Techniques with Matplotlib.artist.Artist.remove() in Python
Now that we’ve covered the basics, let’s explore some advanced techniques using Matplotlib.artist.Artist.remove() in Python.
Removing Multiple Artists at Once
While Matplotlib.artist.Artist.remove() in Python operates on a single artist, you can remove multiple artists efficiently by storing them in a list and iterating through it.
import matplotlib.pyplot as plt
import numpy as np

fig, ax = plt.subplots()

x = np.linspace(0, 10, 100)
artists = []

for i in range(5):
    line, = ax.plot(x, np.sin(x + i), label=f'Sine {i}')
    artists.append(line)

ax.legend()
ax.set_title('Multiple Artists - how2matplotlib.com')
plt.pause(2)

for artist in artists[::2]:  # Remove every other artist
    artist.remove()

ax.legend()
ax.set_title('Some Artists Removed - how2matplotlib.com')
plt.show()
Output:
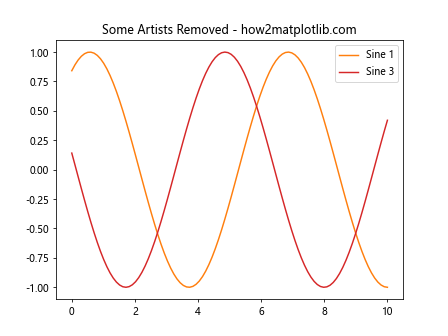
This example demonstrates how to remove multiple artists efficiently using Matplotlib.artist.Artist.remove() in Python.
Conditional Removal of Artists
You can use Matplotlib.artist.Artist.remove() in Python in combination with conditional statements to selectively remove artists based on certain criteria.
import matplotlib.pyplot as plt
import numpy as np

fig, ax = plt.subplots()

x = np.linspace(0, 10, 100)
artists = []

for i in range(5):
    line, = ax.plot(x, np.sin(x + i), label=f'Sine {i}')
    artists.append(line)

ax.legend()
ax.set_title('Before Conditional Removal - how2matplotlib.com')
plt.pause(2)

for artist in artists:
    if 'Sine 2' in artist.get_label() or 'Sine 4' in artist.get_label():
        artist.remove()

ax.legend()
ax.set_title('After Conditional Removal - how2matplotlib.com')
plt.show()
Output:
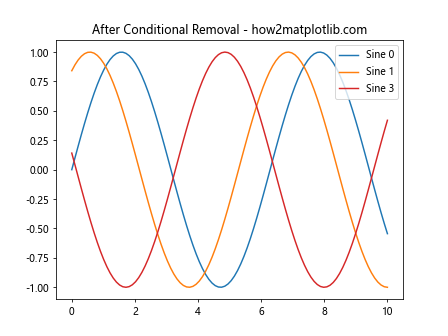
This example shows how to use Matplotlib.artist.Artist.remove() in Python to remove artists based on their labels.
Removing Artists from Subplots
Matplotlib.artist.Artist.remove() in Python can be used effectively with subplots to manage complex visualizations.
import matplotlib.pyplot as plt
import numpy as np

fig, (ax1, ax2) = plt.subplots(1, 2, figsize=(12, 5))

x = np.linspace(0, 10, 100)
line1, = ax1.plot(x, np.sin(x), label='Sine')
line2, = ax1.plot(x, np.cos(x), label='Cosine')
line3, = ax2.plot(x, np.tan(x), label='Tangent')

ax1.legend()
ax2.legend()
fig.suptitle('Subplots - how2matplotlib.com')
plt.pause(2)

line2.remove()
ax1.legend()

line3.remove()
ax2.plot(x, x**2, label='Quadratic')
ax2.legend()

fig.suptitle('Updated Subplots - how2matplotlib.com')
plt.show()
This example demonstrates how to use Matplotlib.artist.Artist.remove() in Python with subplots to update complex visualizations.
Best Practices for Using Matplotlib.artist.Artist.remove() in Python
When working with Matplotlib.artist.Artist.remove() in Python, it’s important to follow some best practices to ensure efficient and error-free code:
- Keep track of artist objects: Store references to artists you might want to remove later.
- Check if an artist exists before removing: Use try-except blocks or conditional checks to avoid errors.
- Update the legend after removal: Remember to update the legend if you’ve removed labeled artists.
- Redraw the canvas: Call
fig.canvas.draw()after removing artists to update the plot.
Let’s see an example that incorporates these best practices:
import matplotlib.pyplot as plt
import numpy as np

fig, ax = plt.subplots()

x = np.linspace(0, 10, 100)
artists = []

for i in range(3):
    line, = ax.plot(x, np.sin(x + i), label=f'Sine {i}')
    artists.append(line)

ax.legend()
ax.set_title('Best Practices - how2matplotlib.com')

def remove_artist(label):
    for artist in artists:
        if artist.get_label() == label:
            try:
                artist.remove()
                artists.remove(artist)
                ax.legend()
                fig.canvas.draw()
                print(f"Removed {label}")
            except ValueError:
                print(f"{label} not found or already removed")
            break
    else:
        print(f"{label} not found")

plt.pause(1)
remove_artist('Sine 1')
plt.pause(1)
remove_artist('Sine 1')  # Try to remove again
plt.pause(1)
remove_artist('Sine 2')

plt.show()
This example demonstrates best practices for using Matplotlib.artist.Artist.remove() in Python, including error handling and canvas updating.
Troubleshooting Common Issues with Matplotlib.artist.Artist.remove() in Python
When working with Matplotlib.artist.Artist.remove() in Python, you may encounter some common issues. Let’s address these and provide solutions:
Issue 1: Artist Not Found
Sometimes, you might try to remove an artist that doesn’t exist or has already been removed.
import matplotlib.pyplot as plt
import numpy as np

fig, ax = plt.subplots()

x = np.linspace(0, 10, 100)
line, = ax.plot(x, np.sin(x), label='Sine')

ax.set_title('Artist Not Found Issue - how2matplotlib.com')

line.remove()  # This works
try:
    line.remove()  # This will raise an exception
except ValueError as e:
    print(f"Error: {e}")

plt.show()
Output:
To avoid this issue, always check if the artist exists before attempting to remove it.
Issue 2: Legend Not Updating
After removing an artist, you might notice that the legend doesn’t update automatically.
import matplotlib.pyplot as plt
import numpy as np

fig, ax = plt.subplots()

x = np.linspace(0, 10, 100)
line1, = ax.plot(x, np.sin(x), label='Sine')
line2, = ax.plot(x, np.cos(x), label='Cosine')

ax.legend()
ax.set_title('Before Removal - how2matplotlib.com')
plt.pause(2)

line1.remove()
ax.set_title('After Removal (Legend Not Updated) - how2matplotlib.com')
plt.pause(2)

ax.legend()  # Manually update the legend
ax.set_title('After Legend Update - how2matplotlib.com')
plt.show()
Always remember to call ax.legend() after removing artists to update the legend.
Issue 3: Changes Not Reflected in the Plot
Sometimes, you might remove an artist but not see the changes reflected in the plot.
import matplotlib.pyplot as plt
import numpy as np

fig, ax = plt.subplots()

x = np.linspace(0, 10, 100)
line, = ax.plot(x, np.sin(x), label='Sine')

ax.set_title('Before Removal - how2matplotlib.com')
plt.pause(2)

line.remove()
ax.set_title('After Removal (Not Reflected) - how2matplotlib.com')
plt.pause(2)

fig.canvas.draw()  # Force a redraw
ax.set_title('After Redraw - how2matplotlib.com')
plt.show()
To solve this, call fig.canvas.draw() after removing artists to force a redraw of the canvas.
Comparing Matplotlib.artist.Artist.remove() with Other Matplotlib Functions
While Matplotlib.artist.Artist.remove() in Python is a powerful tool for managing artists, it’s worth comparing it with other Matplotlib functions that can achieve similar results:
clear() vs. remove()
The clear() method removes all artists from an Axes or Figure, while remove() targets specific artists.
import matplotlib.pyplot as plt
import numpy as np

fig,(ax1, ax2) = plt.subplots(1, 2, figsize=(12, 5))

x = np.linspace(0, 10, 100)
line1, = ax1.plot(x, np.sin(x), label='Sine')
line2, = ax1.plot(x, np.cos(x), label='Cosine')
line3, = ax2.plot(x, np.tan(x), label='Tangent')

ax1.legend()
ax2.legend()
fig.suptitle('Before Removal - how2matplotlib.com')
plt.pause(2)

line2.remove()  # Remove specific artist
ax1.legend()

ax2.clear()  # Clear entire axes

fig.suptitle('After Removal and Clear - how2matplotlib.com')
plt.show()
This example demonstrates the difference between using Matplotlib.artist.Artist.remove() in Python and the clear() method.
set_visible() vs. remove()
The set_visible() method can hide artists without removing them, which can be useful for toggling visibility.
import matplotlib.pyplot as plt
import numpy as np

fig, (ax1, ax2) = plt.subplots(1, 2, figsize=(12, 5))

x = np.linspace(0, 10, 100)
line1, = ax1.plot(x, np.sin(x), label='Sine')
line2, = ax1.plot(x, np.cos(x), label='Cosine')
line3, = ax2.plot(x, np.tan(x), label='Tangent')

ax1.legend()
ax2.legend()
fig.suptitle('Original Plot - how2matplotlib.com')
plt.pause(2)

line2.set_visible(False)  # Hide line2
ax1.legend()

line3.remove()  # Remove line3
ax2.legend()

fig.suptitle('After set_visible() and remove() - how2matplotlib.com')
plt.show()
This example shows the difference between using set_visible() and Matplotlib.artist.Artist.remove() in Python.
Advanced Applications of Matplotlib.artist.Artist.remove() in Python
Let’s explore some advanced applications of Matplotlib.artist.Artist.remove() in Python to showcase its versatility in complex visualization scenarios.
Dynamic Data Visualization
Matplotlib.artist.Artist.remove() in Python can be used to create dynamic visualizations that update based on changing data.
import matplotlib.pyplot as plt
import numpy as np

fig, ax = plt.subplots()
ax.set_xlim(0, 10)
ax.set_ylim(-1, 1)

x = np.linspace(0, 10, 100)
line, = ax.plot(x, np.sin(x))

ax.set_title('Dynamic Data Visualization - how2matplotlib.com')

for i in range(50):
    new_y = np.sin(x + i/10)
    line.remove()
    line, = ax.plot(x, new_y)
    plt.pause(0.1)

plt.show()
This example demonstrates how Matplotlib.artist.Artist.remove() in Python can be used to create a simple animation of a changing sine wave.
Interactive Legend
Matplotlib.artist.Artist.remove() in Python can be used to create an interactive legend that allows users to toggle the visibility of plot elements.
import matplotlib.pyplot as plt
import numpy as np

fig, ax = plt.subplots()

x = np.linspace(0, 10, 100)
lines = [
    ax.plot(x, np.sin(x), label='Sine')[0],
    ax.plot(x, np.cos(x), label='Cosine')[0],
    ax.plot(x, np.tan(x), label='Tangent')[0]
]

ax.set_title('Interactive Legend - how2matplotlib.com')
leg = ax.legend()

def on_pick(event):
    if event.artist in lines:
        line = event.artist
        vis = not line.get_visible()
        line.set_visible(vis)
        if vis:
            leg.get_lines()[lines.index(line)].set_alpha(1.0)
        else:
            leg.get_lines()[lines.index(line)].set_alpha(0.2)
        fig.canvas.draw()

for legline in leg.get_lines():
    legline.set_picker(5)

fig.canvas.mpl_connect('pick_event', on_pick)

plt.show()
Output:
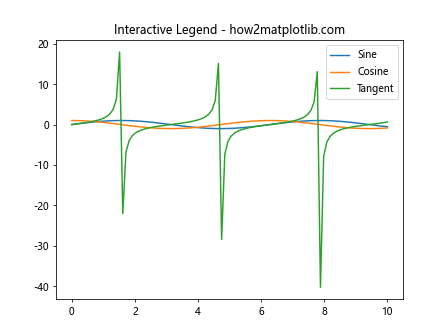
This example uses Matplotlib.artist.Artist.remove() in Python indirectly by toggling visibility to create an interactive legend.
Sliding Window Plot
Matplotlib.artist.Artist.remove() in Python can be used to implement a sliding window plot that shows only the most recent data points.
import matplotlib.pyplot as plt
import numpy as np

fig, ax = plt.subplots()
ax.set_xlim(0, 50)
ax.set_ylim(-1, 1)

x = np.arange(50)
y = np.zeros(50)
line, = ax.plot(x, y)

ax.set_title('Sliding Window Plot - how2matplotlib.com')

for i in range(200):
    new_y = np.roll(y, -1)
    new_y[-1] = np.sin(i * 0.1)

    line.remove()
    line, = ax.plot(x, new_y)

    y = new_y
    plt.pause(0.05)

plt.show()
This example demonstrates how Matplotlib.artist.Artist.remove() in Python can be used to create a sliding window effect in real-time plotting.
Conclusion
Matplotlib.artist.Artist.remove() in Python is a powerful and versatile method that plays a crucial role in creating dynamic and interactive visualizations. Throughout this comprehensive guide, we’ve explored its basic usage, common applications, advanced techniques, and best practices. We’ve also addressed common issues and compared it with other Matplotlib functions.