Comprehensive Guide to Matplotlib.artist.Artist.properties() in Python
Matplotlib.artist.Artist.properties() in Python is a powerful method that allows you to access and manipulate the properties of Artist objects in Matplotlib. This function is an essential tool for customizing and fine-tuning your visualizations. In this comprehensive guide, we’ll explore the ins and outs of Matplotlib.artist.Artist.properties(), providing detailed explanations and practical examples to help you master this important aspect of Matplotlib.
Understanding Matplotlib.artist.Artist.properties()
Matplotlib.artist.Artist.properties() is a method that returns a dictionary of all the properties of an Artist object. These properties control various aspects of the visual appearance and behavior of the artist. By using Matplotlib.artist.Artist.properties(), you can easily access and modify these properties, giving you fine-grained control over your plots.
Let’s start with a simple example to demonstrate how to use Matplotlib.artist.Artist.properties():
import matplotlib.pyplot as plt

fig, ax = plt.subplots()
line, = ax.plot([1, 2, 3, 4], [1, 4, 2, 3], label='how2matplotlib.com')

properties = line.properties()
print(properties)

plt.show()
Output:
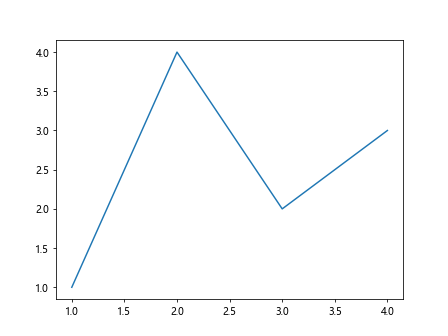
In this example, we create a simple line plot and then use Matplotlib.artist.Artist.properties() to retrieve all the properties of the line object. The result is a dictionary containing key-value pairs for each property.
Exploring Common Properties with Matplotlib.artist.Artist.properties()
Matplotlib.artist.Artist.properties() returns a wide range of properties, depending on the type of artist object. Let’s explore some common properties you might encounter:
Color Properties
Color is a fundamental property that you can access and modify using Matplotlib.artist.Artist.properties(). Here’s an example:
import matplotlib.pyplot as plt

fig, ax = plt.subplots()
line, = ax.plot([1, 2, 3, 4], [1, 4, 2, 3], color='red', label='how2matplotlib.com')

properties = line.properties()
print("Color:", properties['color'])

# Changing the color
line.set_color('blue')
updated_properties = line.properties()
print("Updated Color:", updated_properties['color'])

plt.show()
Output:
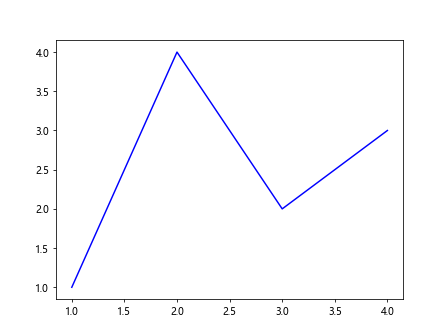
This example demonstrates how to access the color property using Matplotlib.artist.Artist.properties() and how to modify it.
Line Style Properties
Line style is another important property that you can manipulate. Here’s how you can use Matplotlib.artist.Artist.properties() to work with line styles:
import matplotlib.pyplot as plt

fig, ax = plt.subplots()
line, = ax.plot([1, 2, 3, 4], [1, 4, 2, 3], linestyle='--', label='how2matplotlib.com')

properties = line.properties()
print("Line Style:", properties['linestyle'])

# Changing the line style
line.set_linestyle(':')
updated_properties = line.properties()
print("Updated Line Style:", updated_properties['linestyle'])

plt.show()
Output:
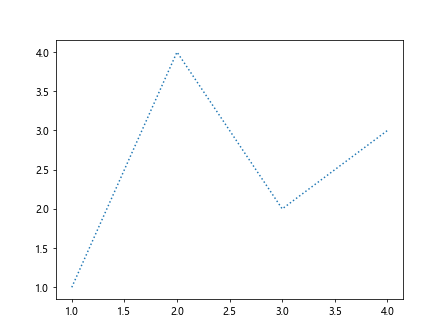
This example shows how to access and modify the line style property using Matplotlib.artist.Artist.properties().
Marker Properties
Markers are often used to highlight data points in plots. Let’s see how Matplotlib.artist.Artist.properties() can be used to work with markers:
import matplotlib.pyplot as plt

fig, ax = plt.subplots()
line, = ax.plot([1, 2, 3, 4], [1, 4, 2, 3], marker='o', label='how2matplotlib.com')

properties = line.properties()
print("Marker:", properties['marker'])

# Changing the marker
line.set_marker('s')
updated_properties = line.properties()
print("Updated Marker:", updated_properties['marker'])

plt.show()
Output:
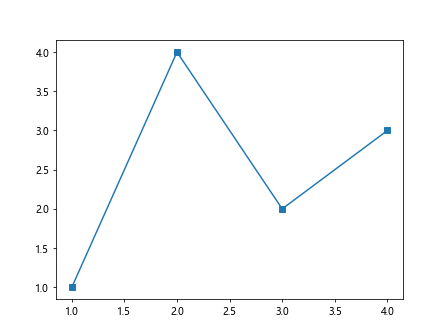
This example demonstrates how to access and change the marker property using Matplotlib.artist.Artist.properties().
Advanced Usage of Matplotlib.artist.Artist.properties()
Now that we’ve covered the basics, let’s dive into some more advanced uses of Matplotlib.artist.Artist.properties().
Working with Multiple Artists
Matplotlib.artist.Artist.properties() can be particularly useful when working with multiple artists. Here’s an example:
import matplotlib.pyplot as plt

fig, ax = plt.subplots()
line1, = ax.plot([1, 2, 3, 4], [1, 4, 2, 3], label='Line 1 - how2matplotlib.com')
line2, = ax.plot([1, 2, 3, 4], [3, 2, 4, 1], label='Line 2 - how2matplotlib.com')

properties1 = line1.properties()
properties2 = line2.properties()

print("Line 1 Color:", properties1['color'])
print("Line 2 Color:", properties2['color'])

# Changing colors
line1.set_color('red')
line2.set_color('blue')

updated_properties1 = line1.properties()
updated_properties2 = line2.properties()

print("Updated Line 1 Color:", updated_properties1['color'])
print("Updated Line 2 Color:", updated_properties2['color'])

plt.legend()
plt.show()
Output:
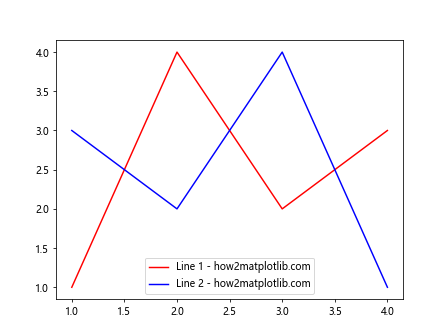
This example shows how to use Matplotlib.artist.Artist.properties() to work with multiple line objects, accessing and modifying their properties independently.
Customizing Text Properties
Text objects in Matplotlib are also artists, and their properties can be accessed and modified using Matplotlib.artist.Artist.properties(). Here’s an example:
import matplotlib.pyplot as plt

fig, ax = plt.subplots()
text = ax.text(0.5, 0.5, 'how2matplotlib.com', fontsize=12, ha='center', va='center')

properties = text.properties()
print("Font Size:", properties['fontsize'])
print("Horizontal Alignment:", properties['horizontalalignment'])

# Changing text properties
text.set_fontsize(16)
text.set_color('red')

updated_properties = text.properties()
print("Updated Font Size:", updated_properties['fontsize'])
print("Updated Color:", updated_properties['color'])

plt.show()
Output:
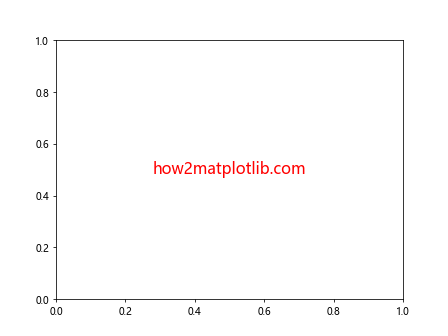
This example demonstrates how to use Matplotlib.artist.Artist.properties() to access and modify text properties.
Working with Patch Properties
Patches are another type of artist in Matplotlib, and their properties can be manipulated using Matplotlib.artist.Artist.properties(). Here’s an example with a Rectangle patch:
import matplotlib.pyplot as plt
from matplotlib.patches import Rectangle

fig, ax = plt.subplots()
rect = Rectangle((0.2, 0.2), 0.6, 0.6, facecolor='blue', edgecolor='red', alpha=0.5)
ax.add_patch(rect)

properties = rect.properties()
print("Face Color:", properties['facecolor'])
print("Edge Color:", properties['edgecolor'])
print("Alpha:", properties['alpha'])

# Changing patch properties
rect.set_facecolor('green')
rect.set_alpha(0.8)

updated_properties = rect.properties()
print("Updated Face Color:", updated_properties['facecolor'])
print("Updated Alpha:", updated_properties['alpha'])

ax.set_xlim(0, 1)
ax.set_ylim(0, 1)
ax.set_title('Rectangle - how2matplotlib.com')
plt.show()
Output:
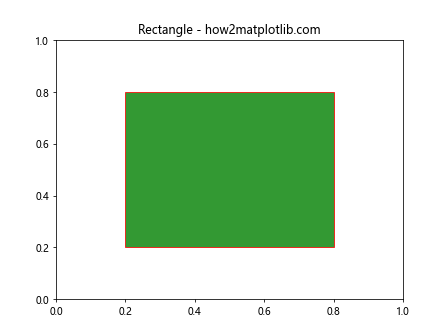
This example shows how to use Matplotlib.artist.Artist.properties() to work with patch properties, specifically for a Rectangle object.
Practical Applications of Matplotlib.artist.Artist.properties()
Now that we’ve covered various aspects of Matplotlib.artist.Artist.properties(), let’s explore some practical applications of this powerful method.
Creating Dynamic Legends
Matplotlib.artist.Artist.properties() can be useful for creating dynamic legends based on the properties of your artists. Here’s an example:
import matplotlib.pyplot as plt

fig, ax = plt.subplots()

lines = []
for i in range(3):
    line, = ax.plot([1, 2, 3, 4], [i+1, i+4, i+2, i+3], label=f'Line {i+1} - how2matplotlib.com')
    lines.append(line)

legend_labels = []
for line in lines:
    properties = line.properties()
    color = properties['color']
    style = properties['linestyle']
    legend_labels.append(f'Color: {color}, Style: {style}')

ax.legend(lines, legend_labels)
plt.show()
Output:
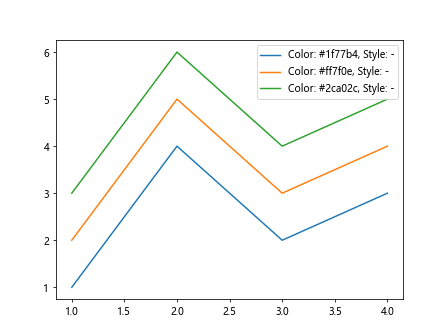
In this example, we use Matplotlib.artist.Artist.properties() to create dynamic legend labels based on the color and line style of each line.
Conditional Formatting
Matplotlib.artist.Artist.properties() can be used to apply conditional formatting to your plots. Here’s an example:
import matplotlib.pyplot as plt
import numpy as np

fig, ax = plt.subplots()

x = np.linspace(0, 10, 100)
y = np.sin(x)

line, = ax.plot(x, y, label='how2matplotlib.com')

properties = line.properties()
if properties['color'] == 'b':  # Default color is blue
    ax.set_facecolor('lightblue')
    ax.set_title('Blue Line on Light Blue Background')
else:
    ax.set_facecolor('lightyellow')
    ax.set_title('Non-Blue Line on Light Yellow Background')

plt.show()
Output:
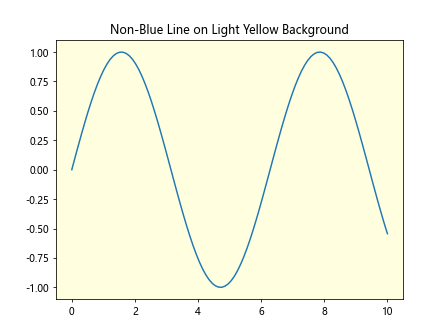
This example demonstrates how to use Matplotlib.artist.Artist.properties() to apply conditional formatting based on the color of the line.
Property-based Animation
Matplotlib.artist.Artist.properties() can be used in animations to create dynamic effects. Here’s a simple example:
import matplotlib.pyplot as plt
import matplotlib.animation as animation
import numpy as np

fig, ax = plt.subplots()
x = np.linspace(0, 2*np.pi, 100)
line, = ax.plot(x, np.sin(x), label='how2matplotlib.com')

def animate(frame):
    properties = line.properties()
    current_color = properties['color']

    if current_color == 'b':
        line.set_color('r')
    else:
        line.set_color('b')

    return line,

ani = animation.FuncAnimation(fig, animate, frames=20, interval=500, blit=True)
plt.show()
Output:
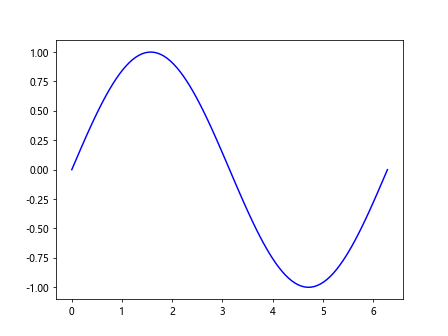
This example creates a simple animation that alternates the color of the line between blue and red using Matplotlib.artist.Artist.properties().
Advanced Techniques with Matplotlib.artist.Artist.properties()
Let’s explore some more advanced techniques using Matplotlib.artist.Artist.properties().
Custom Property Setters
While Matplotlib.artist.Artist.properties() is primarily used for getting properties, you can create custom setters for more complex property modifications:
import matplotlib.pyplot as plt

class CustomLine(plt.Line2D):
    def __init__(self, *args, **kwargs):
        super().__init__(*args, **kwargs)
        self._custom_color = 'black'

    @property
    def custom_color(self):
        return self._custom_color

    @custom_color.setter
    def custom_color(self, value):
        self._custom_color = value
        self.set_color(value)

fig, ax = plt.subplots()
custom_line = CustomLine([0, 1, 2, 3], [0, 1, 0, 1], label='how2matplotlib.com')
ax.add_line(custom_line)

properties = custom_line.properties()
print("Initial Color:", properties['color'])

custom_line.custom_color = 'red'
updated_properties = custom_line.properties()
print("Updated Color:", updated_properties['color'])

plt.show()
Output:
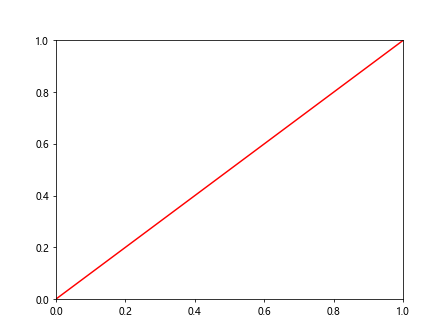
This example demonstrates how to create a custom property setter that updates both a custom attribute and the actual line color.
Property-based Event Handling
Matplotlib.artist.Artist.properties() can be used in event handlers to create interactive plots. Here’s an example:
import matplotlib.pyplot as plt

fig, ax = plt.subplots()
line, = ax.plot([1, 2, 3, 4], [1, 4, 2, 3], label='how2matplotlib.com')

def on_click(event):
    if event.inaxes == ax:
        properties = line.properties()
        current_color = properties['color']

        if current_color == 'b':
            line.set_color('r')
        else:
            line.set_color('b')

        fig.canvas.draw()

fig.canvas.mpl_connect('button_press_event', on_click)
plt.show()
Output:
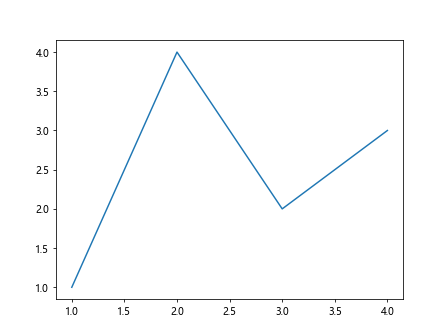
This example uses Matplotlib.artist.Artist.properties() in an event handler to toggle the line color when the plot is clicked.
Bulk Property Updates
Matplotlib.artist.Artist.properties() can be used to perform bulk updates on multiple artists:
import matplotlib.pyplot as plt

fig, ax = plt.subplots()
lines = [ax.plot([1, 2, 3, 4], [i, i+1, i+2, i+3], label=f'Line {i+1} - how2matplotlib.com')[0] for i in range(3)]

def update_properties(artists, **kwargs):
    for artist in artists:
        for key, value in kwargs.items():
            setattr(artist, key, value)

# Get initial properties
for i, line in enumerate(lines):
    properties = line.properties()
    print(f"Line {i+1} initial color:", properties['color'])

# Update properties
update_properties(lines, color='red', linewidth=2, linestyle='--')

# Get updated properties
for i, line in enumerate(lines):
    updated_properties = line.properties()
    print(f"Line {i+1} updated color:", updated_properties['color'])
    print(f"Line {i+1} updated linewidth:", updated_properties['linewidth'])
    print(f"Line {i+1} updated linestyle:", updated_properties['linestyle'])

plt.legend()
plt.show()
Output:
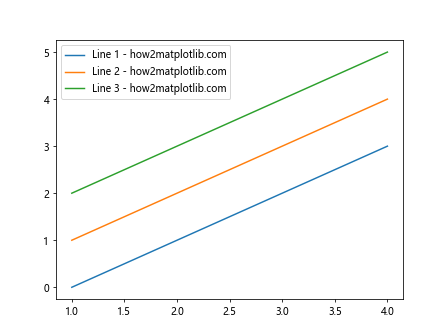
This example demonstrates how to use Matplotlib.artist.Artist.properties() to perform bulk updates on multiple line objects.
Best Practices for Using Matplotlib.artist.Artist.properties()
When working with Matplotlib.artist.Artist.properties(), it’s important to follow some best practices to ensure efficient and maintainable code:
- Cache property access: If you need to access the same property multiple times, consider storing it in a variable to avoid repeated calls to Matplotlib.artist.Artist.properties().
Use specific property getters when possible: For frequently accessed properties, use specific getter methods (e.g., get_color()) instead of Matplotlib.artist.Artist.properties() for better performance.
Be aware of property dependencies: Some properties may affect others. Always check the documentation or test the effects of property changes.
Use property setters for complex changes: When modifying multiple related properties, consider creating custom property setters to ensure consistency.
Handle property absence gracefully: Not all artists have the same properties. Use the dict.get() method or try-except blocks when accessing properties that might not exist.
Here’s an example demonstrating these best practices: