How to Master Matplotlib Linestyle and Arrow: A Comprehensive Guide
Matplotlib linestyle arrow is a powerful combination for creating informative and visually appealing plots in Python. This article will dive deep into the world of Matplotlib, focusing on linestyles and arrows, two essential elements that can significantly enhance your data visualizations. We’ll explore various techniques, customization options, and best practices for using linestyles and arrows in Matplotlib, providing you with the knowledge and skills to create stunning plots that effectively communicate your data.
Understanding Matplotlib Linestyle
Matplotlib linestyle is a crucial aspect of plot customization that allows you to control the appearance of lines in your graphs. By manipulating linestyles, you can differentiate between multiple data series, highlight specific trends, or simply improve the overall aesthetics of your plots.
Basic Linestyle Options
Matplotlib offers several predefined linestyle options that you can easily apply to your plots. These include:
- Solid line (‘-‘)
- Dashed line (‘–‘)
- Dotted line (‘:’)
- Dash-dot line (‘-.’)
Let’s start with a simple example that demonstrates how to use these basic linestyle options:
import matplotlib.pyplot as plt
import numpy as np

x = np.linspace(0, 10, 100)
y1 = np.sin(x)
y2 = np.cos(x)
y3 = np.tan(x)
y4 = np.exp(-x/10)

plt.figure(figsize=(10, 6))
plt.plot(x, y1, linestyle='-', label='Solid')
plt.plot(x, y2, linestyle='--', label='Dashed')
plt.plot(x, y3, linestyle=':', label='Dotted')
plt.plot(x, y4, linestyle='-.', label='Dash-dot')

plt.title('Matplotlib Linestyle Examples - how2matplotlib.com')
plt.xlabel('X-axis')
plt.ylabel('Y-axis')
plt.legend()
plt.grid(True)
plt.show()
Output:
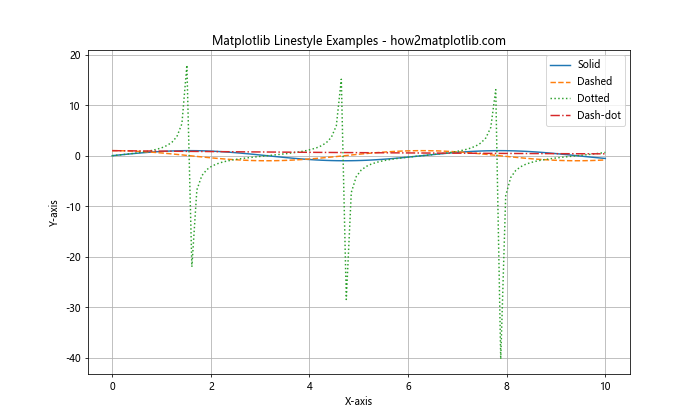
In this example, we create four different plots using various linestyles. The linestyle parameter is used to specify the desired style for each line. This simple modification can greatly enhance the readability of your plots, especially when dealing with multiple data series.
Custom Linestyles
While the predefined linestyle options are useful, Matplotlib also allows you to create custom linestyles for even more flexibility. Custom linestyles are defined using a sequence of numbers that specify the length of line segments and gaps.
Here’s an example of how to create and use custom linestyles:
import matplotlib.pyplot as plt
import numpy as np

x = np.linspace(0, 10, 100)
y1 = np.sin(x)
y2 = np.cos(x)

plt.figure(figsize=(10, 6))
plt.plot(x, y1, linestyle=(0, (5, 5)), label='Custom 1')
plt.plot(x, y2, linestyle=(0, (5, 1, 1, 1)), label='Custom 2')

plt.title('Custom Matplotlib Linestyles - how2matplotlib.com')
plt.xlabel('X-axis')
plt.ylabel('Y-axis')
plt.legend()
plt.grid(True)
plt.show()
Output:
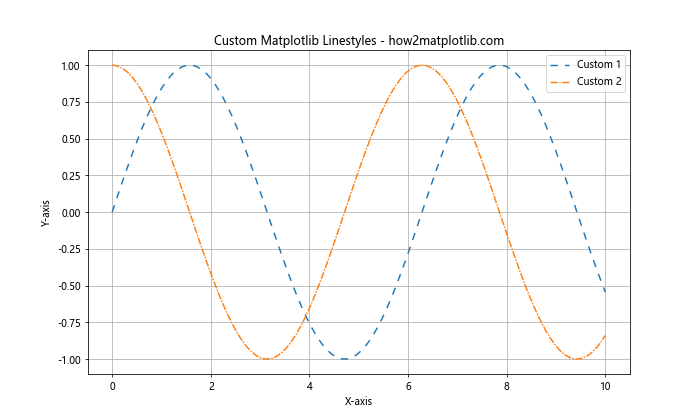
In this example, we define two custom linestyles:
(0, (5, 5)): This creates a dashed line with 5-point line segments and 5-point gaps.(0, (5, 1, 1, 1)): This creates a more complex pattern with 5-point line segments, followed by alternating 1-point lines and gaps.
Custom linestyles allow you to create unique and eye-catching plots that stand out from standard visualizations.
Linestyle with Line Properties
Matplotlib linestyle can be combined with other line properties to further customize the appearance of your plots. Some common properties include:
linewidth: Controls the thickness of the linecolor: Sets the color of the linealpha: Adjusts the transparency of the line
Let’s see how we can combine these properties with linestyles:
import matplotlib.pyplot as plt
import numpy as np

x = np.linspace(0, 10, 100)
y = np.sin(x)

plt.figure(figsize=(10, 6))
plt.plot(x, y, linestyle='--', linewidth=2, color='red', alpha=0.7)

plt.title('Matplotlib Linestyle with Line Properties - how2matplotlib.com')
plt.xlabel('X-axis')
plt.ylabel('Y-axis')
plt.grid(True)
plt.show()
Output:
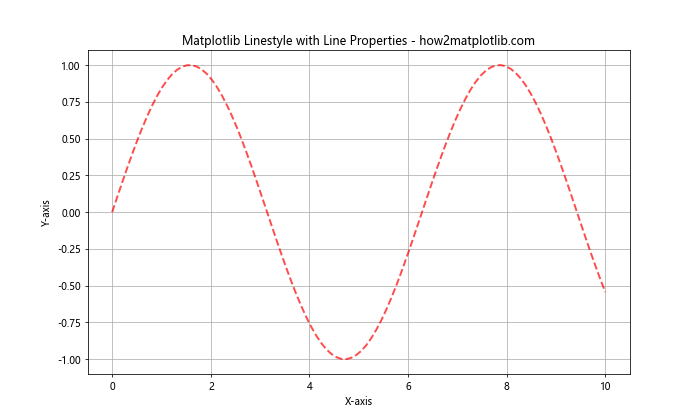
This example demonstrates how to create a dashed red line with increased thickness and slight transparency. By combining these properties, you can create visually striking plots that effectively convey your data.
Mastering Matplotlib Arrow
Matplotlib arrow is another powerful feature that allows you to add directional indicators to your plots. Arrows can be used to highlight specific data points, indicate trends, or annotate important regions of your graph.
Basic Arrow Usage
The simplest way to add an arrow to your plot is by using the plt.arrow() function. This function allows you to specify the starting point, direction, and size of the arrow.
Here’s a basic example of how to add an arrow to your plot:
import matplotlib.pyplot as plt

plt.figure(figsize=(8, 6))
plt.arrow(0, 0, 1, 1, head_width=0.1, head_length=0.1, fc='red', ec='red')

plt.title('Basic Matplotlib Arrow - how2matplotlib.com')
plt.xlabel('X-axis')
plt.ylabel('Y-axis')
plt.xlim(-0.5, 1.5)
plt.ylim(-0.5, 1.5)
plt.grid(True)
plt.show()
Output:
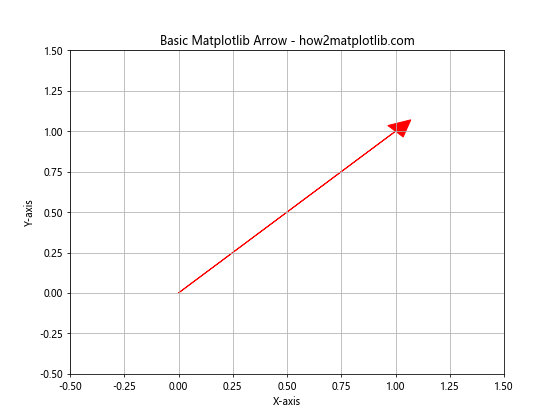
In this example, we create an arrow starting at the origin (0, 0) and pointing towards (1, 1). The head_width and head_length parameters control the size of the arrowhead, while fc and ec set the fill color and edge color, respectively.
Annotating Plots with Arrows
One common use of Matplotlib arrows is to annotate specific points or regions in your plot. This can be particularly useful when you want to draw attention to certain features of your data.
Let’s see how we can use arrows for annotation:
import matplotlib.pyplot as plt
import numpy as np

x = np.linspace(0, 10, 100)
y = np.sin(x)

plt.figure(figsize=(10, 6))
plt.plot(x, y)

plt.annotate('Maximum', xy=(np.pi/2, 1), xytext=(np.pi/2 + 1, 1.2),
             arrowprops=dict(facecolor='black', shrink=0.05))

plt.title('Matplotlib Arrow Annotation - how2matplotlib.com')
plt.xlabel('X-axis')
plt.ylabel('Y-axis')
plt.grid(True)
plt.show()
Output:
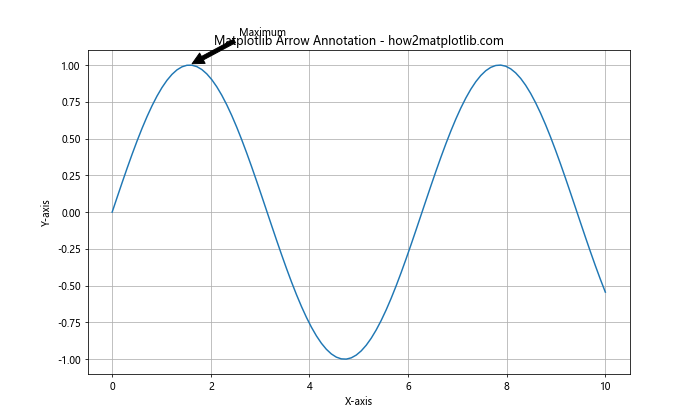
In this example, we use plt.annotate() to add an arrow pointing to the maximum point of the sine wave. The xy parameter specifies the point to annotate, while xytext determines the position of the annotation text. The arrowprops dictionary allows us to customize the appearance of the arrow.
Customizing Arrow Appearance
Matplotlib provides various options to customize the appearance of arrows. You can adjust properties such as:
- Arrow style
- Line width
- Color
- Transparency
Here’s an example that demonstrates some of these customization options:
import matplotlib.pyplot as plt

plt.figure(figsize=(10, 6))

plt.arrow(0, 0, 1, 1, width=0.02, head_width=0.1, head_length=0.1,
          fc='blue', ec='blue', alpha=0.7)
plt.arrow(0, 0, -1, 1, width=0.02, head_width=0.1, head_length=0.1,
          fc='red', ec='red', alpha=0.7)

plt.title('Customized Matplotlib Arrows - how2matplotlib.com')
plt.xlabel('X-axis')
plt.ylabel('Y-axis')
plt.xlim(-1.5, 1.5)
plt.ylim(-0.5, 1.5)
plt.grid(True)
plt.show()
Output:
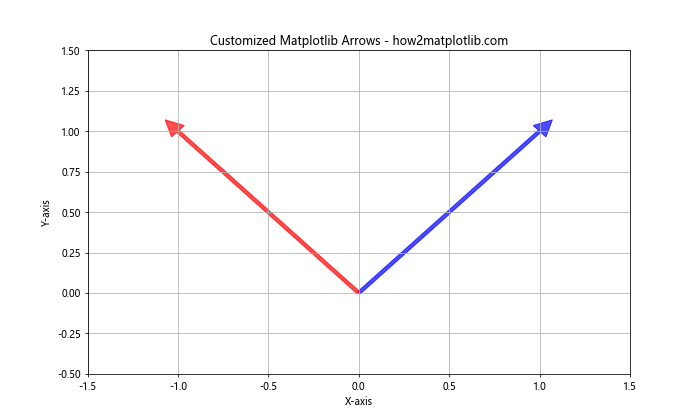
This example creates two arrows with different colors, directions, and transparency levels. By adjusting these properties, you can create arrows that perfectly match the style of your plot and effectively highlight important information.
Combining Matplotlib Linestyle and Arrow
Now that we’ve explored Matplotlib linestyle and arrow separately, let’s see how we can combine these features to create even more informative and visually appealing plots.
Using Arrows to Highlight Trends
One effective way to combine linestyles and arrows is to use arrows to highlight trends or patterns in your data. Here’s an example that demonstrates this technique:
import matplotlib.pyplot as plt
import numpy as np

x = np.linspace(0, 10, 100)
y = np.exp(-x/5) * np.sin(x)

plt.figure(figsize=(10, 6))
plt.plot(x, y, linestyle='--', color='blue')

plt.arrow(2, 0.5, 2, -0.3, head_width=0.1, head_length=0.1, fc='red', ec='red')
plt.arrow(6, -0.3, 2, 0.2, head_width=0.1, head_length=0.1, fc='green', ec='green')

plt.title('Matplotlib Linestyle and Arrow Combination - how2matplotlib.com')
plt.xlabel('X-axis')
plt.ylabel('Y-axis')
plt.grid(True)
plt.show()
Output:
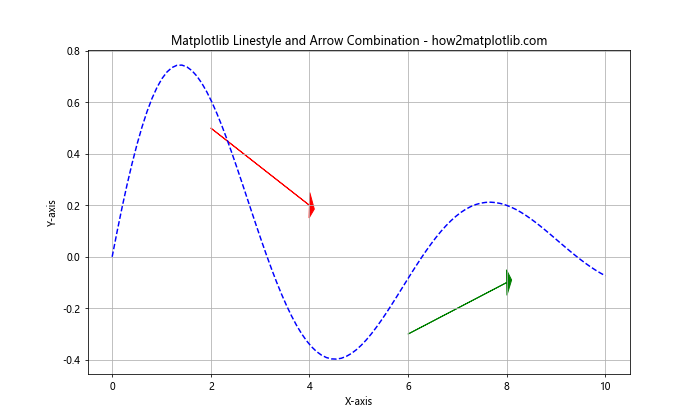
In this example, we plot a damped sine wave using a dashed blue line. We then add two arrows to highlight the decreasing and increasing trends in different parts of the curve. This combination of linestyle and arrows effectively communicates both the overall pattern and specific trends within the data.
Creating Custom Legends with Arrows
Another interesting application of combining Matplotlib linestyle and arrow is to create custom legends that use arrows to represent different data series or categories. Here’s an example:
import matplotlib.pyplot as plt
import numpy as np

x = np.linspace(0, 10, 100)
y1 = np.sin(x)
y2 = np.cos(x)

plt.figure(figsize=(10, 6))
plt.plot(x, y1, linestyle='-', color='blue')
plt.plot(x, y2, linestyle='--', color='red')

# Custom legend with arrows
plt.arrow(8, 0.8, 0.5, 0, head_width=0.05, head_length=0.1, fc='blue', ec='blue')
plt.text(8.7, 0.8, 'Sin(x)', va='center')
plt.arrow(8, 0.6, 0.5, 0, head_width=0.05, head_length=0.1, fc='red', ec='red', linestyle='--')
plt.text(8.7, 0.6, 'Cos(x)', va='center')

plt.title('Custom Legend with Matplotlib Linestyle and Arrow - how2matplotlib.com')
plt.xlabel('X-axis')
plt.ylabel('Y-axis')
plt.grid(True)
plt.show()
Output:
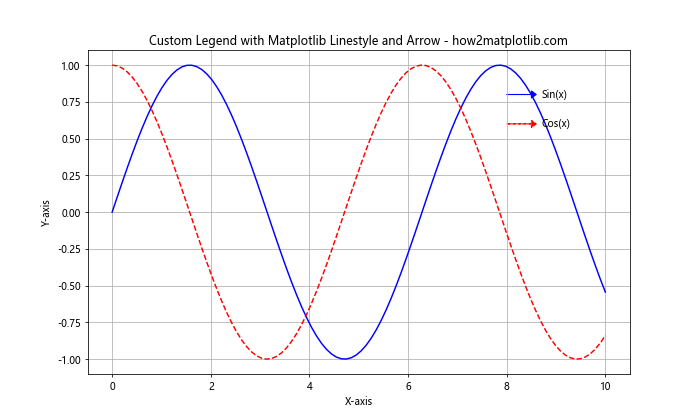
In this example, we create a custom legend using arrows and text annotations. The arrows are styled to match the corresponding plot lines, providing a visually consistent and informative legend.
Advanced Techniques with Matplotlib Linestyle and Arrow
As you become more comfortable with Matplotlib linestyle and arrow, you can explore more advanced techniques to create sophisticated and informative visualizations.
Animated Arrows
One interesting application is to create animated arrows that change over time. This can be particularly useful for visualizing dynamic processes or time-series data.
Here’s an example of how to create a simple animation with moving arrows:
import matplotlib.pyplot as plt
import numpy as np
from matplotlib.animation import FuncAnimation

fig, ax = plt.subplots(figsize=(10, 6))
ax.set_xlim(0, 10)
ax.set_ylim(-1, 1)

line, = ax.plot([], [], linestyle='--', color='blue')
arrow = ax.arrow(0, 0, 0, 0, head_width=0.1, head_length=0.1, fc='red', ec='red')

def init():
    line.set_data([], [])
    return line,

def animate(i):
    x = np.linspace(0, 10, 1000)
    y = np.sin(x - 0.1 * i)
    line.set_data(x, y)
    arrow.set_data(x=i % 10, y=np.sin(i % 10 - 0.1 * i), dx=0.5, dy=0.5)
    return line, arrow

anim = FuncAnimation(fig, animate, init_func=init, frames=200, interval=50, blit=True)

plt.title('Animated Matplotlib Linestyle and Arrow - how2matplotlib.com')
plt.xlabel('X-axis')
plt.ylabel('Y-axis')
plt.grid(True)
plt.show()
Output:
This example creates an animation of a moving sine wave with an arrow that follows the wave’s motion. The FuncAnimation class is used to update the plot and arrow position in each frame.
Gradient Linestyles
Another advanced technique is to create gradient linestyles, where the color or style of the line changes along its length. This can be useful for visualizing continuous changes in data properties.
Here’s an example of how to create a gradient linestyle:
import matplotlib.pyplot as plt
import numpy as np
from matplotlib.collections import LineCollection

x = np.linspace(0, 10, 100)
y = np.sin(x)
z = x

points = np.array([x, y]).T.reshape(-1, 1, 2)
segments = np.concatenate([points[:-1], points[1:]], axis=1)

fig, ax = plt.subplots(figsize=(10, 6))
norm = plt.Normalize(z.min(), z.max())
lc = LineCollection(segments, cmap='viridis', norm=norm)
lc.set_array(z)
lc.set_linewidth(2)

line = ax.add_collection(lc)
fig.colorbar(line, ax=ax)

ax.set_xlim(x.min(), x.max())
ax.set_ylim(y.min(), y.max())

plt.title('Gradient Matplotlib Linestyle - how2matplotlib.com')
plt.xlabel('X-axis')
plt.ylabel('Y-axis')
plt.grid(True)
plt.show()
Output:
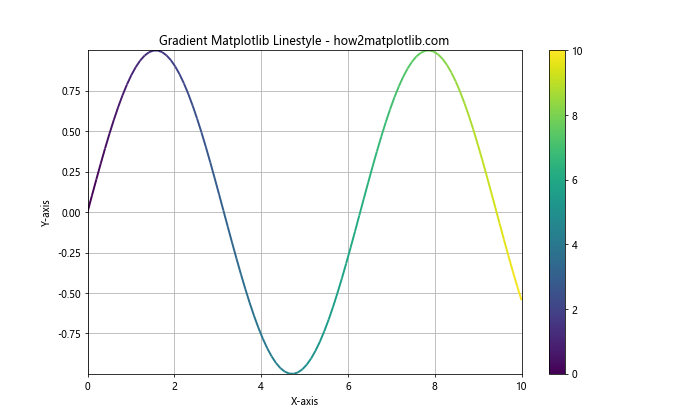
In this example, we create a sine wave where the color of the line changes based on the x-coordinate. The LineCollection class is used to create segments of the line with different colors, resulting in a smooth gradient effect.
Best Practices for Using Matplotlib Linestyle and Arrow
When working with Matplotlib linestyle and arrow, it’s important to follow some best practices to ensure your visualizations are effective and easy to understand:
- Use consistent linestyles: When plotting multiple data series, use consistent linestyles to represent similar types of data or relationships.
Choose appropriate arrow sizes: Make sure your arrows are large enough to be visible but not so large that they obscure important data points.
Use color effectively: Choose colors that contrast well with your background and are easily distinguishable from each other.
Avoid clutter: Don’t overuse arrows or complex linestyles, as this can make your plot difficult to read.
Provide clear labels: Always include clear labels and legends to explain what your linestyles and arrows represent.
Consider accessibility: Choose linestyles and colors that are accessible to colorblind viewers or those with visual impairments.
Here’s an example that demonstrates these best practices: