How to Master Matplotlib Linestyle and Contour Plots: A Comprehensive Guide
Matplotlib linestyle and contour plots are essential tools for data visualization in Python. This comprehensive guide will explore the various aspects of matplotlib linestyle and contour plotting techniques, providing you with the knowledge and skills to create stunning visualizations. We’ll cover everything from basic line styles to advanced contour plot customization, with plenty of examples along the way.
Understanding Matplotlib Linestyle Basics
Matplotlib linestyle is a crucial aspect of creating line plots and contour plots. The linestyle parameter allows you to customize the appearance of lines in your plots, making them more visually appealing and informative. Let’s start by exploring the basic linestyle options available in matplotlib.
Solid Lines
The most common linestyle is the solid line, which is the default option in matplotlib. Here’s an example of how to create a simple plot with a solid line:
import matplotlib.pyplot as plt
import numpy as np

x = np.linspace(0, 10, 100)
y = np.sin(x)

plt.plot(x, y, linestyle='-', label='Solid Line')
plt.title('Matplotlib Linestyle Example - how2matplotlib.com')
plt.legend()
plt.show()
Output:
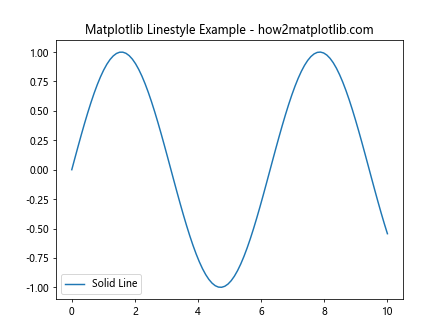
In this example, we use linestyle='-' to specify a solid line. The solid line is perfect for displaying continuous data or trends.
Dashed Lines
Dashed lines are another popular linestyle option in matplotlib. They can be useful for distinguishing between different data series or highlighting specific portions of a plot. Here’s how to create a dashed line:
import matplotlib.pyplot as plt
import numpy as np

x = np.linspace(0, 10, 100)
y = np.cos(x)

plt.plot(x, y, linestyle='--', label='Dashed Line')
plt.title('Matplotlib Dashed Linestyle - how2matplotlib.com')
plt.legend()
plt.show()
Output:
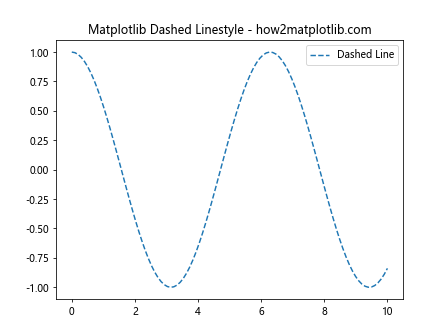
The linestyle='--' parameter creates a dashed line, which can be particularly useful for comparing multiple data series or indicating uncertainty in data.
Dotted Lines
Dotted lines offer yet another way to differentiate between data series or highlight specific aspects of your plot. Here’s an example of creating a dotted line:
import matplotlib.pyplot as plt
import numpy as np

x = np.linspace(0, 10, 100)
y = np.tan(x)

plt.plot(x, y, linestyle=':', label='Dotted Line')
plt.title('Matplotlib Dotted Linestyle - how2matplotlib.com')
plt.legend()
plt.show()
Output:
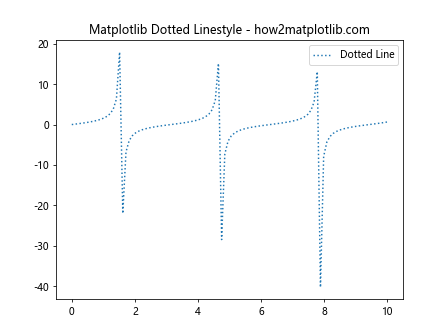
The linestyle=':' parameter creates a dotted line, which can be useful for representing discrete data points or indicating a threshold.
Advanced Matplotlib Linestyle Techniques
Now that we’ve covered the basics, let’s dive into some more advanced matplotlib linestyle techniques that can help you create even more sophisticated visualizations.
Custom Dash Patterns
Matplotlib allows you to create custom dash patterns for your lines. This can be particularly useful when you need to distinguish between multiple data series in a single plot. Here’s an example of how to create custom dash patterns:
import matplotlib.pyplot as plt
import numpy as np

x = np.linspace(0, 10, 100)
y1 = np.sin(x)
y2 = np.cos(x)

plt.plot(x, y1, linestyle=(0, (5, 5)), label='Line 1')
plt.plot(x, y2, linestyle=(0, (1, 1)), label='Line 2')
plt.title('Matplotlib Custom Dash Patterns - how2matplotlib.com')
plt.legend()
plt.show()
Output:
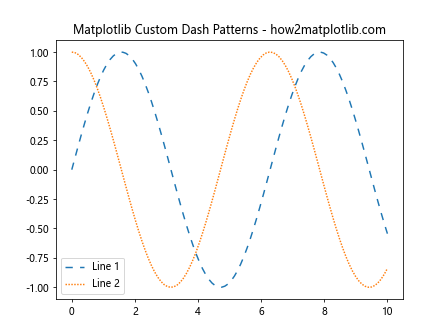
In this example, we use tuples to define custom dash patterns. The first number in the tuple represents the length of the line segment, while the second number represents the length of the space between segments.
Combining Linestyles with Colors and Markers
To create even more visually distinct plots, you can combine different linestyles with colors and markers. This technique is particularly useful when you need to represent multiple data series with different characteristics. Here’s an example:
import matplotlib.pyplot as plt
import numpy as np

x = np.linspace(0, 10, 20)
y1 = np.sin(x)
y2 = np.cos(x)
y3 = np.tan(x)

plt.plot(x, y1, linestyle='-', color='r', marker='o', label='Sin')
plt.plot(x, y2, linestyle='--', color='g', marker='s', label='Cos')
plt.plot(x, y3, linestyle=':', color='b', marker='^', label='Tan')
plt.title('Matplotlib Linestyle, Color, and Marker Combination - how2matplotlib.com')
plt.legend()
plt.show()
Output:
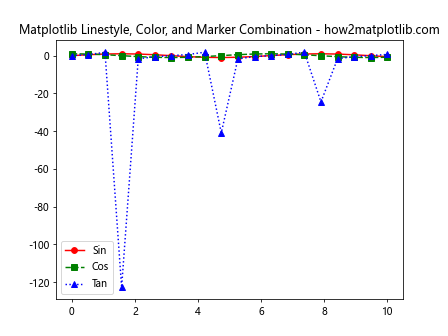
In this example, we combine different linestyles, colors, and markers to create a visually rich plot that clearly distinguishes between different data series.
Introduction to Matplotlib Contour Plots
Contour plots are a powerful tool for visualizing three-dimensional data on a two-dimensional plane. They are particularly useful for representing surfaces, elevation maps, and other types of data that vary across two dimensions. Let’s explore how to create basic contour plots using matplotlib.
Creating a Simple Contour Plot
To create a basic contour plot, you’ll need a 2D array of data and corresponding x and y coordinates. Here’s an example of how to create a simple contour plot:
import matplotlib.pyplot as plt
import numpy as np

x = np.linspace(-5, 5, 100)
y = np.linspace(-5, 5, 100)
X, Y = np.meshgrid(x, y)
Z = np.sin(np.sqrt(X**2 + Y**2))

plt.contour(X, Y, Z)
plt.title('Simple Matplotlib Contour Plot - how2matplotlib.com')
plt.colorbar(label='Z values')
plt.show()
Output:
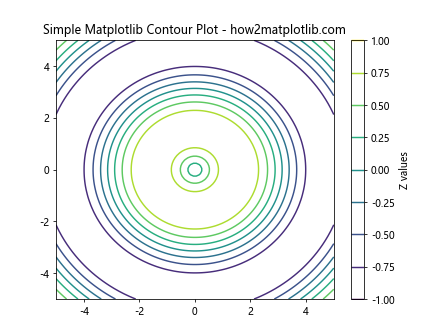
In this example, we create a 2D grid using np.meshgrid() and define a function Z that depends on X and Y. The plt.contour() function then creates the contour plot based on this data.
Filled Contour Plots
Filled contour plots can provide a more visually appealing representation of your data. Here’s how to create a filled contour plot:
import matplotlib.pyplot as plt
import numpy as np

x = np.linspace(-5, 5, 100)
y = np.linspace(-5, 5, 100)
X, Y = np.meshgrid(x, y)
Z = np.cos(X) * np.sin(Y)

plt.contourf(X, Y, Z, cmap='viridis')
plt.title('Filled Matplotlib Contour Plot - how2matplotlib.com')
plt.colorbar(label='Z values')
plt.show()
Output:
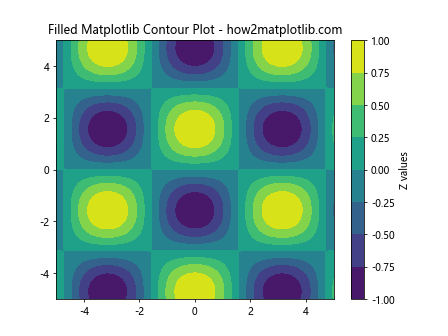
The plt.contourf() function creates a filled contour plot, and we use the cmap parameter to specify a colormap for the plot.
Customizing Matplotlib Contour Plots
Now that we’ve covered the basics of creating contour plots, let’s explore some techniques for customizing them to better suit your visualization needs.
Adjusting Contour Levels
You can control the number and position of contour lines by specifying the levels parameter. This allows you to focus on specific ranges of your data or create more detailed visualizations. Here’s an example:
import matplotlib.pyplot as plt
import numpy as np

x = np.linspace(-5, 5, 100)
y = np.linspace(-5, 5, 100)
X, Y = np.meshgrid(x, y)
Z = X**2 + Y**2

levels = np.linspace(0, 50, 15)
plt.contour(X, Y, Z, levels=levels)
plt.title('Matplotlib Contour Plot with Custom Levels - how2matplotlib.com')
plt.colorbar(label='Z values')
plt.show()
Output:
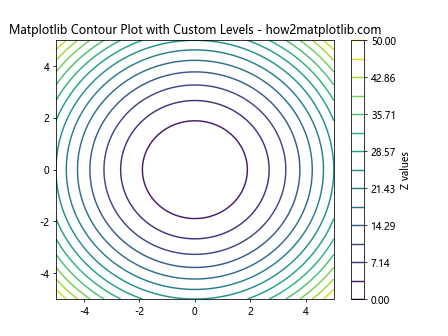
In this example, we use np.linspace() to create a custom set of levels for our contour plot, allowing for more fine-grained control over the visualization.
Adding Labels to Contour Lines
To make your contour plots more informative, you can add labels to the contour lines. This is particularly useful when you need to identify specific values in your plot. Here’s how to do it:
import matplotlib.pyplot as plt
import numpy as np

x = np.linspace(-5, 5, 100)
y = np.linspace(-5, 5, 100)
X, Y = np.meshgrid(x, y)
Z = np.sin(X) * np.cos(Y)

CS = plt.contour(X, Y, Z)
plt.clabel(CS, inline=True, fontsize=10)
plt.title('Matplotlib Contour Plot with Labels - how2matplotlib.com')
plt.colorbar(label='Z values')
plt.show()
Output:
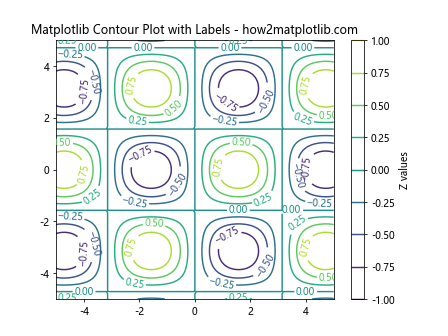
The plt.clabel() function adds labels to the contour lines, making it easier to interpret the values represented by each contour.
Combining Matplotlib Linestyle and Contour Plots
One of the most powerful aspects of matplotlib is the ability to combine different plotting techniques to create rich, informative visualizations. Let’s explore how we can combine linestyle and contour plots to create even more compelling visualizations.
Overlaying Line Plots on Contour Plots
By overlaying line plots on contour plots, you can highlight specific paths or trends within your data. Here’s an example of how to do this:
import matplotlib.pyplot as plt
import numpy as np

x = np.linspace(-5, 5, 100)
y = np.linspace(-5, 5, 100)
X, Y = np.meshgrid(x, y)
Z = np.sin(X) * np.cos(Y)

plt.contourf(X, Y, Z, cmap='coolwarm')
plt.colorbar(label='Z values')

# Add a line plot
line_x = np.linspace(-5, 5, 50)
line_y = np.sin(line_x)
plt.plot(line_x, line_y, color='k', linestyle='--', linewidth=2)

plt.title('Matplotlib Linestyle and Contour Plot Combination - how2matplotlib.com')
plt.show()
Output:
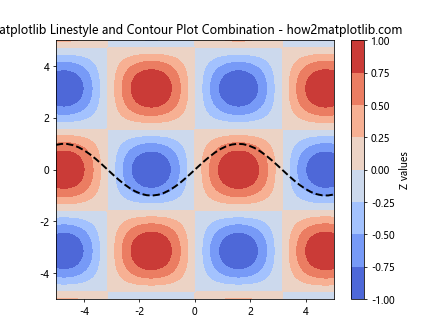
In this example, we create a filled contour plot and then overlay a dashed line plot on top of it. This technique can be useful for highlighting specific paths or trajectories within a contour plot.
Creating 3D Contour Plots with Custom Linestyles
While matplotlib is primarily used for 2D plotting, it also supports 3D visualizations. We can combine our knowledge of linestyles and contour plots to create stunning 3D visualizations. Here’s an example:
import matplotlib.pyplot as plt
from mpl_toolkits.mplot3d import Axes3D
import numpy as np

fig = plt.figure()
ax = fig.add_subplot(111, projection='3d')

x = np.linspace(-5, 5, 100)
y = np.linspace(-5, 5, 100)
X, Y = np.meshgrid(x, y)
Z = np.sin(np.sqrt(X**2 + Y**2))

# Create a 3D contour plot
cset = ax.contour(X, Y, Z, zdir='z', offset=-2, cmap='viridis')

# Add a 3D line plot
line_x = np.linspace(-5, 5, 100)
line_y = np.sin(line_x)
line_z = np.cos(line_x)
ax.plot(line_x, line_y, line_z, color='r', linestyle='--', linewidth=2)

ax.set_xlabel('X')
ax.set_ylabel('Y')
ax.set_zlabel('Z')
ax.set_title('3D Matplotlib Linestyle and Contour Plot - how2matplotlib.com')
plt.show()
Output:
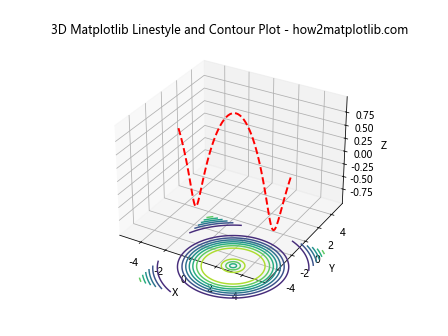
This example demonstrates how to create a 3D contour plot and overlay a 3D line plot with a custom linestyle. This technique can be particularly useful for visualizing complex relationships between multiple variables.
Advanced Techniques for Matplotlib Linestyle and Contour Plots
As we delve deeper into the world of matplotlib linestyle and contour plots, let’s explore some advanced techniques that can help you create even more sophisticated and informative visualizations.
Creating Animated Contour Plots
Animated contour plots can be an excellent way to visualize how data changes over time or across different parameters. Here’s an example of how to create a simple animated contour plot:
import matplotlib.pyplot as plt
import numpy as np
from matplotlib.animation import FuncAnimation

fig, ax = plt.subplots()

x = np.linspace(-5, 5, 100)
y = np.linspace(-5, 5, 100)
X, Y = np.meshgrid(x, y)

def animate(frame):
    Z = np.sin(np.sqrt(X**2 + Y**2) - frame * 0.1)
    ax.clear()
    contour = ax.contourf(X, Y, Z, cmap='viridis')
    ax.set_title(f'Animated Matplotlib Contour Plot - Frame {frame} - how2matplotlib.com')
    return contour

anim = FuncAnimation(fig, animate, frames=100, interval=50, blit=False)
plt.show()
Output:
This example creates an animated contour plot where the contours change over time. The FuncAnimation class is used to create the animation, with each frame updating the contour plot.
Combining Multiple Linestyles in a Single Plot
When working with complex data sets, you may need to represent different types of information using various linestyles within a single plot. Here’s an example of how to combine multiple linestyles in a single plot:
import matplotlib.pyplot as plt
import numpy as np

x = np.linspace(0, 10, 100)
y1 = np.sin(x)
y2 = np.cos(x)
y3 = np.tan(x)

fig, ax = plt.subplots()

ax.plot(x, y1, linestyle='-', color='r', label='Sin')
ax.plot(x, y2, linestyle='--', color='g', label='Cos')
ax.plot(x, y3, linestyle=':', color='b', label='Tan')

# Add a horizontal line
ax.axhline(y=0, color='k', linestyle='-.')

# Add a vertical line
ax.axvline(x=5, color='m', linestyle=(0, (5, 10)))

ax.set_title('Multiple Matplotlib Linestyles in One Plot - how2matplotlib.com')
ax.legend()
plt.show()
Output:
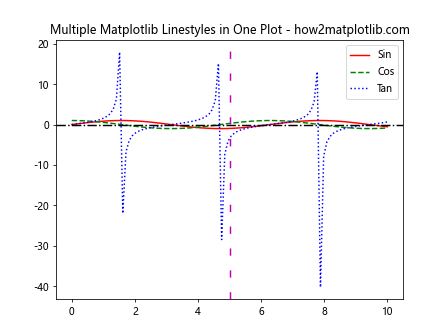
In this example, we use different linestyles for each of the trigonometric functions, as well as for horizontal and vertical lines. This technique allows you to convey multiple layers of information within a single plot.
Optimizing Matplotlib Linestyle and Contour Plots for Publication
When preparing matplotlib linestyle and contour plots for publication, there are several considerations to keep in mind to ensure your visualizations are clear, professional, and effective.
Adjusting Line Widths and Colors
For publication-quality plots, it’s often necessary to adjust line widths and colors to ensure clarity and readability. Here’s an example of how to create a plot with customized line widths and colors:
import matplotlib.pyplot as plt
import numpy as np

x = np.linspace(0, 10, 100)
y1 = np.sin(x)
y2 = np.cos(x)

fig, ax = plt.subplots(figsize=(8, 6))

ax.plot(x, y1, linestyle='-', color='#1f77b4', linewidth=2.5, label='Sin')
ax.plot(x, y2, linestyle='--', color='#ff7f0e', linewidth=2, label='Cos')

ax.set_title('Publication-Quality Matplotlib Linestyle Plot - how2matplotlib.com', fontsize=14)
ax.set_xlabel('X-axis', fontsize=12)
ax.set_ylabel('Y-axis', fontsize=12)
ax.legend(fontsize=10)
ax.tick_params(axis='both', which='major', labelsize=10)

plt.tight_layout()
plt.show()
Output:
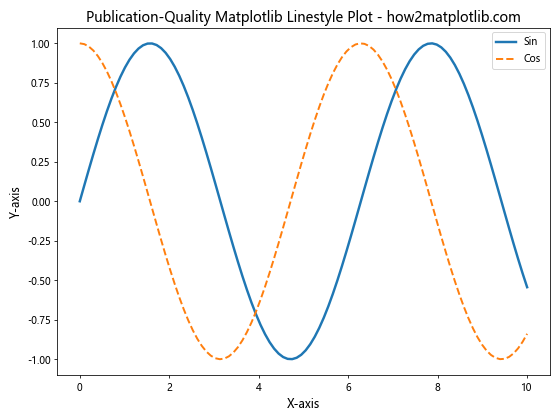
In this example, we use specific hex color codes and adjust line widths to create a more visually appealing and professional-looking plot. We also customize font sizes for various elements to ensure readability.
Enhancing Contour Plot Clarity
When preparing contour plots for publication, it’s important to ensure that the contours are clear and easy to interpret. Here’s an example of how to create a publication-quality contour plot:
import matplotlib.pyplot as plt
import numpy as np

x = np.linspace(-5, 5, 100)
y = np.linspace(-5, 5, 100)
X, Y = np.meshgrid(x, y)
Z = np.sin(np.sqrt(X**2 + Y**2))

fig, ax = plt.subplots(figsize=(8, 6))

levels = np.linspace(-1, 1, 15)
contour = ax.contourf(X, Y, Z, levels=levels, cmap='RdYlBu_r', extend='both')
ax.contour(X, Y, Z, levels=levels, colors='k', linewidths=0.5, linestyles='solid')

cbar = plt.colorbar(contour, ax=ax, label='Z values')
cbar.ax.tick_params(labelsize=10)

ax.set_title('Publication-Quality Matplotlib Contour Plot - how2matplotlib.com', fontsize=14)
ax.set_xlabel('X-axis', fontsize=12)
ax.set_ylabel('Y-axis', fontsize=12)
ax.tick_params(axis='both', which='major', labelsize=10)

plt.tight_layout()
plt.show()
Output:
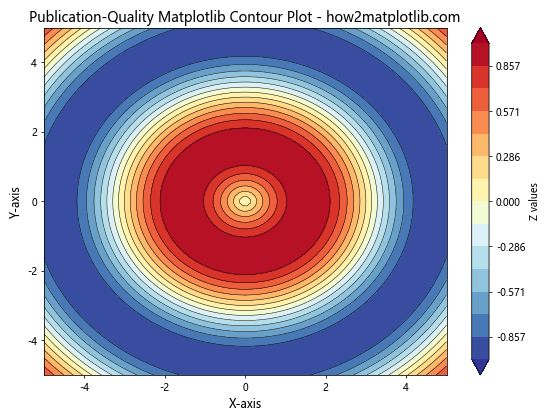
In this example, we use a combination of filled contours and line contours to create a clear and informative visualization. We also customize the colormap and add a color bar for better interpretation of the data.
Integrating Matplotlib Linestyle and Contour Plots with Other Libraries
Matplotlib’s flexibility allows it to integrate seamlessly with other popular data science libraries, enhancing its capabilities for linestyle and contour plotting.
Using Seaborn with Matplotlib for Enhanced Styling
Seaborn is a statistical data visualization library built on top of matplotlib that provides a high-level interface for drawing attractive statistical graphics. Here’s an example of how to use seaborn to enhance the styling of a matplotlib plot:
import matplotlib.pyplot as plt
import seaborn as sns
import numpy as np

sns.set_style("whitegrid")
sns.set_palette("deep")

x = np.linspace(0, 10, 100)
y1 = np.sin(x)
y2 = np.cos(x)

fig, ax = plt.subplots(figsize=(8, 6))

sns.lineplot(x=x, y=y1, label='Sin', linestyle='-')
sns.lineplot(x=x, y=y2, label='Cos', linestyle='--')

ax.set_title('Matplotlib Linestyle Plot with Seaborn Styling - how2matplotlib.com', fontsize=14)
ax.set_xlabel('X-axis', fontsize=12)
ax.set_ylabel('Y-axis', fontsize=12)
ax.legend(fontsize=10)

plt.tight_layout()
plt.show()
Output:
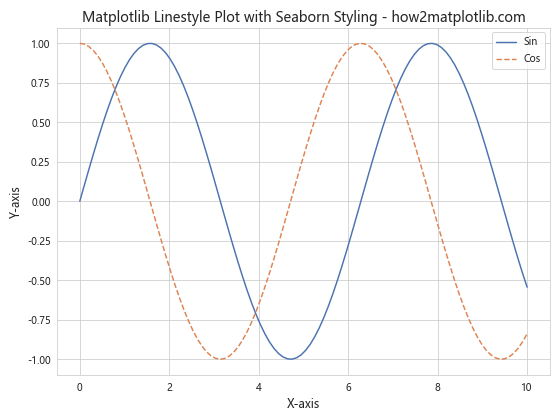
This example demonstrates how to use seaborn’s styling functions to create a more visually appealing plot while still leveraging matplotlib’s core functionality.
Combining Matplotlib Contour Plots with Pandas DataFrames
Pandas is a powerful data manipulation library that works well with matplotlib. Here’s an example of how to create a contour plot using data from a pandas DataFrame:
import matplotlib.pyplot as plt
import pandas as pd
import numpy as np

# Create a sample DataFrame
x = np.linspace(-5, 5, 50)
y = np.linspace(-5, 5, 50)
X, Y = np.meshgrid(x, y)
Z = np.sin(np.sqrt(X**2 + Y**2))

df = pd.DataFrame({'X': X.flatten(), 'Y': Y.flatten(), 'Z': Z.flatten()})

# Create the contour plot
fig, ax = plt.subplots(figsize=(8, 6))

contour = ax.tricontourf(df['X'], df['Y'], df['Z'], cmap='viridis')
ax.tricontour(df['X'], df['Y'], df['Z'], colors='k', linewidths=0.5, linestyles='solid')

plt.colorbar(contour, label='Z values')

ax.set_title('Matplotlib Contour Plot with Pandas Data - how2matplotlib.com', fontsize=14)
ax.set_xlabel('X-axis', fontsize=12)
ax.set_ylabel('Y-axis', fontsize=12)

plt.tight_layout()
plt.show()
Output:
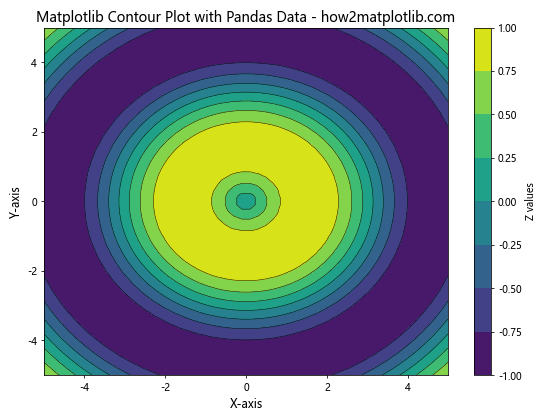
This example shows how to create a contour plot using data stored in a pandas DataFrame, demonstrating the seamless integration between pandas and matplotlib.
Troubleshooting Common Issues with Matplotlib Linestyle and Contour Plots
When working with matplotlib linestyle and contour plots, you may encounter some common issues. Let’s explore some of these problems and their solutions.
Dealing with Overlapping Contour Labels
Sometimes, contour labels can overlap, making them difficult to read. Here’s how to address this issue:
import matplotlib.pyplot as plt
import numpy as np

x = np.linspace(-5, 5, 100)
y = np.linspace(-5, 5, 100)
X, Y = np.meshgrid(x, y)
Z = np.sin(np.sqrt(X**2 + Y**2))

fig, ax = plt.subplots(figsize=(8, 6))

CS = ax.contour(X, Y, Z)
ax.clabel(CS, inline=True, fontsize=10, fmt='%1.2f', use_clabeltext=True)

ax.set_title('Matplotlib Contour Plot with Non-overlapping Labels - how2matplotlib.com', fontsize=14)
ax.set_xlabel('X-axis', fontsize=12)
ax.set_ylabel('Y-axis', fontsize=12)

plt.tight_layout()
plt.show()
Output:
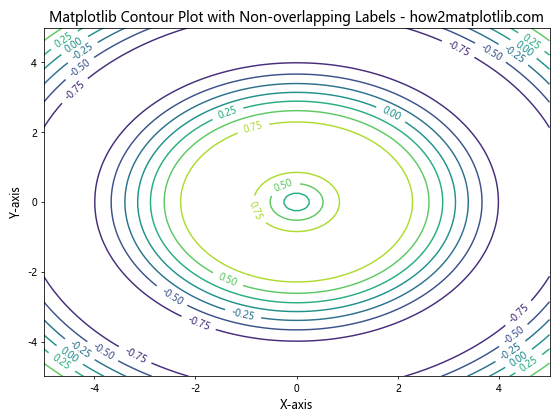
In this example, we use the use_clabeltext=True parameter in the clabel function to create text objects for the labels, which can be more easily manipulated to avoid overlapping.
Fixing Inconsistent Linestyles in Legends
Sometimes, the linestyles shown in the legend may not match those in the plot. Here’s how to ensure consistency:
import matplotlib.pyplot as plt
import numpy as np

x = np.linspace(0, 10, 100)
y1 = np.sin(x)
y2 = np.cos(x)

fig, ax = plt.subplots(figsize=(8, 6))

line1, = ax.plot(x, y1, linestyle='-', label='Sin')
line2, = ax.plot(x, y2, linestyle='--', label='Cos')

ax.legend(handles=[line1, line2])

ax.set_title('Matplotlib Plot with Consistent Linestyles in Legend - how2matplotlib.com', fontsize=14)
ax.set_xlabel('X-axis', fontsize=12)
ax.set_ylabel('Y-axis', fontsize=12)

plt.tight_layout()
plt.show()
Output:
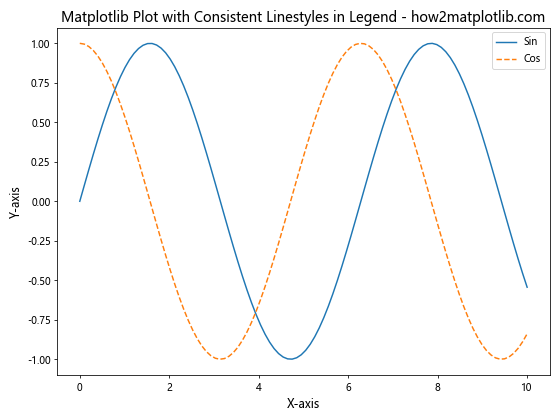
By explicitly creating line objects and passing them to the legend function, we ensure that the linestyles in the legend match those in the plot.
Matplotlib linestyle and contour Conclusion
Mastering matplotlib linestyle and contour plots opens up a world of possibilities for data visualization in Python. From basic line plots to complex 3D contour visualizations, the techniques covered in this guide provide a solid foundation for creating informative and visually appealing graphics.
Remember to experiment with different linestyles, colors, and contour plot settings to find the best representation for your data. As you continue to work with matplotlib, you’ll discover even more ways to customize and enhance your visualizations.
By combining matplotlib with other libraries like seaborn and pandas, you can create even more sophisticated and data-rich visualizations. Always keep in mind the principles of clear communication and visual appeal when designing your plots, especially when preparing them for publication or presentation.
With practice and creativity, you’ll be able to leverage the full power of matplotlib linestyle and contour plots to tell compelling stories with your data and create visualizations that truly stand out.