How to Master Matplotlib Linestyle Dashed: A Comprehensive Guide
Matplotlib linestyle dashed is a powerful feature in the popular Python plotting library Matplotlib. This article will explore the various aspects of using dashed line styles in Matplotlib, providing detailed explanations and examples to help you master this essential visualization technique. Whether you’re a beginner or an experienced data scientist, understanding how to effectively use matplotlib linestyle dashed can greatly enhance your data visualization capabilities.
Introduction to Matplotlib Linestyle Dashed
Matplotlib linestyle dashed is a line style option that allows you to create dashed lines in your plots. Dashed lines are often used to distinguish different data series, represent uncertainty, or indicate projections or estimates. The matplotlib linestyle dashed feature provides a wide range of customization options, enabling you to create visually appealing and informative plots.
Let’s start with a simple example to demonstrate how to use matplotlib linestyle dashed:
import matplotlib.pyplot as plt
import numpy as np

x = np.linspace(0, 10, 100)
y = np.sin(x)

plt.figure(figsize=(10, 6))
plt.plot(x, y, linestyle='dashed', label='how2matplotlib.com')
plt.title('Simple Dashed Line Plot')
plt.xlabel('X-axis')
plt.ylabel('Y-axis')
plt.legend()
plt.show()
Output:
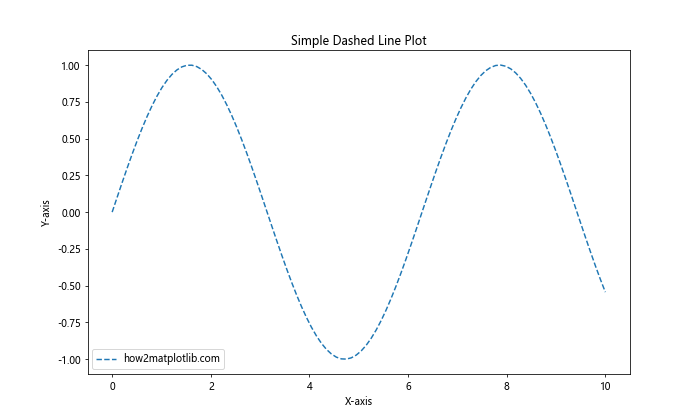
In this example, we create a simple sine wave plot using a dashed line style. The linestyle='dashed' parameter in the plt.plot() function sets the line style to dashed. This is the most basic way to use matplotlib linestyle dashed.
Understanding Linestyle Options in Matplotlib
Matplotlib offers several predefined line styles, including dashed lines. The matplotlib linestyle dashed option can be specified using different string representations or tuples. Let’s explore the various ways to define dashed line styles:
import matplotlib.pyplot as plt
import numpy as np

x = np.linspace(0, 10, 100)
y1 = np.sin(x)
y2 = np.cos(x)
y3 = np.tan(x)
y4 = np.exp(-x/10)

plt.figure(figsize=(12, 8))
plt.plot(x, y1, linestyle='dashed', label='Dashed')
plt.plot(x, y2, linestyle='--', label='Short Dash')
plt.plot(x, y3, linestyle='-.', label='Dash-Dot')
plt.plot(x, y4, linestyle=':', label='Dotted')
plt.title('Different Dashed Line Styles in Matplotlib')
plt.xlabel('X-axis')
plt.ylabel('Y-axis')
plt.legend()
plt.text(5, 0, 'how2matplotlib.com', fontsize=12, ha='center')
plt.show()
Output:
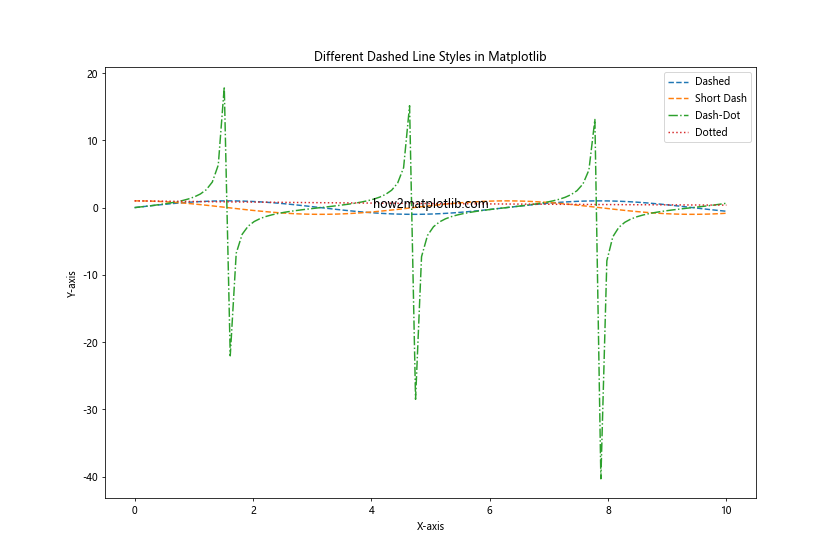
In this example, we demonstrate four different ways to specify dashed line styles:
linestyle='dashed': Standard dashed linelinestyle='--': Short dashed linelinestyle='-.': Dash-dot linelinestyle=':': Dotted line
Each of these options produces a different type of dashed or dotted line, allowing you to create diverse and visually distinct plots.
Customizing Dashed Line Patterns
Matplotlib linestyle dashed options can be further customized by specifying the dash pattern using a tuple. This allows for more precise control over the appearance of the dashed lines. Let’s explore how to create custom dash patterns:
import matplotlib.pyplot as plt
import numpy as np

x = np.linspace(0, 10, 100)
y = np.sin(x)

plt.figure(figsize=(12, 8))
plt.plot(x, y, linestyle=(0, (5, 5)), label='(5, 5)')
plt.plot(x, y + 1, linestyle=(0, (5, 1)), label='(5, 1)')
plt.plot(x, y + 2, linestyle=(0, (1, 1)), label='(1, 1)')
plt.plot(x, y + 3, linestyle=(0, (3, 5, 1, 5)), label='(3, 5, 1, 5)')

plt.title('Custom Dashed Line Patterns in Matplotlib')
plt.xlabel('X-axis')
plt.ylabel('Y-axis')
plt.legend()
plt.text(5, 2, 'how2matplotlib.com', fontsize=12, ha='center')
plt.show()
Output:
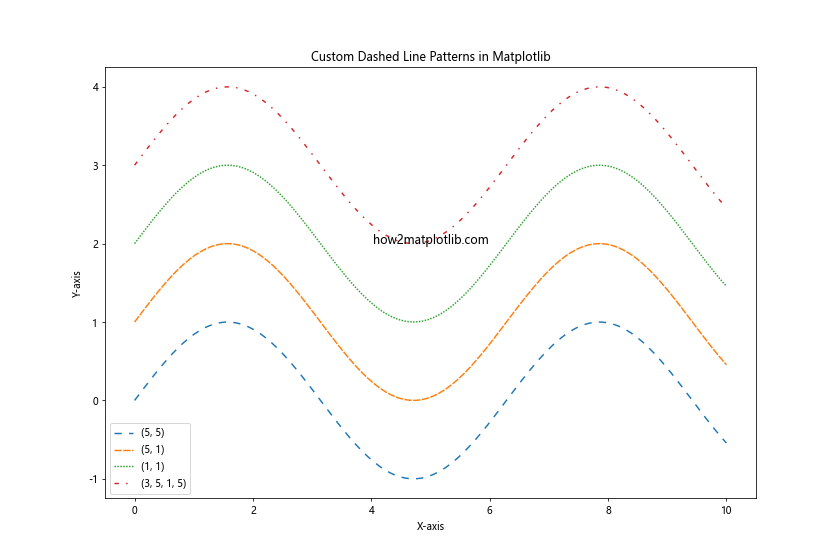
In this example, we use tuples to define custom dash patterns:
(0, (5, 5)): Dashes of length 5, separated by spaces of length 5(0, (5, 1)): Dashes of length 5, separated by spaces of length 1(0, (1, 1)): Dashes and spaces of length 1 (dotted line)(0, (3, 5, 1, 5)): Alternating dashes of length 3 and 1, separated by spaces of length 5
The first element of the tuple (0 in these cases) represents the offset of the dash pattern.
Combining Dashed Lines with Other Line Properties
Matplotlib linestyle dashed can be combined with other line properties to create even more distinctive plots. Let’s explore how to combine dashed lines with different colors, line widths, and markers:
import matplotlib.pyplot as plt
import numpy as np

x = np.linspace(0, 10, 20)
y = np.sin(x)

plt.figure(figsize=(12, 8))
plt.plot(x, y, linestyle='dashed', color='red', linewidth=2, marker='o', markersize=8, label='Red Dashed with Markers')
plt.plot(x, y + 1, linestyle='--', color='blue', linewidth=3, label='Blue Short Dash')
plt.plot(x, y + 2, linestyle='-.', color='green', linewidth=1.5, label='Green Dash-Dot')

plt.title('Combining Dashed Lines with Other Properties')
plt.xlabel('X-axis')
plt.ylabel('Y-axis')
plt.legend()
plt.text(5, 1.5, 'how2matplotlib.com', fontsize=12, ha='center')
plt.show()
Output:
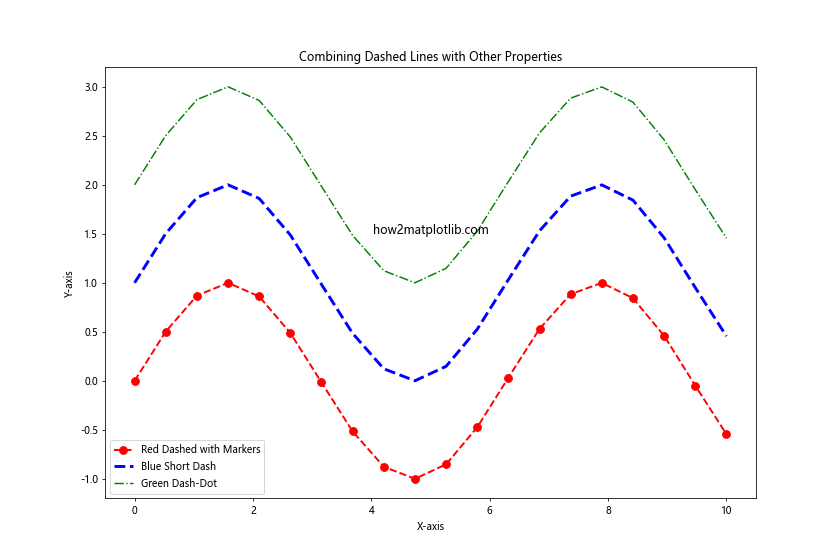
In this example, we combine matplotlib linestyle dashed with:
- Different colors (
colorparameter) - Various line widths (
linewidthparameter) - Markers (
markerandmarkersizeparameters)
This combination of properties allows for highly customized and visually distinct line plots.
Using Dashed Lines in Different Plot Types
Matplotlib linestyle dashed can be applied to various types of plots beyond simple line plots. Let’s explore how to use dashed lines in scatter plots, bar plots, and error bars:
import matplotlib.pyplot as plt
import numpy as np

# Scatter plot with dashed connecting lines
x = np.arange(10)
y = np.random.rand(10)

plt.figure(figsize=(12, 4))
plt.subplot(131)
plt.scatter(x, y, c='red')
plt.plot(x, y, linestyle='dashed', color='blue', alpha=0.5)
plt.title('Scatter with Dashed Lines')

# Bar plot with dashed error bars
categories = ['A', 'B', 'C', 'D']
values = np.random.rand(4)
error = np.random.rand(4) * 0.1

plt.subplot(132)
plt.bar(categories, values, yerr=error, capsize=5, error_kw={'linestyle': 'dashed'})
plt.title('Bar Plot with Dashed Error Bars')

# Step plot with dashed lines
x = np.linspace(0, 10, 100)
y = np.cumsum(np.random.randn(100))

plt.subplot(133)
plt.step(x, y, where='mid', linestyle='dashed')
plt.title('Step Plot with Dashed Lines')

plt.tight_layout()
plt.suptitle('Dashed Lines in Different Plot Types', y=1.05)
plt.text(5, 0.5, 'how2matplotlib.com', fontsize=12, ha='center')
plt.show()
Output:
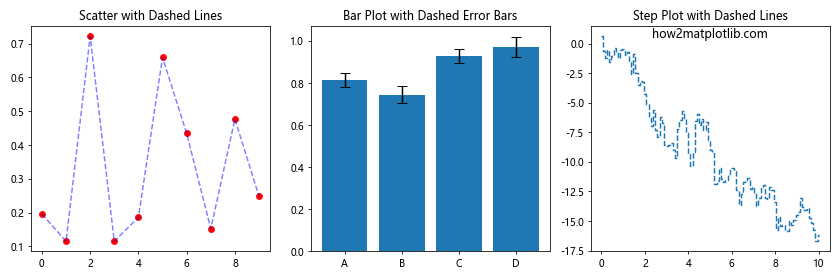
This example demonstrates the versatility of matplotlib linestyle dashed:
- Scatter plot with dashed connecting lines
- Bar plot with dashed error bars
- Step plot with dashed lines
Each of these plot types benefits from the use of dashed lines to enhance visual clarity and convey additional information.
Creating Multi-line Plots with Different Dash Styles
When creating plots with multiple lines, using different dash styles can help distinguish between different data series. Let’s explore how to create a multi-line plot using various matplotlib linestyle dashed options:
import matplotlib.pyplot as plt
import numpy as np

x = np.linspace(0, 10, 100)
y1 = np.sin(x)
y2 = np.cos(x)
y3 = np.tan(x)
y4 = x**2 / 10

plt.figure(figsize=(12, 8))
plt.plot(x, y1, linestyle='dashed', label='Sin(x)')
plt.plot(x, y2, linestyle='--', label='Cos(x)')
plt.plot(x, y3, linestyle='-.', label='Tan(x)')
plt.plot(x, y4, linestyle=':', label='x^2/10')

plt.title('Multi-line Plot with Different Dash Styles')
plt.xlabel('X-axis')
plt.ylabel('Y-axis')
plt.legend()
plt.grid(True, linestyle='dotted')
plt.text(5, 0, 'how2matplotlib.com', fontsize=12, ha='center')
plt.show()
Output:
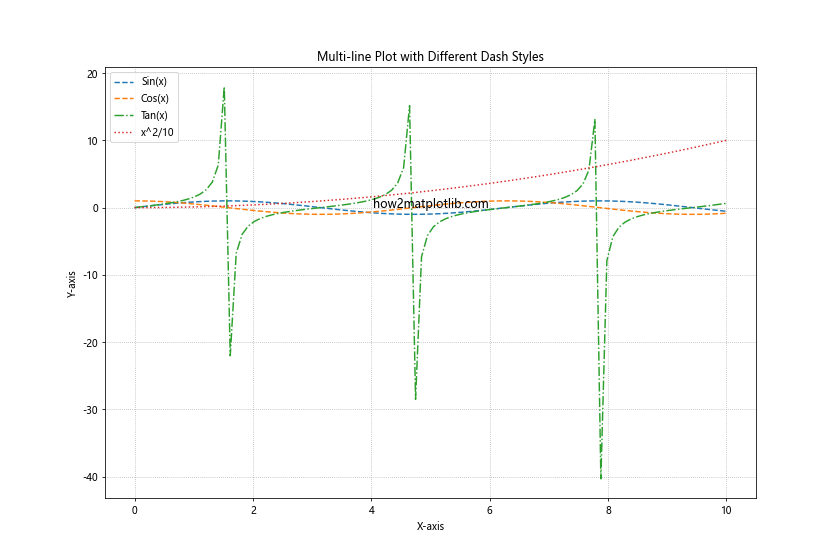
In this example, we create a plot with four different functions, each represented by a different dash style:
- Solid line for sin(x)
- Dashed line for cos(x)
- Dash-dot line for tan(x)
- Dotted line for x^2/10
Using different matplotlib linestyle dashed options helps to visually separate the different functions and make the plot more readable.
Animating Dashed Lines
Matplotlib linestyle dashed can also be used in animations to create dynamic and engaging visualizations. Let’s create a simple animation of a moving dashed line:
import matplotlib.pyplot as plt
import numpy as np
from matplotlib.animation import FuncAnimation

fig, ax = plt.subplots(figsize=(10, 6))
x = np.linspace(0, 10, 100)
line, = ax.plot(x, np.sin(x), linestyle='dashed')

def animate(i):
    line.set_ydata(np.sin(x + i/10))
    return line,

ani = FuncAnimation(fig, animate, frames=100, interval=50, blit=True)
plt.title('Animated Dashed Line')
plt.text(5, 0, 'how2matplotlib.com', fontsize=12, ha='center')
plt.show()
Output:
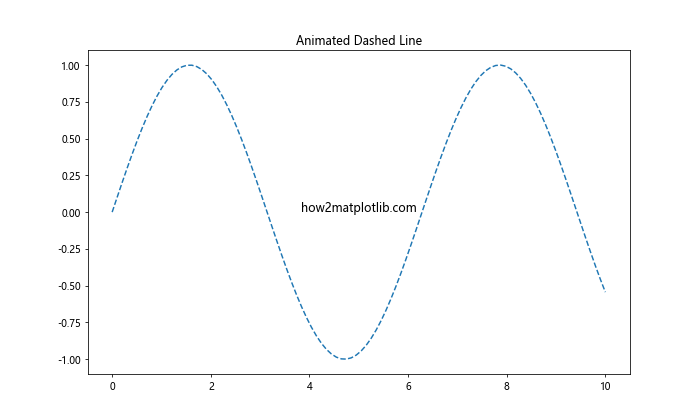
This example creates an animation of a moving sine wave with a dashed line style. The FuncAnimation class is used to update the y-data of the line in each frame, creating the illusion of movement.
Using Dashed Lines in Subplots
Matplotlib linestyle dashed can be effectively used in subplot layouts to create complex, multi-panel figures. Let’s create a figure with multiple subplots, each using different dashed line styles:
import matplotlib.pyplot as plt
import numpy as np

x = np.linspace(0, 10, 100)
y1 = np.sin(x)
y2 = np.cos(x)
y3 = np.exp(-x/5)
y4 = x**2 / 10

fig, ((ax1, ax2), (ax3, ax4)) = plt.subplots(2, 2, figsize=(12, 10))

ax1.plot(x, y1, linestyle='dashed')
ax1.set_title('Dashed Sin(x)')

ax2.plot(x, y2, linestyle='--')
ax2.set_title('Short Dashed Cos(x)')

ax3.plot(x, y3, linestyle='-.')
ax3.set_title('Dash-Dot Exp(-x/5)')

ax4.plot(x, y4, linestyle=':')
ax4.set_title('Dotted x^2/10')

for ax in (ax1, ax2, ax3, ax4):
    ax.set_xlabel('X-axis')
    ax.set_ylabel('Y-axis')
    ax.grid(True, linestyle='dotted')

plt.tight_layout()
plt.suptitle('Dashed Lines in Subplots', y=1.02)
fig.text(0.5, 0.01, 'how2matplotlib.com', ha='center')
plt.show()
Output:
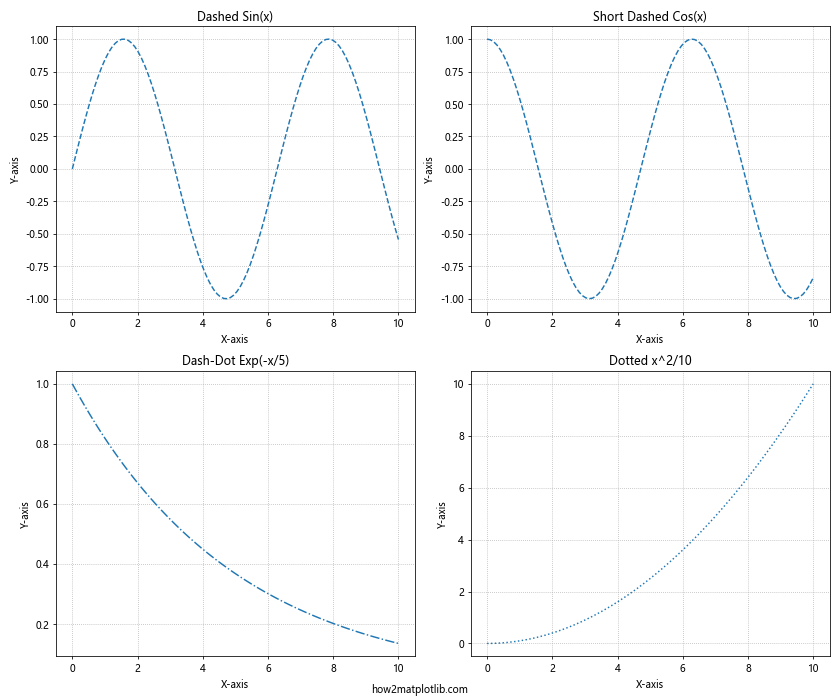
This example creates a 2×2 grid of subplots, each displaying a different function with a unique dashed line style. This approach allows for easy comparison of multiple datasets or functions within a single figure.
Combining Dashed Lines with Fill Between
Matplotlib linestyle dashed can be combined with the fill_between function to create shaded regions with dashed boundaries. This is particularly useful for visualizing confidence intervals or ranges of data:
import matplotlib.pyplot as plt
import numpy as np

x = np.linspace(0, 10, 100)
y = np.sin(x)
y_upper = y + 0.2
y_lower = y - 0.2

plt.figure(figsize=(12, 6))
plt.plot(x, y, color='blue', label='Sin(x)')
plt.fill_between(x, y_lower, y_upper, alpha=0.2, color='blue')
plt.plot(x, y_upper, linestyle='dashed', color='blue', alpha=0.5)
plt.plot(x, y_lower, linestyle='dashed', color='blue', alpha=0.5)

plt.title('Dashed Lines with Fill Between')
plt.xlabel('X-axis')
plt.ylabel('Y-axis')
plt.legend()
plt.text(5, 0, 'how2matplotlib.com', fontsize=12, ha='center')
plt.show()
Output:
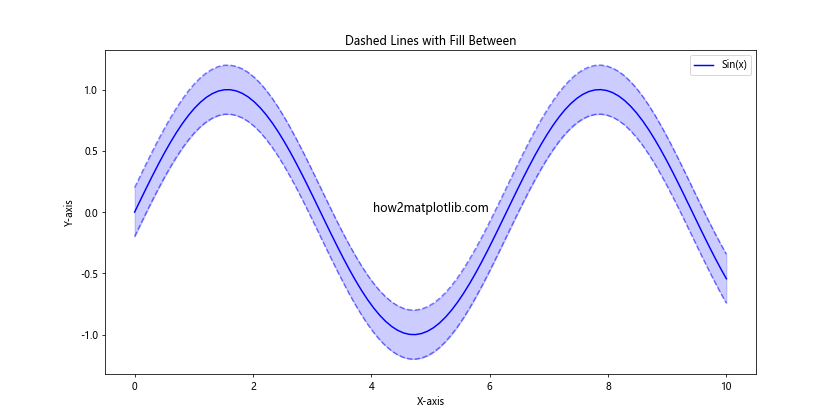
In this example, we plot a sine wave with a shaded region representing a confidence interval. The boundaries of this region are plotted using dashed lines, creating a visually appealing and informative plot.
Using Dashed Lines in Polar Plots
Matplotlib linestyle dashed can also be applied to polar plots, which are useful for visualizing directional or cyclical data. Let’s create a polar plot with dashed lines:
import matplotlib.pyplot as plt
import numpy as np

theta = np.linspace(0, 2*np.pi, 100)
r1 = np.sin(theta)
r2 = np.cos(theta)

plt.figure(figsize=(10, 10))
ax = plt.subplot(111, projection='polar')
ax.plot(theta, r1, linestyle='dashed', label='Sin(θ)')
ax.plot(theta, r2, linestyle='--', label='Cos(θ)')
ax.set_rticks([0.5, 1])
ax.set_rlabel_position(45)
ax.grid(True)

plt.title('Dashed Lines in Polar Plot')
plt.legend(loc='upper left', bbox_to_anchor=(1.05, 1))
plt.text(0, 0, 'how2matplotlib.com', fontsize=12, ha='center')
plt.show()
Output:
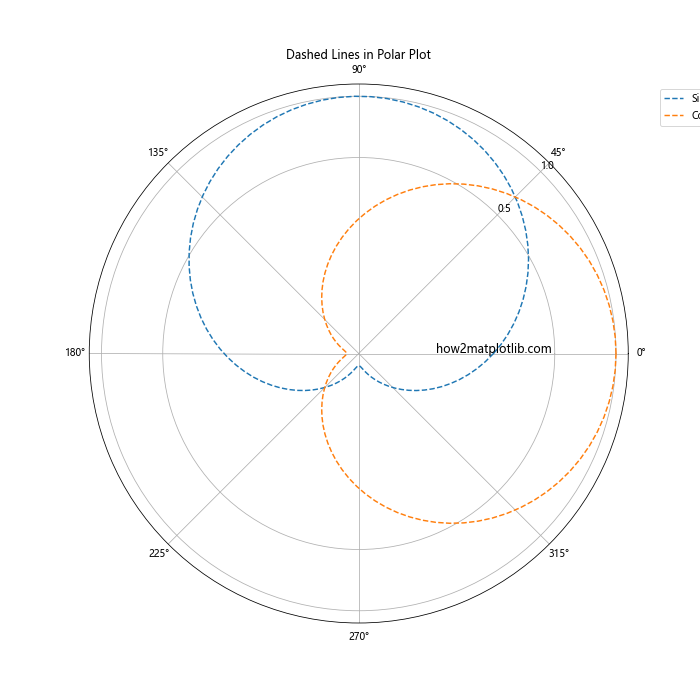
This example creates a polar plot with two functions (sine and cosine) represented by different dashed line styles. Polar plots with dashed lines can be particularly effective for visualizing periodic functions or directional data.
Customizing Dash Patterns with Line Collections
For more advanced control over dashed lines, especially when dealing with multiple lines with different dash patterns, we can use LineCollection. This allows usto set different dash patterns for individual line segments:
import matplotlib.pyplot as plt
import numpy as np
from matplotlib.collections import LineCollection

x = np.linspace(0, 10, 100)
y = np.sin(x)

points = np.array([x, y]).T.reshape(-1, 1, 2)
segments = np.concatenate([points[:-1], points[1:]], axis=1)

fig, ax = plt.subplots(figsize=(12, 6))
lc = LineCollection(segments, linestyles=[(0, (5, 5)), (0, (1, 1)), (0, (3, 5, 1, 5))],
                    linewidths=2)

ax.add_collection(lc)
ax.set_xlim(x.min(), x.max())
ax.set_ylim(y.min(), y.max())
plt.title('Custom Dash Patterns with LineCollection')
plt.xlabel('X-axis')
plt.ylabel('Y-axis')
plt.text(5, 0, 'how2matplotlib.com', fontsize=12, ha='center')
plt.show()
Output:
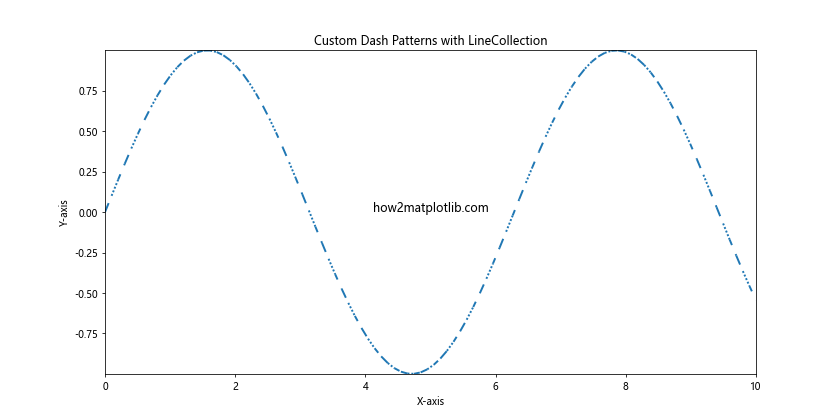
In this example, we create a LineCollection with different dash patterns for different segments of the sine curve. This technique allows for highly customized line styles within a single plot.
Combining Dashed Lines with Markers
Matplotlib linestyle dashed can be effectively combined with markers to create plots that highlight both continuous trends and specific data points:
import matplotlib.pyplot as plt
import numpy as np

x = np.linspace(0, 10, 20)
y1 = np.sin(x)
y2 = np.cos(x)

plt.figure(figsize=(12, 6))
plt.plot(x, y1, linestyle='dashed', marker='o', markersize=8, label='Sin(x)')
plt.plot(x, y2, linestyle='--', marker='s', markersize=8, label='Cos(x)')

plt.title('Dashed Lines with Markers')
plt.xlabel('X-axis')
plt.ylabel('Y-axis')
plt.legend()
plt.grid(True, linestyle=':')
plt.text(5, 0, 'how2matplotlib.com', fontsize=12, ha='center')
plt.show()
Output:
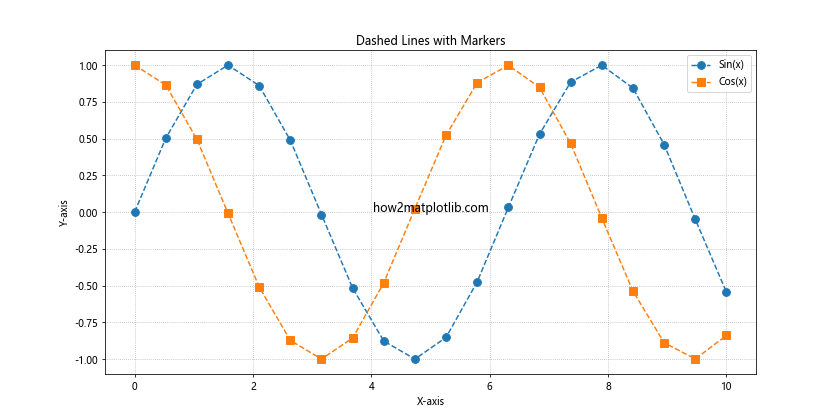
In this example, we plot sine and cosine functions using different dashed line styles and markers. The combination of dashed lines and markers allows for clear visualization of both the overall trend and individual data points.
Using Dashed Lines in Contour Plots
Matplotlib linestyle dashed can also be applied to contour plots, which are useful for visualizing three-dimensional data on a two-dimensional plane:
import matplotlib.pyplot as plt
import numpy as np

x = np.linspace(-3, 3, 100)
y = np.linspace(-3, 3, 100)
X, Y = np.meshgrid(x, y)
Z = np.sin(X) * np.cos(Y)

plt.figure(figsize=(10, 8))
CS = plt.contour(X, Y, Z, levels=10, linestyles='dashed')
plt.clabel(CS, inline=True, fontsize=10)
plt.title('Contour Plot with Dashed Lines')
plt.xlabel('X-axis')
plt.ylabel('Y-axis')
plt.text(0, 0, 'how2matplotlib.com', fontsize=12, ha='center')
plt.colorbar(label='Z-values')
plt.show()
Output:
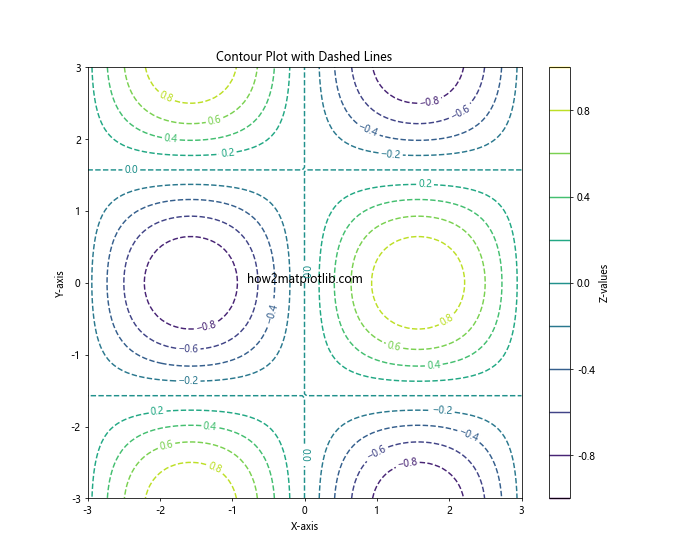
This example creates a contour plot of a two-dimensional function using dashed lines for the contours. The dashed lines help to distinguish between different contour levels.
Customizing Dash Patterns in Legend
When using matplotlib linestyle dashed, it’s important to ensure that the legend accurately reflects the line styles used in the plot. Here’s how to customize the dash patterns in the legend:
import matplotlib.pyplot as plt
import numpy as np

x = np.linspace(0, 10, 100)
y1 = np.sin(x)
y2 = np.cos(x)
y3 = np.tan(x)

plt.figure(figsize=(12, 6))
line1, = plt.plot(x, y1, linestyle='dashed', label='Sin(x)')
line2, = plt.plot(x, y2, linestyle='--', label='Cos(x)')
line3, = plt.plot(x, y3, linestyle='-.', label='Tan(x)')

plt.title('Customized Legend with Dashed Lines')
plt.xlabel('X-axis')
plt.ylabel('Y-axis')

# Customize legend
legend = plt.legend(handles=[line1, line2, line3], loc='upper right')
for line in legend.get_lines():
    line.set_linestyle(line.get_linestyle())

plt.text(5, 0, 'how2matplotlib.com', fontsize=12, ha='center')
plt.show()
Output:
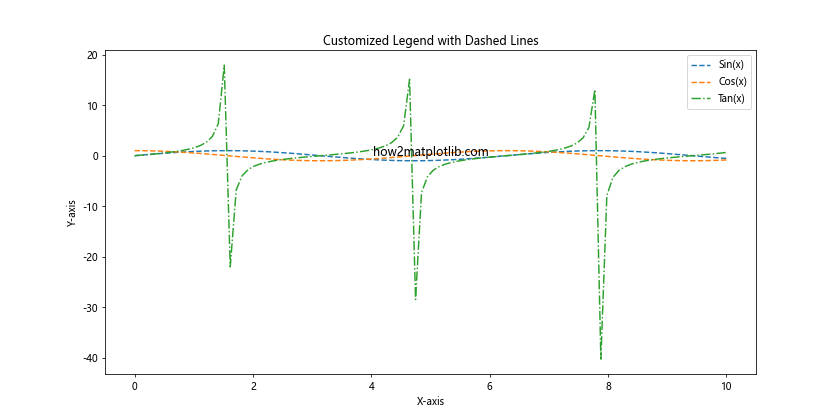
In this example, we explicitly set the line styles in the legend to match those used in the plot. This ensures that the legend accurately represents the different dash patterns used.
Using Dashed Lines in Histograms
While histograms typically use solid bars, matplotlib linestyle dashed can be used to create outlined histogram bars with dashed edges:
import matplotlib.pyplot as plt
import numpy as np

data = np.random.randn(1000)

plt.figure(figsize=(12, 6))
plt.hist(data, bins=30, edgecolor='black', linestyle='dashed', linewidth=1.5, facecolor='lightblue', alpha=0.7)
plt.title('Histogram with Dashed Edges')
plt.xlabel('Values')
plt.ylabel('Frequency')
plt.text(0, 50, 'how2matplotlib.com', fontsize=12, ha='center')
plt.show()
Output:
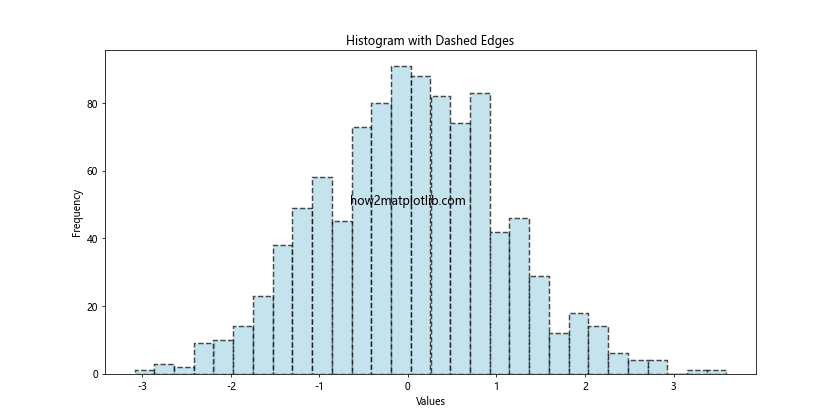
This example creates a histogram with dashed edges, combining the solid fill of traditional histograms with the visual interest of dashed lines.
Matplotlib linestyle dashed Conclusion
Matplotlib linestyle dashed is a versatile and powerful feature that can significantly enhance the visual appeal and clarity of your plots. Throughout this comprehensive guide, we’ve explored various aspects of using dashed lines in Matplotlib, from basic usage to advanced techniques and applications in different types of plots.
Key takeaways include:
- The flexibility of matplotlib linestyle dashed in representing different line styles.
- The ability to customize dash patterns for precise control over line appearance.
- The effectiveness of combining dashed lines with other plot properties like color, markers, and line width.
- The applicability of dashed lines to various plot types, including 2D plots, 3D plots, polar plots, and more.
- Advanced techniques like using LineCollections for segment-specific dash patterns.
By mastering matplotlib linestyle dashed, you can create more informative, visually appealing, and professional-looking visualizations. Whether you’re plotting scientific data, financial trends, or any other type of information, the judicious use of dashed lines can help you communicate your insights more effectively.
Remember to experiment with different dash patterns, combine them with other plot elements, and always consider the context and purpose of your visualization when choosing line styles. With practice and creativity, you’ll be able to leverage matplotlib linestyle dashed to its full potential, creating stunning and informative data visualizations.