How to Reset Linestyle in Matplotlib: A Comprehensive Guide
Matplotlib reset linestyle is an essential technique for data visualization enthusiasts and professionals alike. When working with Matplotlib, you may often find yourself needing to reset the linestyle of your plots to achieve the desired visual effect. In this comprehensive guide, we’ll explore various methods and techniques to reset linestyle in Matplotlib, providing you with the knowledge and tools to create stunning visualizations.
Understanding Matplotlib and Linestyles
Before diving into the specifics of resetting linestyles in Matplotlib, it’s crucial to understand what Matplotlib is and how linestyles work within this powerful library.
Matplotlib is a plotting library for the Python programming language and its numerical mathematics extension NumPy. It provides an object-oriented API for embedding plots into applications using general-purpose GUI toolkits like Tkinter, wxPython, Qt, or GTK. Matplotlib is designed to be as usable as MATLAB, with the ability to use Python, and the advantage of being free and open-source.
Linestyles in Matplotlib refer to the appearance of lines in plots. They can be solid, dashed, dotted, or a combination of these. The ability to reset linestyle in Matplotlib is crucial for customizing your plots and making them visually appealing and informative.
Let’s start with a simple example to illustrate how to set and reset linestyle in Matplotlib:
import matplotlib.pyplot as plt
import numpy as np

# Data for plotting
x = np.linspace(0, 10, 100)
y = np.sin(x)

# Create a plot with a solid line
plt.plot(x, y, label='Sine wave')
plt.title('How to reset linestyle in Matplotlib - how2matplotlib.com')
plt.xlabel('x')
plt.ylabel('sin(x)')
plt.legend()
plt.show()

# Reset linestyle to dashed
plt.plot(x, y, linestyle='--', label='Dashed sine wave')
plt.title('Resetting linestyle in Matplotlib - how2matplotlib.com')
plt.xlabel('x')
plt.ylabel('sin(x)')
plt.legend()
plt.show()
In this example, we first create a plot with a solid line (the default linestyle). Then, we reset the linestyle to dashed by specifying linestyle='--' in the plot() function. This demonstrates the basic concept of resetting linestyle in Matplotlib.
Common Linestyles in Matplotlib
Before we delve deeper into resetting linestyles, let’s familiarize ourselves with the common linestyles available in Matplotlib:
- Solid line: ‘-‘
- Dashed line: ‘–‘
- Dotted line: ‘:’
- Dash-dot line: ‘-.’
Understanding these basic linestyles is crucial when working with Matplotlib reset linestyle techniques. Let’s create an example that showcases all these linestyles:
import matplotlib.pyplot as plt
import numpy as np

x = np.linspace(0, 10, 100)
y1 = np.sin(x)
y2 = np.cos(x)
y3 = np.tan(x)
y4 = np.exp(-x/10)

plt.plot(x, y1, linestyle='-', label='Solid')
plt.plot(x, y2, linestyle='--', label='Dashed')
plt.plot(x, y3, linestyle=':', label='Dotted')
plt.plot(x, y4, linestyle='-.', label='Dash-dot')

plt.title('Matplotlib Linestyle Examples - how2matplotlib.com')
plt.xlabel('x')
plt.ylabel('y')
plt.legend()
plt.show()
Output:
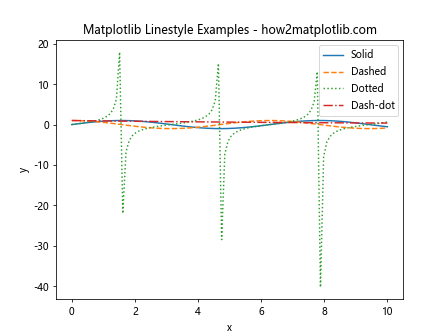
This example demonstrates the four basic linestyles in Matplotlib. By understanding these styles, you’ll be better equipped to reset linestyle in Matplotlib effectively.
Resetting Linestyle Using plt.rcParams
One powerful method to reset linestyle in Matplotlib is by using plt.rcParams. This approach allows you to set default styles for all plots in your script or notebook. Here’s an example:
import matplotlib.pyplot as plt
import numpy as np

# Reset default linestyle to dashed
plt.rcParams['lines.linestyle'] = '--'

x = np.linspace(0, 10, 100)
y = np.sin(x)

plt.plot(x, y)
plt.title('Resetting Default Linestyle - how2matplotlib.com')
plt.xlabel('x')
plt.ylabel('sin(x)')
plt.show()

# Reset back to solid
plt.rcParams['lines.linestyle'] = '-'

plt.plot(x, y)
plt.title('Resetting Back to Solid Linestyle - how2matplotlib.com')
plt.xlabel('x')
plt.ylabel('sin(x)')
plt.show()
In this example, we first reset the default linestyle to dashed using plt.rcParams['lines.linestyle'] = '--'. This affects all subsequent plots. We then reset it back to solid using plt.rcParams['lines.linestyle'] = '-'. This method is particularly useful when you want to apply a consistent linestyle across multiple plots.
Resetting Linestyle for Individual Lines
While resetting the default linestyle is useful, you often need more granular control. Matplotlib allows you to reset linestyle for individual lines in a plot. Here’s how you can do it:
import matplotlib.pyplot as plt
import numpy as np

x = np.linspace(0, 10, 100)
y1 = np.sin(x)
y2 = np.cos(x)

# Create a plot with two lines
line1, = plt.plot(x, y1, label='Sine')
line2, = plt.plot(x, y2, label='Cosine')

plt.title('Before Resetting Linestyle - how2matplotlib.com')
plt.legend()
plt.show()

# Reset linestyle for individual lines
line1.set_linestyle('--')
line2.set_linestyle(':')

plt.title('After Resetting Linestyle - how2matplotlib.com')
plt.legend()
plt.show()
In this example, we first create a plot with two lines. We then use the set_linestyle() method to reset the linestyle of each line individually. This gives you fine-grained control over the appearance of your plots.
Resetting Linestyle with Cycler
The cycler module in Matplotlib provides a powerful way to cycle through multiple properties, including linestyles. This is particularly useful when you want to reset linestyle in Matplotlib for multiple lines in a systematic way. Here’s an example:
import matplotlib.pyplot as plt
from cycler import cycler
import numpy as np

# Set up cycler for linestyles
plt.rc('axes', prop_cycle=(cycler('linestyle', ['-', '--', ':', '-.'])))

x = np.linspace(0, 10, 100)
for i in range(4):
    plt.plot(x, np.sin(x + i), label=f'Line {i+1}')

plt.title('Resetting Linestyle with Cycler - how2matplotlib.com')
plt.xlabel('x')
plt.ylabel('y')
plt.legend()
plt.show()
Output:
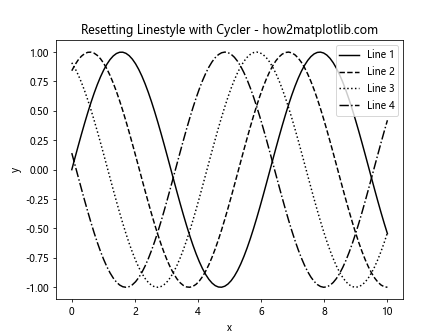
In this example, we use the cycler to cycle through four different linestyles. Each new line plotted will automatically use the next linestyle in the cycle. This is an efficient way to reset linestyle in Matplotlib for multiple lines without having to specify the style for each line individually.
Resetting Linestyle with Style Sheets
Matplotlib style sheets provide a convenient way to customize the appearance of your plots, including linestyles. You can use pre-defined style sheets or create your own. Here’s an example of how to use a style sheet to reset linestyle in Matplotlib:
import matplotlib.pyplot as plt
import numpy as np

# Use the 'seaborn' style sheet
plt.style.use('seaborn')

x = np.linspace(0, 10, 100)
y = np.sin(x)

plt.plot(x, y)
plt.title('Resetting Linestyle with Style Sheet - how2matplotlib.com')
plt.xlabel('x')
plt.ylabel('sin(x)')
plt.show()

# Reset to default style
plt.style.use('default')

plt.plot(x, y)
plt.title('Default Style - how2matplotlib.com')
plt.xlabel('x')
plt.ylabel('sin(x)')
plt.show()
In this example, we first use the ‘seaborn’ style sheet, which changes various plot properties including linestyle. We then reset to the default style. This method is useful when you want to apply a consistent style across all elements of your plot.
Resetting Linestyle for Subplots
When working with subplots in Matplotlib, you might want to reset linestyle for each subplot individually. Here’s how you can do that:
import matplotlib.pyplot as plt
import numpy as np

x = np.linspace(0, 10, 100)
y1 = np.sin(x)
y2 = np.cos(x)

fig, (ax1, ax2) = plt.subplots(1, 2, figsize=(12, 5))

ax1.plot(x, y1)
ax1.set_title('Subplot 1 - how2matplotlib.com')

ax2.plot(x, y2)
ax2.set_title('Subplot 2 - how2matplotlib.com')

# Reset linestyle for subplot 2
lines = ax2.get_lines()
for line in lines:
    line.set_linestyle('--')

plt.tight_layout()
plt.show()
Output:
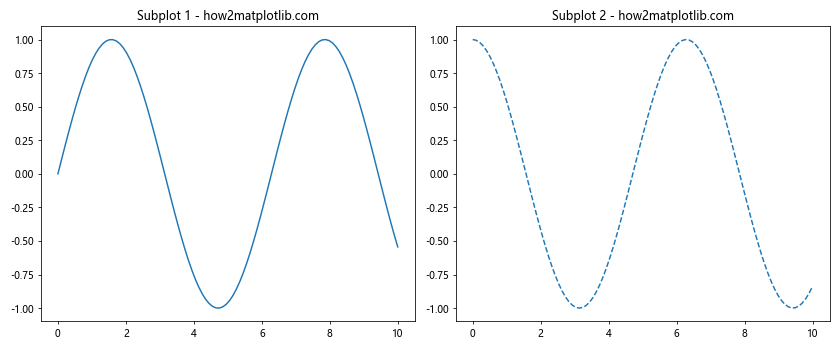
In this example, we create two subplots. We then reset the linestyle for the second subplot by iterating through its lines and setting their linestyle to dashed. This demonstrates how you can reset linestyle in Matplotlib for specific subplots.
Resetting Linestyle Dynamically
Sometimes, you might want to reset linestyle in Matplotlib dynamically based on certain conditions. Here’s an example of how to do this:
import matplotlib.pyplot as plt
import numpy as np

x = np.linspace(0, 10, 100)
y = np.sin(x)

plt.figure(figsize=(10, 5))

for i in range(5):
    if i % 2 == 0:
        linestyle = '-'
    else:
        linestyle = '--'
    plt.plot(x, y + i, linestyle=linestyle, label=f'Line {i+1}')

plt.title('Dynamically Resetting Linestyle - how2matplotlib.com')
plt.xlabel('x')
plt.ylabel('y')
plt.legend()
plt.show()
Output:
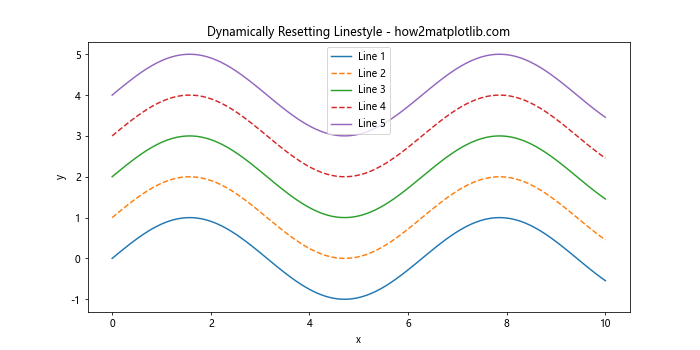
In this example, we dynamically reset the linestyle based on whether the line index is even or odd. This demonstrates how you can use conditional logic to reset linestyle in Matplotlib.
Resetting Linestyle with Custom Dash Patterns
Matplotlib allows you to create custom dash patterns for even more control over your linestyles. Here’s how you can reset linestyle in Matplotlib using custom dash patterns:
import matplotlib.pyplot as plt
import numpy as np

x = np.linspace(0, 10, 100)
y = np.sin(x)

plt.figure(figsize=(10, 5))

plt.plot(x, y, linestyle=(0, (5, 5)), label='Custom 1')
plt.plot(x, y + 1, linestyle=(0, (5, 1)), label='Custom 2')
plt.plot(x, y + 2, linestyle=(0, (1, 1)), label='Custom 3')

plt.title('Custom Dash Patterns - how2matplotlib.com')
plt.xlabel('x')
plt.ylabel('y')
plt.legend()
plt.show()
Output:
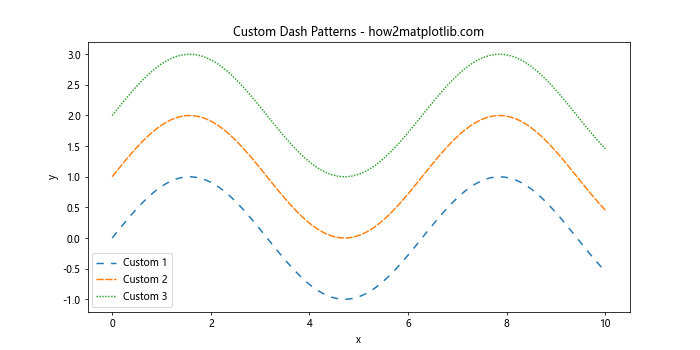
In this example, we use tuples to define custom dash patterns. The first number in each tuple is the offset, and the subsequent numbers define the lengths of the dashes and gaps. This gives you precise control over the appearance of your lines.
Resetting Linestyle for Specific Plot Types
Different types of plots in Matplotlib may require different approaches to resetting linestyle. Let’s look at how to reset linestyle for a few common plot types:
Resetting Linestyle for Scatter Plots
While scatter plots don’t have lines in the traditional sense, you can still control the appearance of the markers connecting the points. Here’s an example:
import matplotlib.pyplot as plt
import numpy as np

x = np.random.rand(50)
y = np.random.rand(50)

plt.scatter(x, y, c='blue', linestyle='--', marker='o')
plt.title('Scatter Plot with Custom Linestyle - how2matplotlib.com')
plt.xlabel('x')
plt.ylabel('y')
plt.show()
Output:
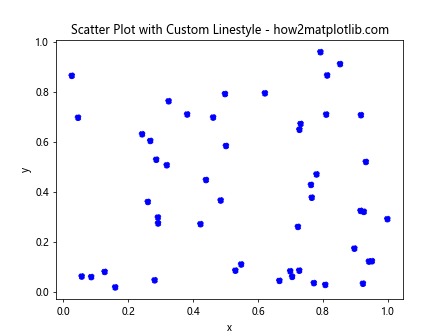
In this example, we use the linestyle parameter in the scatter() function to set a dashed line connecting the markers.
Resetting Linestyle for Bar Plots
For bar plots, you can control the linestyle of the bar edges. Here’s how:
import matplotlib.pyplot as plt
import numpy as np

categories = ['A', 'B', 'C', 'D']
values = [3, 7, 2, 5]

plt.bar(categories, values, edgecolor='black', linestyle='--', linewidth=2)
plt.title('Bar Plot with Custom Edge Linestyle - how2matplotlib.com')
plt.xlabel('Categories')
plt.ylabel('Values')
plt.show()
Output:
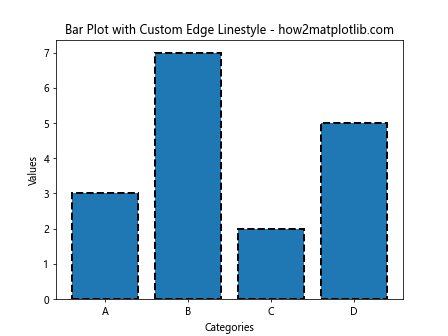
In this example, we use the linestyle parameter to set a dashed line for the edges of the bars.
Advanced Techniques for Resetting Linestyle in Matplotlib
As you become more proficient with Matplotlib, you might want to explore more advanced techniques for resetting linestyle. Let’s look at a few of these:
Using LineCollection for Complex Linestyles
For more complex scenarios, you can use LineCollection to have fine-grained control over the linestyle of each segment of a line:
import matplotlib.pyplot as plt
import numpy as np
from matplotlib.collections import LineCollection

x = np.linspace(0, 10, 100)
y = np.sin(x)

points = np.array([x, y]).T.reshape(-1, 1, 2)
segments = np.concatenate([points[:-1], points[1:]], axis=1)

lc = LineCollection(segments, linestyles=['solid', 'dashed', 'dotted', 'dashdot']*25)

fig, ax = plt.subplots()
ax.add_collection(lc)
ax.autoscale()
ax.margins(0.1)

plt.title('Complex Linestyles with LineCollection - how2matplotlib.com')
plt.show()
Output:
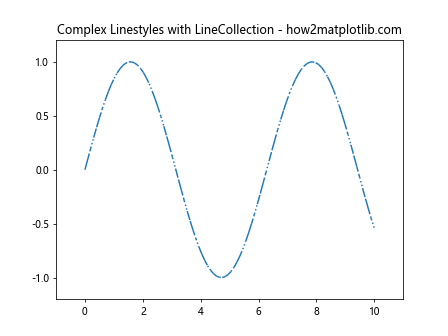
In this example, we create a LineCollection where each segment of the line has a different linestyle. This allows for very detailed control over the appearance of your lines.
Animating Linestyle Changes
You can create animations that show linestyle changes over time. Here’s a simple example:
import matplotlib.pyplot as plt
import numpy as np
from matplotlib.animation import FuncAnimation

x = np.linspace(0, 10, 100)
y = np.sin(x)

fig, ax = plt.subplots()
line, = ax.plot(x, y)

def update(frame):
    linestyles = ['-', '--', ':', '-.']
    line.set_linestyle(linestyles[frame % 4])
    return line,

ani = FuncAnimation(fig, update, frames=20, interval=500, blit=True)
plt.title('Animated Linestyle Changes - how2matplotlib.com')
plt.show()
Output:
This animation cycles through different linestyles, demonstrating how you can dynamically reset linestyle in Matplotlib.
Best Practices for Resetting Linestyle in Matplotlib
When working with Matplotlib reset linestyle techniques, it’s important to keep some best practices in mind:
- Consistency: Try to maintain a consistent style throughout your visualization. If you’re resetting linestyles, make sure it serves a purpose and doesn’t confuse the viewer.
Readability: Always prioritize readability. Sometimes, simpler linestyles are better for conveying information clearly.
Color Blindness: Consider using different linestyles in addition to colors to make yourplots accessible to color-blind individuals.
Documentation: If you’re using complex or custom linestyles, make sure to document what each style represents in your plot’s legend or caption.
Performance: Be mindful that using many different linestyles or very complex custom styles can impact the rendering performance of your plots.
Let’s look at an example that incorporates some of these best practices: