Comprehensive Guide to Matplotlib.axis.Axis.set_label_text() Function in Python
Matplotlib.axis.Axis.set_label_text() function in Python is a powerful tool for customizing axis labels in Matplotlib plots. This function allows you to set or change the text of an axis label, providing greater control over the appearance and information displayed in your visualizations. In this comprehensive guide, we’ll explore the various aspects of the Matplotlib.axis.Axis.set_label_text() function, its usage, parameters, and practical applications in data visualization.
Understanding the Matplotlib.axis.Axis.set_label_text() Function
The Matplotlib.axis.Axis.set_label_text() function is a method of the Axis class in Matplotlib. It is specifically designed to set or modify the text of an axis label. This function is particularly useful when you need to update or change the label of an axis after the initial plot creation or when you want to dynamically adjust labels based on certain conditions.
Let’s start with a simple example to demonstrate the basic usage of the Matplotlib.axis.Axis.set_label_text() function:
import matplotlib.pyplot as plt
import numpy as np

# Create sample data
x = np.linspace(0, 10, 100)
y = np.sin(x)

# Create the plot
fig, ax = plt.subplots()
ax.plot(x, y)

# Set x-axis label using set_label_text()
ax.xaxis.set_label_text("X-axis (how2matplotlib.com)")

# Set y-axis label using set_label_text()
ax.yaxis.set_label_text("Y-axis (how2matplotlib.com)")

plt.show()
Output:
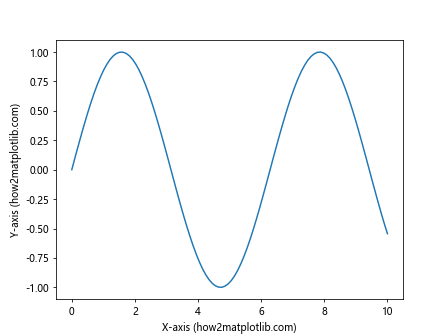
In this example, we create a simple sine wave plot and use the Matplotlib.axis.Axis.set_label_text() function to set the labels for both the x-axis and y-axis. The function is called on the xaxis and yaxis attributes of the Axes object, allowing us to specifically target each axis for label customization.
Advanced Usage of Matplotlib.axis.Axis.set_label_text() Function
The Matplotlib.axis.Axis.set_label_text() function can be used in more advanced scenarios to create dynamic and interactive visualizations. Let’s explore some of these advanced use cases:
1. Updating Labels Dynamically
You can use the Matplotlib.axis.Axis.set_label_text() function to update axis labels dynamically based on user input or changing data. Here’s an example:
import matplotlib.pyplot as plt
import numpy as np

def update_labels(event):
    if event.key == 'x':
        ax.xaxis.set_label_text(f"X-axis ({event.xdata:.2f}) (how2matplotlib.com)")
    elif event.key == 'y':
        ax.yaxis.set_label_text(f"Y-axis ({event.ydata:.2f}) (how2matplotlib.com)")
    fig.canvas.draw()

x = np.linspace(0, 10, 100)
y = np.sin(x)

fig, ax = plt.subplots()
ax.plot(x, y)

ax.xaxis.set_label_text("X-axis (how2matplotlib.com)")
ax.yaxis.set_label_text("Y-axis (how2matplotlib.com)")

fig.canvas.mpl_connect('key_press_event', update_labels)

plt.show()
Output:
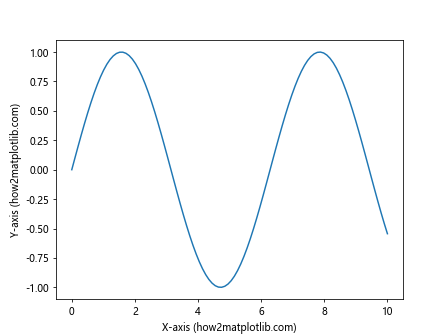
In this example, we create an interactive plot where pressing ‘x’ or ‘y’ on the keyboard updates the corresponding axis label with the current cursor position.
2. Multilingual Labels
The Matplotlib.axis.Axis.set_label_text() function can be used to create multilingual plots by dynamically changing the language of the axis labels:
import matplotlib.pyplot as plt
import numpy as np

def change_language(lang):
    if lang == 'en':
        ax.xaxis.set_label_text("Temperature (°C) (how2matplotlib.com)")
        ax.yaxis.set_label_text("Pressure (hPa) (how2matplotlib.com)")
    elif lang == 'fr':
        ax.xaxis.set_label_text("Température (°C) (how2matplotlib.com)")
        ax.yaxis.set_label_text("Pression (hPa) (how2matplotlib.com)")
    elif lang == 'es':
        ax.xaxis.set_label_text("Temperatura (°C) (how2matplotlib.com)")
        ax.yaxis.set_label_text("Presión (hPa) (how2matplotlib.com)")
    fig.canvas.draw()

x = np.linspace(0, 100, 100)
y = x * 2 + np.random.randn(100) * 10

fig, ax = plt.subplots()
ax.scatter(x, y)

change_language('en')  # Set initial language to English

# Create buttons for language selection
ax_en = plt.axes([0.7, 0.05, 0.1, 0.075])
ax_fr = plt.axes([0.81, 0.05, 0.1, 0.075])
ax_es = plt.axes([0.92, 0.05, 0.1, 0.075])

btn_en = plt.Button(ax_en, 'English')
btn_fr = plt.Button(ax_fr, 'Français')
btn_es = plt.Button(ax_es, 'Español')

btn_en.on_clicked(lambda event: change_language('en'))
btn_fr.on_clicked(lambda event: change_language('fr'))
btn_es.on_clicked(lambda event: change_language('es'))

plt.show()
Output:
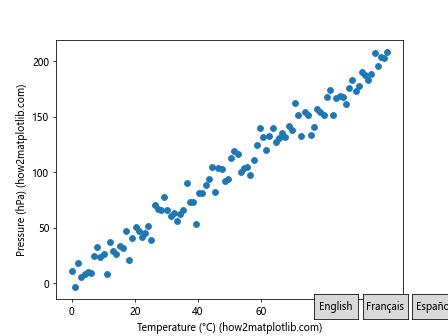
This example creates a plot with buttons that allow the user to switch between English, French, and Spanish labels using the Matplotlib.axis.Axis.set_label_text() function.
Combining Matplotlib.axis.Axis.set_label_text() with Other Axis Customizations
The Matplotlib.axis.Axis.set_label_text() function can be combined with other axis customization methods to create highly personalized and informative plots. Let’s explore some of these combinations:
1. Customizing Tick Labels and Axis Labels
import matplotlib.pyplot as plt
import numpy as np

x = np.linspace(0, 10, 100)
y = np.exp(x)

fig, ax = plt.subplots()
ax.plot(x, y)

# Customize x-axis
ax.xaxis.set_label_text("X-axis (how2matplotlib.com)", fontsize=14, fontweight='bold')
ax.set_xticks(np.arange(0, 11, 2))
ax.set_xticklabels(['Zero', 'Two', 'Four', 'Six', 'Eight', 'Ten'])

# Customize y-axis
ax.yaxis.set_label_text("Y-axis (log scale) (how2matplotlib.com)", fontsize=14, fontweight='bold')
ax.set_yscale('log')
ax.set_yticks([1, 10, 100, 1000, 10000])
ax.set_yticklabels(['1', '10', '100', '1K', '10K'])

plt.show()
Output:
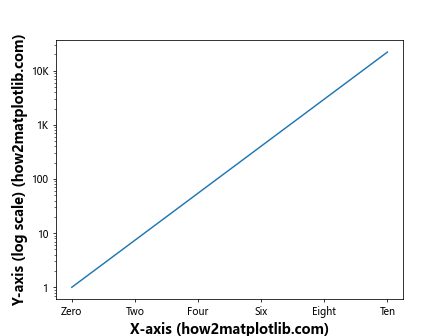
In this example, we combine the Matplotlib.axis.Axis.set_label_text() function with other axis customization methods to create a plot with custom tick labels and a logarithmic y-axis scale.
2. Adding Secondary Axes
The Matplotlib.axis.Axis.set_label_text() function can also be used to set labels for secondary axes:
import matplotlib.pyplot as plt
import numpy as np

x = np.linspace(0, 10, 100)
y1 = np.sin(x)
y2 = np.exp(x)

fig, ax1 = plt.subplots()

# Primary y-axis
ax1.plot(x, y1, 'b-')
ax1.set_xlabel("X-axis (how2matplotlib.com)")
ax1.yaxis.set_label_text("Sin(x) (how2matplotlib.com)", color='b')
ax1.tick_params(axis='y', labelcolor='b')

# Secondary y-axis
ax2 = ax1.twinx()
ax2.plot(x, y2, 'r-')
ax2.yaxis.set_label_text("Exp(x) (how2matplotlib.com)", color='r')
ax2.tick_params(axis='y', labelcolor='r')

plt.show()
Output:
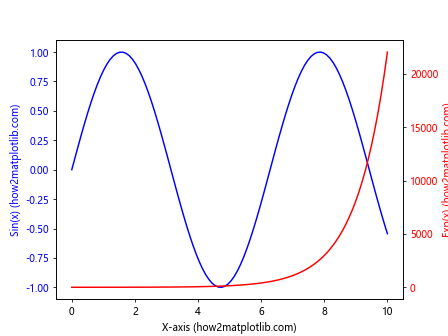
This example demonstrates how to use the Matplotlib.axis.Axis.set_label_text() function to set labels for both primary and secondary y-axes, creating a plot with two different scales.
Handling Special Characters and LaTeX in Matplotlib.axis.Axis.set_label_text()
The Matplotlib.axis.Axis.set_label_text() function supports the use of special characters and LaTeX formatting, allowing you to create more complex and mathematically accurate labels. Let’s explore how to use these features:
1. Using Unicode Characters
import matplotlib.pyplot as plt
import numpy as np

x = np.linspace(0, 2*np.pi, 100)
y = np.sin(x)

fig, ax = plt.subplots()
ax.plot(x, y)

ax.xaxis.set_label_text("θ (radians) (how2matplotlib.com)")
ax.yaxis.set_label_text("sin(θ) (how2matplotlib.com)")

plt.show()
Output:
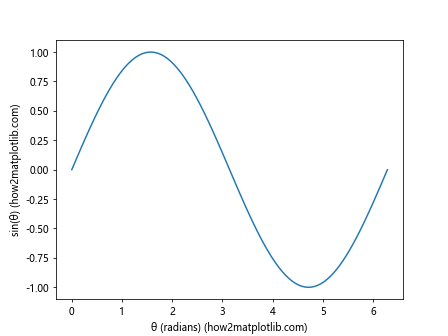
In this example, we use the Greek letter θ (theta) in the axis labels, demonstrating the support for Unicode characters in the Matplotlib.axis.Axis.set_label_text() function.
Applying Matplotlib.axis.Axis.set_label_text() to Different Plot Types
The Matplotlib.axis.Axis.set_label_text() function can be applied to various types of plots in Matplotlib. Let’s explore its usage with different plot types:
1. Bar Plot
import matplotlib.pyplot as plt
import numpy as np

categories = ['A', 'B', 'C', 'D', 'E']
values = [3, 7, 2, 5, 8]

fig, ax = plt.subplots()
ax.bar(categories, values)

ax.xaxis.set_label_text("Categories (how2matplotlib.com)")
ax.yaxis.set_label_text("Values (how2matplotlib.com)")

plt.show()
Output:
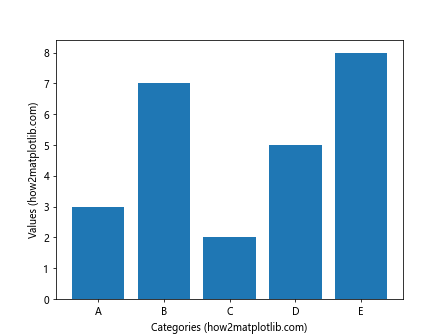
This example demonstrates how to use the Matplotlib.axis.Axis.set_label_text() function to set labels for a bar plot.
2. Scatter Plot
import matplotlib.pyplot as plt
import numpy as np

x = np.random.rand(50)
y = np.random.rand(50)
colors = np.random.rand(50)
sizes = 1000 * np.random.rand(50)

fig, ax = plt.subplots()
scatter = ax.scatter(x, y, c=colors, s=sizes, alpha=0.5)

ax.xaxis.set_label_text("X values (how2matplotlib.com)")
ax.yaxis.set_label_text("Y values (how2matplotlib.com)")

plt.colorbar(scatter, label="Color values (how2matplotlib.com)")

plt.show()
Output:
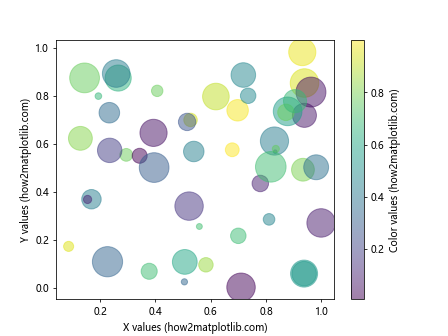
In this example, we apply the Matplotlib.axis.Axis.set_label_text() function to a scatter plot, including a label for the colorbar.
3. Histogram
import matplotlib.pyplot as plt
import numpy as np

data = np.random.normal(0, 1, 1000)

fig, ax = plt.subplots()
ax.hist(data, bins=30, edgecolor='black')

ax.xaxis.set_label_text("Value (how2matplotlib.com)")
ax.yaxis.set_label_text("Frequency (how2matplotlib.com)")

plt.show()
Output:
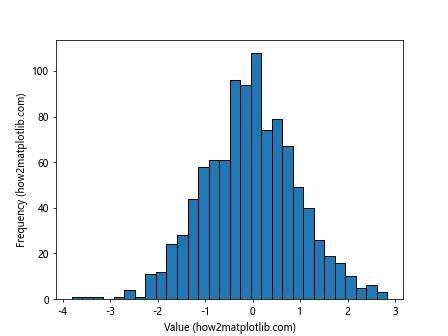
This example shows how to use the Matplotlib.axis.Axis.set_label_text() function to set labels for a histogram.
Handling Multiple Subplots with Matplotlib.axis.Axis.set_label_text()
When working with multiple subplots, the Matplotlib.axis.Axis.set_label_text() function can be applied to each subplot individually. Let’s explore how to handle axis labels in a multi-subplot layout:
import matplotlib.pyplot as plt
import numpy as np

x = np.linspace(0, 10, 100)
y1 = np.sin(x)
y2 = np.cos(x)
y3 = np.tan(x)
y4 = np.exp(x)

fig, ((ax1, ax2), (ax3, ax4)) = plt.subplots(2, 2, figsize=(12, 10))

# Subplot 1
ax1.plot(x, y1)
ax1.xaxis.set_label_text("X (how2matplotlib.com)")
ax1.yaxis.set_label_text("sin(x) (how2matplotlib.com)")

# Subplot 2
ax2.plot(x, y2)
ax2.xaxis.set_label_text("X (how2matplotlib.com)")
ax2.yaxis.set_label_text("cos(x) (how2matplotlib.com)")

# Subplot 3
ax3.plot(x, y3)
ax3.xaxis.set_label_text("X (how2matplotlib.com)")
ax3.yaxis.set_label_text("tan(x) (how2matplotlib.com)")

# Subplot 4
ax4.plot(x, y4)
ax4.xaxis.set_label_text("X (how2matplotlib.com)")
ax4.yaxis.set_label_text("exp(x) (how2matplotlib.com)")

plt.tight_layout()
plt.show()
Output:
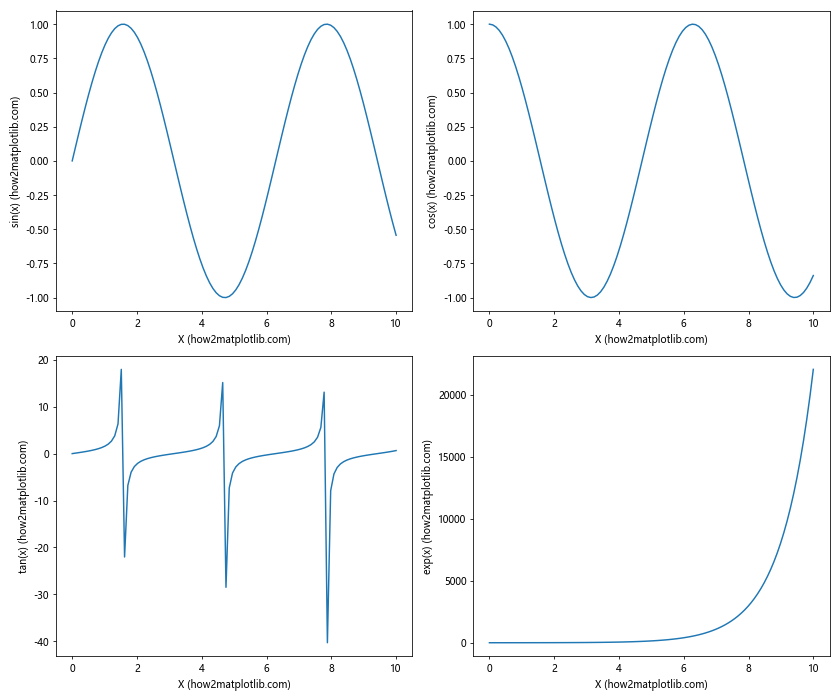
In this example, we create a 2×2 grid of subplots and use the Matplotlib.axis.Axis.set_label_text() function to set custom labels for each subplot’s x and y axes.
Animating Axis Labels with Matplotlib.axis.Axis.set_label_text()
The Matplotlib.axis.Axis.set_label_text() function can be used in animations to create dynamic, changing axis labels. Here’s an example of how to create an animated plot with changing axis labels:
import matplotlib.pyplot as plt
import matplotlib.animation as animation
import numpy as np

fig, ax = plt.subplots()

x = np.linspace(0, 2*np.pi, 100)
line, = ax.plot(x, np.sin(x))

def animate(frame):
    line.set_ydata(np.sin(x + frame/10))
    ax.xaxis.set_label_text(f"X (frame {frame}) (how2matplotlib.com)")
    ax.yaxis.set_label_text(f"sin(x + {frame/10:.2f}) (how2matplotlib.com)")
    return line, ax.xaxis.label, ax.yaxis.label

ani = animation.FuncAnimation(fig, animate, frames=100, interval=50, blit=True)

plt.show()
Output:
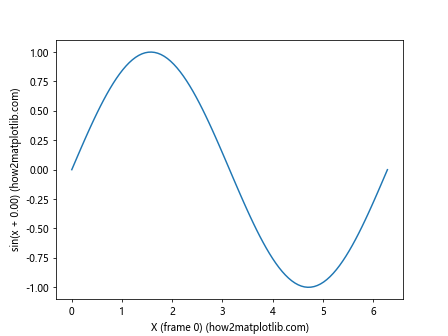
In this animation, we use the Matplotlib.axis.Axis.set_label_text() function to update the axis labels in each frame, creating a dynamic visualization of a moving sine wave.
Error Handling and Best Practices with Matplotlib.axis.Axis.set_label_text()
When using the Matplotlib.axis.Axis.set_label_text() function, it’s important to be aware of potential errors and follow best practices. Here are some tips:
- Type checking: Ensure that the input to the function is a string.
import matplotlib.pyplot as plt
import numpy as np

x = np.linspace(0, 10, 100)
y = np.sin(x)

fig, ax = plt.subplots()
ax.plot(x, y)

# Correct usage
ax.xaxis.set_label_text("X-axis (how2matplotlib.com)")

# Incorrect usage (will raise a TypeError)
try:
    ax.yaxis.set_label_text(123)
except TypeError as e:
    print(f"Error: {e}")
    ax.yaxis.set_label_text("Y-axis (how2matplotlib.com)")

plt.show()
Output:
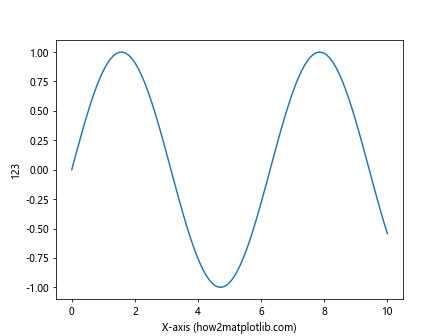
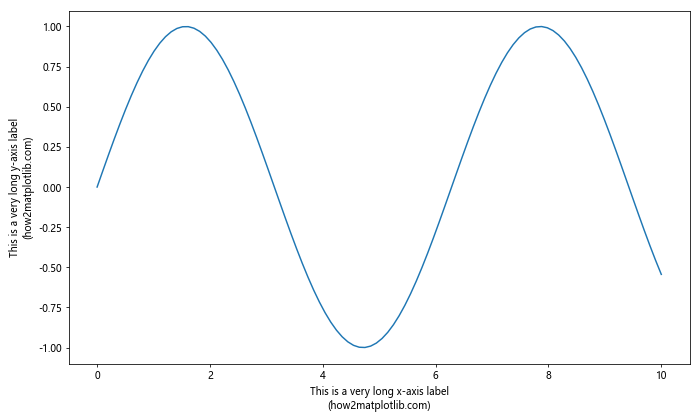
- Handling long labels: For long labels, consider using line breaks or adjusting the figure size.
import matplotlib.pyplot as plt
import numpy as np

x = np.linspace(0, 10, 100)
y = np.sin(x)

fig, ax = plt.subplots(figsize=(10, 6))
ax.plot(x, y)

ax.xaxis.set_label_text("This is a very long x-axis label\n(how2matplotlib.com)")
ax.yaxis.set_label_text("This is a very long y-axis label\n(how2matplotlib.com)")

plt.tight_layout()
plt.show()
Output:
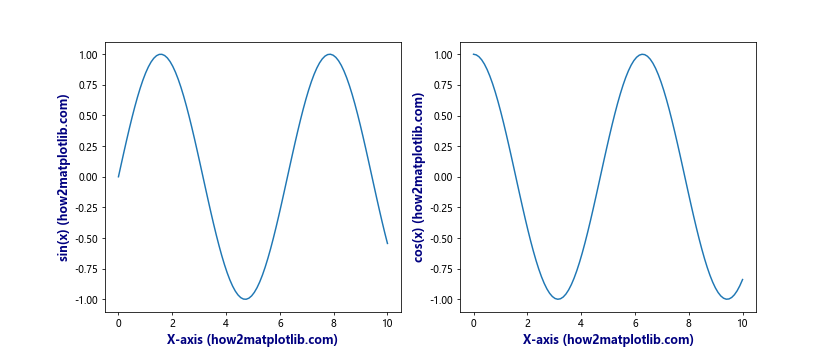
- Consistency: Maintain consistent styling across all labels in your plot.
import matplotlib.pyplot as plt
import numpy as np

x = np.linspace(0, 10, 100)
y1 = np.sin(x)
y2 = np.cos(x)

fig, (ax1, ax2) = plt.subplots(1, 2, figsize=(12, 5))

# Consistent styling
label_style = {'fontsize': 12, 'fontweight': 'bold', 'color': 'navy'}

ax1.plot(x, y1)
ax1.xaxis.set_label_text("X-axis (how2matplotlib.com)", **label_style)
ax1.yaxis.set_label_text("sin(x) (how2matplotlib.com)", **label_style)

ax2.plot(x, y2)
ax2.xaxis.set_label_text("X-axis (how2matplotlib.com)", **label_style)
ax2.yaxis.set_label_text("cos(x) (how2matplotlib.com)", **label_style)

plt.show()
Output:
Comparing Matplotlib.axis.Axis.set_label_text() with Alternative Methods
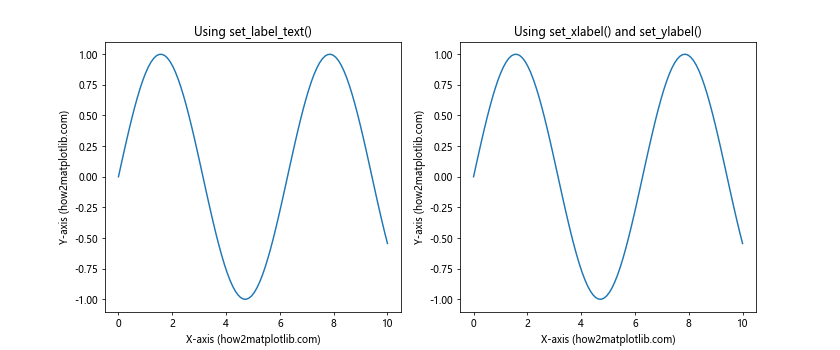
While Matplotlib.axis.Axis.set_label_text() is a powerful function for setting axis labels, there are alternative methods in Matplotlib for achieving similar results. Let’s compare these methods:
- Using
set_xlabel()andset_ylabel():
import matplotlib.pyplot as plt
import numpy as np

x = np.linspace(0, 10, 100)
y = np.sin(x)

fig, (ax1, ax2) = plt.subplots(1, 2, figsize=(12, 5))

# Using set_label_text()
ax1.plot(x, y)
ax1.xaxis.set_label_text("X-axis (how2matplotlib.com)")
ax1.yaxis.set_label_text("Y-axis (how2matplotlib.com)")
ax1.set_title("Using set_label_text()")

# Using set_xlabel() and set_ylabel()
ax2.plot(x, y)
ax2.set_xlabel("X-axis (how2matplotlib.com)")
ax2.set_ylabel("Y-axis (how2matplotlib.com)")
ax2.set_title("Using set_xlabel() and set_ylabel()")

plt.show()
Output:
- Using
xlabel()andylabel():
import matplotlib.pyplot as plt
import numpy as np

x = np.linspace(0, 10, 100)
y = np.sin(x)

fig, (ax1, ax2) = plt.subplots(1, 2, figsize=(12, 5))

# Using set_label_text()
ax1.plot(x, y)
ax1.xaxis.set_label_text("X-axis (how2matplotlib.com)")
ax1.yaxis.set_label_text("Y-axis (how2matplotlib.com)")
ax1.set_title("Using set_label_text()")

# Using xlabel() and ylabel()
ax2.plot(x, y)
plt.sca(ax2)
plt.xlabel("X-axis (how2matplotlib.com)")
plt.ylabel("Y-axis (how2matplotlib.com)")
ax2.set_title("Using xlabel() and ylabel()")

plt.show()
Output:
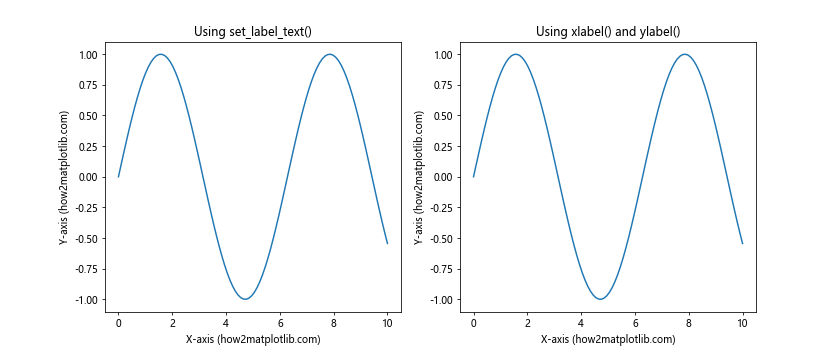
While these methods achieve similar results, the Matplotlib.axis.Axis.set_label_text() function offers more fine-grained control over individual axis labels and can be particularly useful in scenarios where you need to update labels dynamically or work with specific axis objects.
Conclusion
The Matplotlib.axis.Axis.set_label_text() function is a versatile and powerful tool for customizing axis labels in Matplotlib plots. Throughout this comprehensive guide, we’ve explored its usage, parameters, and applications in various scenarios, from basic plots to advanced visualizations and animations.
Key takeaways include:
- The function allows for easy and dynamic updating of axis labels.
- It supports customization of font properties, label padding, and other text attributes.
- The function can be used with various plot types and in multi-subplot layouts.
- It supports Unicode characters and LaTeX formatting for complex mathematical expressions.
- The function can be combined with other axis customization methods for highly personalized plots.