How to Use Matplotlib.axis.Axis.set_major_formatter() Function in Python
Matplotlib.axis.Axis.set_major_formatter() function in Python is a powerful tool for customizing the formatting of tick labels on plot axes. This function allows you to control how the major tick labels are displayed, providing flexibility in presenting numerical data, dates, and other types of information on your plots. In this comprehensive guide, we’ll explore the various aspects of the Matplotlib.axis.Axis.set_major_formatter() function, its usage, and provide numerous examples to help you master this essential feature of Matplotlib.
Understanding the Basics of Matplotlib.axis.Axis.set_major_formatter()
The Matplotlib.axis.Axis.set_major_formatter() function is part of the Matplotlib library, which is widely used for creating static, animated, and interactive visualizations in Python. This particular function is specifically designed to set the formatter for the major tick labels on an axis. By using Matplotlib.axis.Axis.set_major_formatter(), you can customize how these labels appear, making your plots more informative and visually appealing.
To get started with Matplotlib.axis.Axis.set_major_formatter(), you’ll need to import the necessary modules and create a basic plot. Here’s a simple example to illustrate this:
import matplotlib.pyplot as plt
import numpy as np

# Create sample data
x = np.linspace(0, 10, 100)
y = np.sin(x)

# Create a plot
fig, ax = plt.subplots()
ax.plot(x, y)

# Set the major formatter
ax.xaxis.set_major_formatter(plt.FuncFormatter(lambda x, p: f"how2matplotlib.com_{x:.1f}"))

plt.show()
Output:
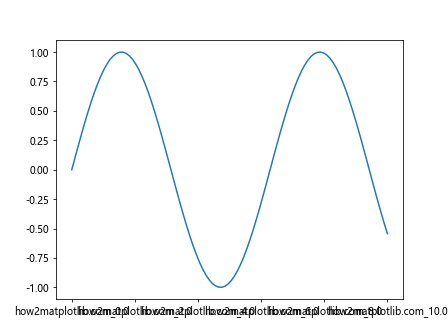
In this example, we’ve used Matplotlib.axis.Axis.set_major_formatter() to add a custom prefix to the x-axis labels. This demonstrates the basic usage of the function and how it can be applied to modify tick labels.
Exploring Different Formatter Types
Matplotlib.axis.Axis.set_major_formatter() supports various types of formatters, each serving different purposes. Let’s explore some of the most commonly used formatter types:
1. FuncFormatter
The FuncFormatter is a versatile option that allows you to define a custom function to format the tick labels. This is particularly useful when you need complete control over the label format.
import matplotlib.pyplot as plt
import numpy as np

def custom_formatter(x, pos):
    return f"how2matplotlib.com_{x:.2f}"

x = np.linspace(0, 10, 100)
y = np.cos(x)

fig, ax = plt.subplots()
ax.plot(x, y)
ax.xaxis.set_major_formatter(plt.FuncFormatter(custom_formatter))

plt.show()
Output:
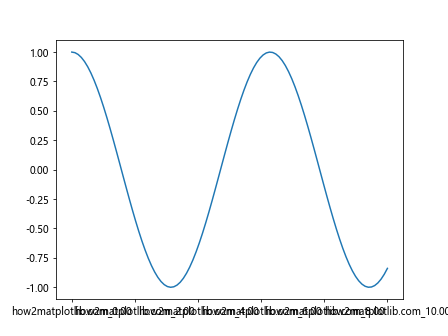
In this example, we’ve defined a custom formatter function that adds a prefix and formats the number to two decimal places.
Customizing Date and Time Formats
Matplotlib.axis.Axis.set_major_formatter() is particularly useful when working with date and time data. The DateFormatter allows you to specify custom date formats for your tick labels.
import matplotlib.pyplot as plt
import matplotlib.dates as mdates
import numpy as np
from datetime import datetime, timedelta

start_date = datetime(2023, 1, 1)
dates = [start_date + timedelta(days=i) for i in range(100)]
values = np.random.randn(100).cumsum()

fig, ax = plt.subplots(figsize=(10, 6))
ax.plot(dates, values)

date_formatter = mdates.DateFormatter("%Y-%m-%d\nhow2matplotlib.com")
ax.xaxis.set_major_formatter(date_formatter)
plt.xticks(rotation=45)

plt.title("Custom Date Formatting Example")
plt.show()
Output:
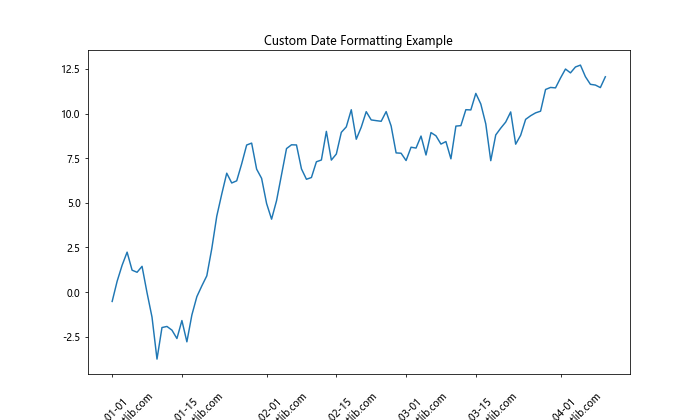
In this example, we’ve used the DateFormatter to display dates in a custom format, including our website name.
Handling Large Numbers with ScalarFormatter
When dealing with large numbers, the ScalarFormatter can be useful for displaying tick labels in scientific notation or with appropriate scaling.
import matplotlib.pyplot as plt
import numpy as np

x = np.linspace(1e6, 1e9, 100)
y = np.log(x)

fig, ax = plt.subplots()
ax.plot(x, y)

formatter = plt.ScalarFormatter(useMathText=True)
formatter.set_scientific(True)
formatter.set_powerlimits((-2, 2))
ax.xaxis.set_major_formatter(formatter)

plt.title("how2matplotlib.com Large Number Formatting")
plt.show()
Output:
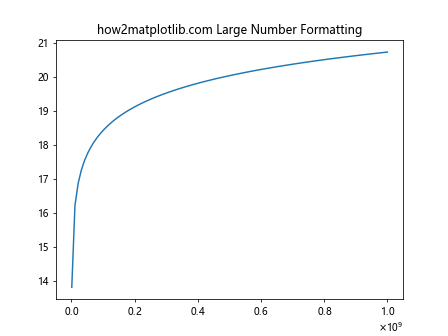
This example demonstrates how to use the ScalarFormatter to handle large numbers on the x-axis.
Combining Multiple Formatters
In some cases, you might want to use different formatters for different parts of your plot. Matplotlib.axis.Axis.set_major_formatter() allows you to achieve this by applying formatters to specific axes.
import matplotlib.pyplot as plt
import numpy as np

fig, (ax1, ax2) = plt.subplots(2, 1, figsize=(8, 10))

x = np.linspace(0, 10, 100)
y1 = np.sin(x)
y2 = np.exp(x)

ax1.plot(x, y1)
ax2.plot(x, y2)

ax1.xaxis.set_major_formatter(plt.FuncFormatter(lambda x, p: f"how2matplotlib.com_{x:.1f}"))
ax2.yaxis.set_major_formatter(plt.StrMethodFormatter("{x:.2e}"))

plt.tight_layout()
plt.show()
In this example, we’ve applied different formatters to the x-axis of the first subplot and the y-axis of the second subplot.
Customizing Tick Locations with Matplotlib.axis.Axis.set_major_formatter()
While Matplotlib.axis.Axis.set_major_formatter() primarily deals with formatting tick labels, it’s often used in conjunction with functions that control tick locations. Let’s explore how to combine these features:
import matplotlib.pyplot as plt
import numpy as np

x = np.linspace(0, 10, 100)
y = np.sin(x)

fig, ax = plt.subplots()
ax.plot(x, y)

ax.xaxis.set_major_locator(plt.MultipleLocator(2))
ax.xaxis.set_major_formatter(plt.FuncFormatter(lambda x, p: f"how2matplotlib.com\n{x:.1f}"))

plt.show()
Output:
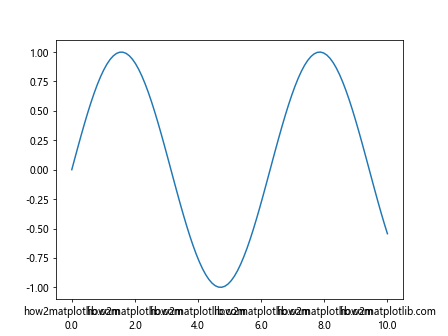
In this example, we’ve combined Matplotlib.axis.Axis.set_major_formatter() with set_major_locator() to control both the position and format of the tick labels.
Using Matplotlib.axis.Axis.set_major_formatter() with Logarithmic Scales
Matplotlib.axis.Axis.set_major_formatter() can be particularly useful when working with logarithmic scales. Here’s an example of how to format tick labels on a log scale:
import matplotlib.pyplot as plt
import numpy as np

x = np.logspace(0, 5, 100)
y = x ** 2

fig, ax = plt.subplots()
ax.loglog(x, y)

def log_formatter(x, pos):
    return f"how2matplotlib.com\n$10^{{{int(np.log10(x))}}}$"

ax.xaxis.set_major_formatter(plt.FuncFormatter(log_formatter))
ax.yaxis.set_major_formatter(plt.FuncFormatter(log_formatter))

plt.show()
Output:
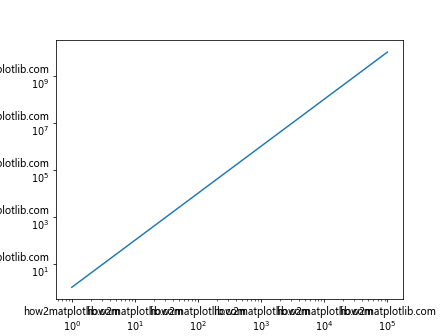
This example demonstrates how to create custom log-scale labels using Matplotlib.axis.Axis.set_major_formatter().
Formatting Currency Values with Matplotlib.axis.Axis.set_major_formatter()
When working with financial data, you might want to display currency values on your axes. Here’s how you can use Matplotlib.axis.Axis.set_major_formatter() to achieve this:
import matplotlib.pyplot as plt
import numpy as np

x = np.linspace(0, 10, 100)
y = 1000 * np.exp(x / 5)

fig, ax = plt.subplots()
ax.plot(x, y)

def currency_formatter(x, pos):
    return f"${x:,.0f}\nhow2matplotlib.com"

ax.yaxis.set_major_formatter(plt.FuncFormatter(currency_formatter))

plt.title("Currency Formatting Example")
plt.show()
Output:
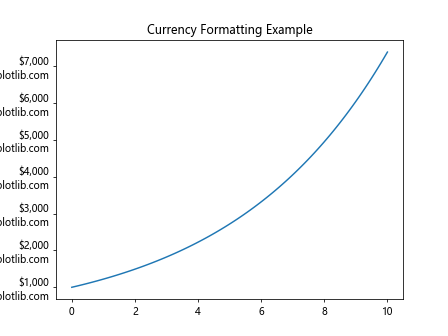
This example shows how to format y-axis labels as currency values using a custom formatter function.
Handling Categorical Data with Matplotlib.axis.Axis.set_major_formatter()
While Matplotlib.axis.Axis.set_major_formatter() is often used with numerical data, it can also be applied to categorical data. Here’s an example:
import matplotlib.pyplot as plt
import numpy as np

categories = ['A', 'B', 'C', 'D', 'E']
values = np.random.rand(5)

fig, ax = plt.subplots()
ax.bar(categories, values)

def category_formatter(x, pos):
    cat = categories[int(x)] if 0 <= int(x) < len(categories) else ''
    return f"{cat}\nhow2matplotlib.com"

ax.xaxis.set_major_formatter(plt.FuncFormatter(category_formatter))
ax.xaxis.set_major_locator(plt.FixedLocator(range(len(categories))))

plt.show()
Output:
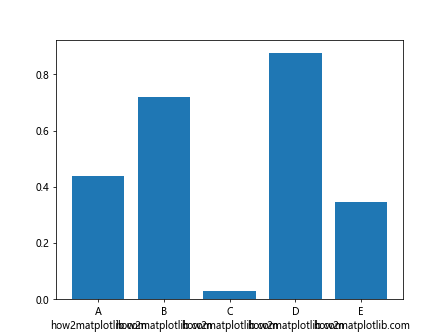
This example demonstrates how to use Matplotlib.axis.Axis.set_major_formatter() to display category labels on a bar chart.
Advanced Techniques with Matplotlib.axis.Axis.set_major_formatter()
As you become more comfortable with Matplotlib.axis.Axis.set_major_formatter(), you can explore more advanced techniques. Let's look at a few examples:
1. Dynamic Formatting Based on Zoom Level
You can create formatters that adjust based on the current zoom level of the plot:
import matplotlib.pyplot as plt
import numpy as np

x = np.linspace(0, 10, 1000)
y = np.sin(x)

fig, ax = plt.subplots()
ax.plot(x, y)

def zoom_formatter(x, pos):
    xmin, xmax = ax.get_xlim()
    range = xmax - xmin
    if range < 1:
        return f"how2matplotlib.com\n{x:.3f}"
    elif range < 10:
        return f"how2matplotlib.com\n{x:.2f}"
    else:
        return f"how2matplotlib.com\n{x:.1f}"

ax.xaxis.set_major_formatter(plt.FuncFormatter(zoom_formatter))

plt.show()
Output:
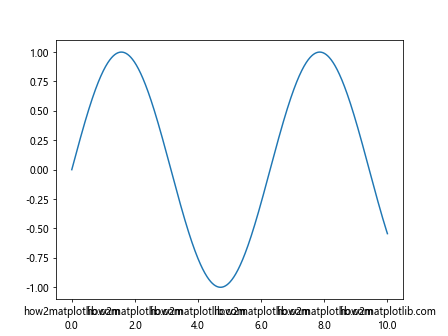
This formatter adjusts the number of decimal places based on the current x-axis range.
2. Combining Multiple Formats
You can create complex formatters that combine different types of information:
import matplotlib.pyplot as plt
import numpy as np
from datetime import datetime, timedelta

start_date = datetime(2023, 1, 1)
dates = [start_date + timedelta(days=i) for i in range(100)]
values = np.random.randn(100).cumsum()

fig, ax = plt.subplots(figsize=(12, 6))
ax.plot(dates, values)

def complex_formatter(x, pos):
    date = matplotlib.dates.num2date(x)
    value = np.interp(x, matplotlib.dates.date2num(dates), values)
    return f"{date:%Y-%m-%d}\n${value:.2f}\nhow2matplotlib.com"

ax.xaxis.set_major_formatter(plt.FuncFormatter(complex_formatter))
plt.xticks(rotation=45, ha='right')

plt.title("Complex Formatting Example")
plt.tight_layout()
plt.show()
This example creates a formatter that displays both the date and the corresponding y-value for each x-axis tick.
Best Practices for Using Matplotlib.axis.Axis.set_major_formatter()
When working with Matplotlib.axis.Axis.set_major_formatter(), keep these best practices in mind:
- Choose the appropriate formatter for your data type (e.g., DateFormatter for dates, PercentFormatter for percentages).
- Consider readability when formatting labels. Avoid cluttering the axis with too much information.
- Use custom formatters when built-in options don't meet your needs.
- Combine Matplotlib.axis.Axis.set_major_formatter() with other axis customization methods for complete control over your plot's appearance.
- Test your plots with different data ranges to ensure your formatting remains effective across various scenarios.
Troubleshooting Common Issues with Matplotlib.axis.Axis.set_major_formatter()
When using Matplotlib.axis.Axis.set_major_formatter(), you might encounter some common issues. Here are a few problems and their solutions:
1. Labels Not Updating
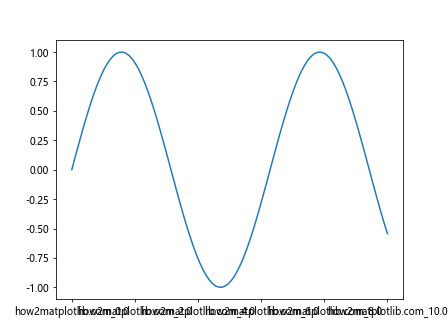
If your labels aren't updating after applying a new formatter, make sure you're calling plt.draw() or plt.show() after setting the formatter.
import matplotlib.pyplot as plt
import numpy as np

x = np.linspace(0, 10, 100)
y = np.sin(x)

fig, ax = plt.subplots()
ax.plot(x, y)

ax.xaxis.set_major_formatter(plt.FuncFormatter(lambda x, p: f"how2matplotlib.com_{x:.1f}"))

plt.draw()  # or plt.show()
Output:
2. Formatter Not Applied to the Correct Axis
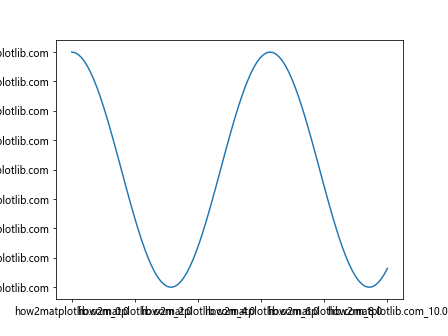
Ensure you're applying the formatter to the intended axis. Use ax.xaxis.set_major_formatter() for the x-axis and ax.yaxis.set_major_formatter() for the y-axis.
import matplotlib.pyplot as plt
import numpy as np

x = np.linspace(0, 10, 100)
y = np.cos(x)

fig, ax = plt.subplots()
ax.plot(x, y)

# Correct application to x-axis
ax.xaxis.set_major_formatter(plt.FuncFormatter(lambda x, p: f"how2matplotlib.com_{x:.1f}"))

# Correct application to y-axis
ax.yaxis.set_major_formatter(plt.FuncFormatter(lambda y, p: f"{y:.2f}_how2matplotlib.com"))

plt.show()
Output:
3. Formatter Function Errors
If your custom formatter function raises an error, the labels may not display correctly. Always include error handling in your formatter functions:
import matplotlib.pyplot as plt
import numpy as np

def safe_formatter(x, pos):
    try:
        return f"how2matplotlib.com_{x:.1f}"
    except:
        return ""

x = np.linspace(0, 10, 100)
y = np.tan(x)

fig, ax = plt.subplots()
ax.plot(x, y)

ax.xaxis.set_major_formatter(plt.FuncFormatter(safe_formatter))

plt.show()
Output:
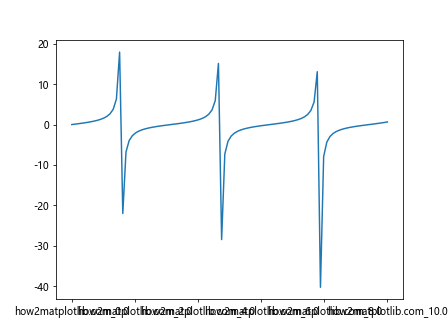
This example includes error handling to prevent crashes if the formatting fails.
Advanced Applications of Matplotlib.axis.Axis.set_major_formatter()
As you become more proficient with Matplotlib.axis.Axis.set_major_formatter(), you can explore more advanced applications. Let's look at some sophisticated uses of this function:
1. Creating Multi-line Labels
You can use Matplotlib.axis.Axis.set_major_formatter() to create multi-line labels, which can be useful for displaying additional information:
import matplotlib.pyplot as plt
import numpy as np

x = np.linspace(0, 10, 100)
y = np.sin(x)

fig, ax = plt.subplots(figsize=(10, 6))
ax.plot(x, y)

def multiline_formatter(x, pos):
    return f"x: {x:.1f}\ny: {np.sin(x):.2f}\nhow2matplotlib.com"

ax.xaxis.set_major_formatter(plt.FuncFormatter(multiline_formatter))
plt.xticks(rotation=45, ha='right')

plt.title("Multi-line Label Example")
plt.tight_layout()
plt.show()
Output:
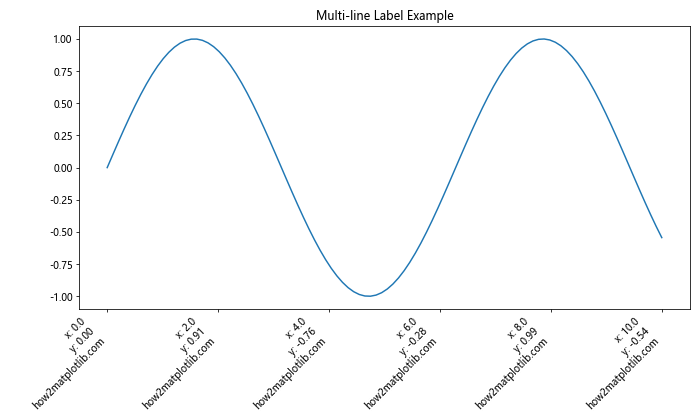
This example creates labels that show both x and y values, along with the website name.
2. Conditional Formatting
You can use conditional logic within your formatter to change the label format based on certain criteria:
import matplotlib.pyplot as plt
import numpy as np

x = np.linspace(0, 20, 200)
y = np.sin(x)

fig, ax = plt.subplots()
ax.plot(x, y)

def conditional_formatter(x, pos):
    if x < 5:
        return f"Low: {x:.1f}"
    elif x < 15:
        return f"Mid: {x:.1f}"
    else:
        return f"High: {x:.1f}\nhow2matplotlib.com"

ax.xaxis.set_major_formatter(plt.FuncFormatter(conditional_formatter))

plt.title("Conditional Formatting Example")
plt.show()
Output:
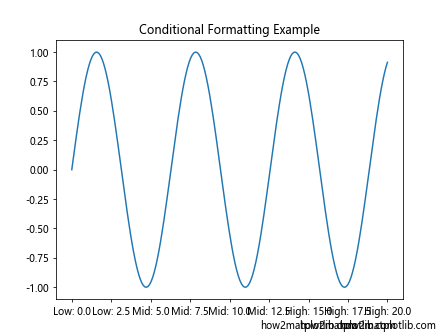
This example changes the label prefix based on the x-value range.
3. Integrating with External Data Sources
You can use Matplotlib.axis.Axis.set_major_formatter() to integrate data from external sources into your labels:
import matplotlib.pyplot as plt
import numpy as np

# Simulating an external data source
def get_external_data(x):
    return f"Data_{int(x)}"

x = np.linspace(0, 10, 100)
y = np.cos(x)

fig, ax = plt.subplots()
ax.plot(x, y)

def external_data_formatter(x, pos):
    return f"{get_external_data(x)}\n{x:.1f}\nhow2matplotlib.com"

ax.xaxis.set_major_formatter(plt.FuncFormatter(external_data_formatter))

plt.title("External Data Integration Example")
plt.show()
Output:
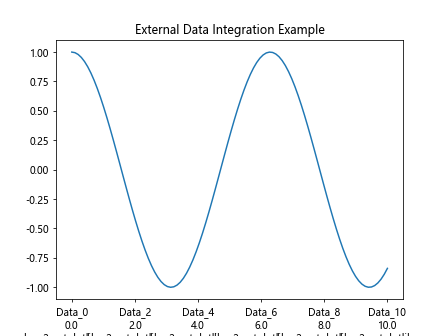
This example demonstrates how to incorporate data from an external source (simulated here) into your axis labels.
Matplotlib.axis.Axis.set_major_formatter() in Real-World Scenarios
Let's explore how Matplotlib.axis.Axis.set_major_formatter() can be applied in real-world scenarios:
1. Financial Data Visualization
When working with financial data, you might want to format your axis labels to represent currency and dates effectively:
import matplotlib.pyplot as plt
import numpy as np
from datetime import datetime, timedelta

# Simulating stock price data
start_date = datetime(2023, 1, 1)
dates = [start_date + timedelta(days=i) for i in range(100)]
prices = 100 + np.random.randn(100).cumsum()

fig, ax = plt.subplots(figsize=(12, 6))
ax.plot(dates, prices)

def date_price_formatter(x, pos):
    date = matplotlib.dates.num2date(x)
    price = np.interp(x, matplotlib.dates.date2num(dates), prices)
    return f"{date:%Y-%m-%d}\n${price:.2f}\nhow2matplotlib.com"

ax.xaxis.set_major_formatter(plt.FuncFormatter(date_price_formatter))
plt.xticks(rotation=45, ha='right')

plt.title("Stock Price Over Time")
plt.tight_layout()
plt.show()
This example formats the x-axis to show both the date and the corresponding stock price.
2. Scientific Data Representation
In scientific plots, you might need to display units or use scientific notation:
import matplotlib.pyplot as plt
import numpy as np

x = np.linspace(1e-9, 1e-6, 100)
y = x ** 2

fig, ax = plt.subplots()
ax.loglog(x, y)

def scientific_formatter(x, pos):
    exp = int(np.log10(x))
    coef = x / 10**exp
    return f"{coef:.1f}×10^{exp}\nhow2matplotlib.com"

ax.xaxis.set_major_formatter(plt.FuncFormatter(scientific_formatter))
ax.yaxis.set_major_formatter(plt.FuncFormatter(scientific_formatter))

plt.title("Scientific Notation Example")
plt.show()
Output:
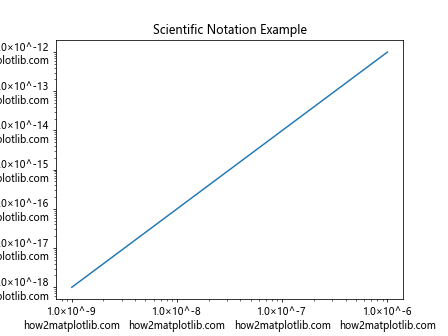
This example uses scientific notation for both axes, which is common in scientific and engineering plots.
Integrating Matplotlib.axis.Axis.set_major_formatter() with Other Matplotlib Features
Matplotlib.axis.Axis.set_major_formatter() can be effectively combined with other Matplotlib features to create more informative and visually appealing plots:
1. Combining with Colorbar Formatting
When using colorbars, you can apply custom formatting to the colorbar ticks:
import matplotlib.pyplot as plt
import numpy as np

data = np.random.rand(10, 10)

fig, ax = plt.subplots()
im = ax.imshow(data)

cbar = plt.colorbar(im)

def percentage_formatter(x, pos):
    return f"{x:.1%}\nhow2matplotlib.com"

cbar.ax.yaxis.set_major_formatter(plt.FuncFormatter(percentage_formatter))

plt.title("Colorbar Formatting Example")
plt.show()
Output:
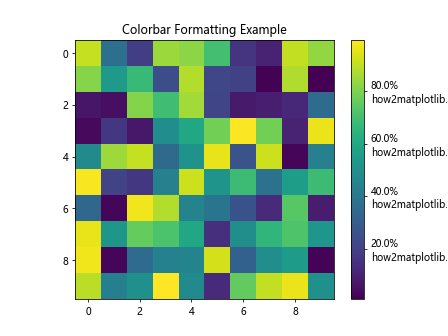
This example formats the colorbar labels as percentages.
2. Formatting in Subplots
When working with multiple subplots, you can apply different formatters to each subplot:
import matplotlib.pyplot as plt
import numpy as np

fig, (ax1, ax2) = plt.subplots(1, 2, figsize=(12, 5))

x = np.linspace(0, 10, 100)
y1 = np.sin(x)
y2 = np.exp(x)

ax1.plot(x, y1)
ax2.plot(x, y2)

ax1.xaxis.set_major_formatter(plt.FuncFormatter(lambda x, p: f"sin_{x:.1f}"))
ax2.yaxis.set_major_formatter(plt.FuncFormatter(lambda y, p: f"exp_{y:.1e}"))

ax1.set_title("Sine Function")
ax2.set_title("Exponential Function")

plt.tight_layout()
plt.show()
Output:
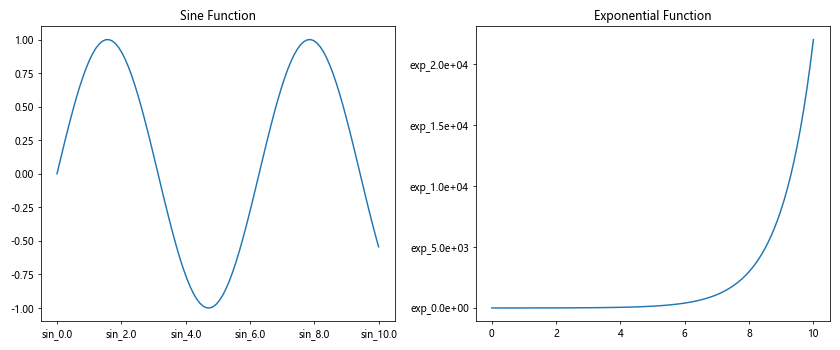
This example applies different formatters to the x-axis of the first subplot and the y-axis of the second subplot.
Conclusion
Matplotlib.axis.Axis.set_major_formatter() is a powerful function that allows you to customize the appearance of tick labels in your Matplotlib plots. By mastering this function, you can create more informative, readable, and visually appealing visualizations.
Throughout this guide, we've explored various aspects of Matplotlib.axis.Axis.set_major_formatter(), including:
- Basic usage and syntax
- Different types of formatters (FuncFormatter, StrMethodFormatter, PercentFormatter, etc.)
- Customizing date and time formats
- Handling large numbers and scientific notation
- Combining multiple formatters
- Advanced techniques like dynamic formatting and multi-line labels
- Best practices and troubleshooting common issues
- Real-world applications in financial and scientific data visualization