Comprehensive Guide to Matplotlib.axis.Axis.limit_range_for_scale() Function in Python
Matplotlib.axis.Axis.limit_range_for_scale() function in Python is an essential tool for data visualization enthusiasts and professionals alike. This function plays a crucial role in adjusting the range of an axis to accommodate the chosen scale. In this comprehensive guide, we’ll explore the intricacies of the Matplotlib.axis.Axis.limit_range_for_scale() function, its usage, and provide numerous examples to help you master this powerful feature.
Understanding the Matplotlib.axis.Axis.limit_range_for_scale() Function
The Matplotlib.axis.Axis.limit_range_for_scale() function is a method of the Axis class in Matplotlib. Its primary purpose is to adjust the range of an axis based on the selected scale. This function is particularly useful when working with different scale types, such as logarithmic or symlog scales, where the range needs to be adjusted to ensure proper visualization.
Let’s start with a simple example to demonstrate the basic usage of the Matplotlib.axis.Axis.limit_range_for_scale() function:
import matplotlib.pyplot as plt
import numpy as np

fig, ax = plt.subplots()
x = np.linspace(0, 10, 100)
y = np.exp(x)

ax.plot(x, y, label='Exponential Growth')
ax.set_yscale('log')
ax.set_title('How2matplotlib.com - Basic Usage of limit_range_for_scale()')

original_ylim = ax.get_ylim()
new_ylim = ax.yaxis.limit_range_for_scale(original_ylim[0], original_ylim[1])

ax.set_ylim(new_ylim)
ax.legend()
plt.show()
Output:
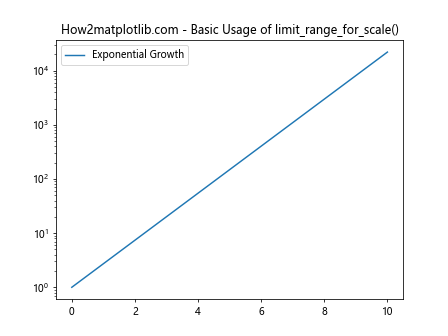
In this example, we create a simple exponential plot and set the y-axis to a logarithmic scale. We then use the limit_range_for_scale() function to adjust the y-axis limits based on the logarithmic scale.
Exploring the Parameters of Matplotlib.axis.Axis.limit_range_for_scale()
The Matplotlib.axis.Axis.limit_range_for_scale() function takes two main parameters:
- vmin: The minimum value of the range
- vmax: The maximum value of the range
These parameters represent the original range of the axis before adjustment. The function returns a tuple containing the adjusted minimum and maximum values.
Let’s look at an example that demonstrates how to use these parameters:
import matplotlib.pyplot as plt
import numpy as np

fig, ax = plt.subplots()
x = np.linspace(0, 10, 100)
y = np.sin(x)

ax.plot(x, y, label='Sine Wave')
ax.set_title('How2matplotlib.com - Using Parameters in limit_range_for_scale()')

original_xlim = ax.get_xlim()
new_xlim = ax.xaxis.limit_range_for_scale(original_xlim[0], original_xlim[1])

print(f"Original X-axis range: {original_xlim}")
print(f"Adjusted X-axis range: {new_xlim}")

ax.set_xlim(new_xlim)
ax.legend()
plt.show()
Output:
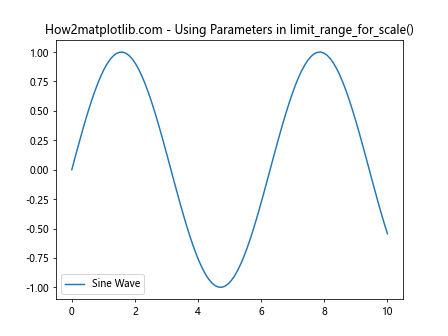
In this example, we plot a sine wave and use the limit_range_for_scale() function to adjust the x-axis range. We print both the original and adjusted ranges to see the difference.
Applying Matplotlib.axis.Axis.limit_range_for_scale() to Different Scales
The Matplotlib.axis.Axis.limit_range_for_scale() function is particularly useful when working with different scale types. Let’s explore how to use this function with various scales:
Logarithmic Scale
import matplotlib.pyplot as plt
import numpy as np

fig, ax = plt.subplots()
x = np.logspace(0, 5, 100)
y = x**2

ax.plot(x, y, label='Quadratic Growth')
ax.set_xscale('log')
ax.set_yscale('log')
ax.set_title('How2matplotlib.com - limit_range_for_scale() with Log Scale')

original_xlim = ax.get_xlim()
original_ylim = ax.get_ylim()

new_xlim = ax.xaxis.limit_range_for_scale(original_xlim[0], original_xlim[1])
new_ylim = ax.yaxis.limit_range_for_scale(original_ylim[0], original_ylim[1])

ax.set_xlim(new_xlim)
ax.set_ylim(new_ylim)
ax.legend()
plt.show()
Output:
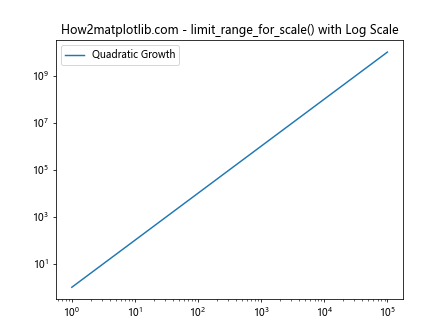
In this example, we use a logarithmic scale for both x and y axes and apply the limit_range_for_scale() function to adjust their ranges accordingly.
Symlog Scale
import matplotlib.pyplot as plt
import numpy as np

fig, ax = plt.subplots()
x = np.linspace(-10, 10, 100)
y = x**3

ax.plot(x, y, label='Cubic Function')
ax.set_yscale('symlog')
ax.set_title('How2matplotlib.com - limit_range_for_scale() with Symlog Scale')

original_ylim = ax.get_ylim()
new_ylim = ax.yaxis.limit_range_for_scale(original_ylim[0], original_ylim[1])

ax.set_ylim(new_ylim)
ax.legend()
plt.show()
Output:
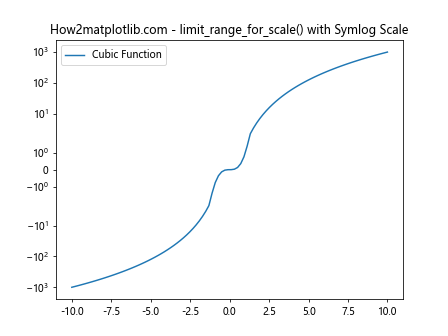
This example demonstrates the use of limit_range_for_scale() with a symlog scale, which is useful for data that spans both positive and negative orders of magnitude.
Combining Matplotlib.axis.Axis.limit_range_for_scale() with Other Axis Methods
The Matplotlib.axis.Axis.limit_range_for_scale() function can be used in conjunction with other axis methods to create more complex visualizations. Let’s explore some examples:
Using limit_range_for_scale() with set_xlim() and set_ylim()
import matplotlib.pyplot as plt
import numpy as np

fig, ax = plt.subplots()
x = np.linspace(0, 10, 100)
y = np.exp(x)

ax.plot(x, y, label='Exponential Growth')
ax.set_yscale('log')
ax.set_title('How2matplotlib.com - limit_range_for_scale() with set_xlim() and set_ylim()')

original_xlim = ax.get_xlim()
original_ylim = ax.get_ylim()

new_xlim = ax.xaxis.limit_range_for_scale(original_xlim[0], original_xlim[1])
new_ylim = ax.yaxis.limit_range_for_scale(original_ylim[0], original_ylim[1])

ax.set_xlim(new_xlim[0], new_xlim[1] * 1.2)  # Extend x-axis by 20%
ax.set_ylim(new_ylim[0] * 0.8, new_ylim[1])  # Reduce y-axis lower limit by 20%

ax.legend()
plt.show()
Output:
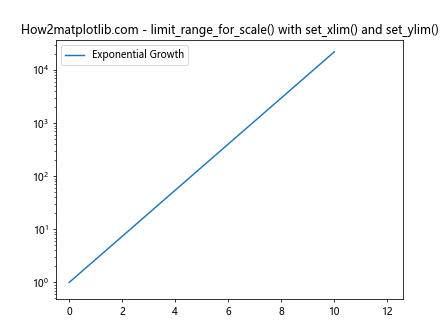
This example demonstrates how to combine limit_range_for_scale() with set_xlim() and set_ylim() to fine-tune the axis ranges.
Integrating limit_range_for_scale() with autoscale()
import matplotlib.pyplot as plt
import numpy as np

fig, ax = plt.subplots()
x = np.linspace(0, 10, 100)
y = np.sin(x) * np.exp(x/10)

ax.plot(x, y, label='Damped Oscillation')
ax.set_yscale('symlog')
ax.set_title('How2matplotlib.com - limit_range_for_scale() with autoscale()')

ax.autoscale(enable=True, axis='both', tight=True)

original_ylim = ax.get_ylim()
new_ylim = ax.yaxis.limit_range_for_scale(original_ylim[0], original_ylim[1])

ax.set_ylim(new_ylim)
ax.legend()
plt.show()
Output:
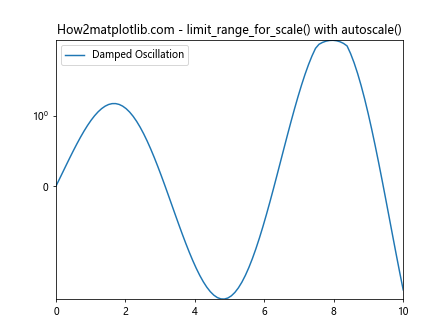
In this example, we use autoscale() to automatically set the initial axis limits, and then apply limit_range_for_scale() to adjust the y-axis range based on the symlog scale.
Advanced Applications of Matplotlib.axis.Axis.limit_range_for_scale()
Let’s explore some advanced applications of the Matplotlib.axis.Axis.limit_range_for_scale() function:
Multiple Subplots with Different Scales
import matplotlib.pyplot as plt
import numpy as np

fig, (ax1, ax2) = plt.subplots(1, 2, figsize=(12, 5))

x = np.linspace(0, 10, 100)
y1 = np.exp(x)
y2 = np.log(x + 1)

ax1.plot(x, y1, label='Exponential')
ax1.set_yscale('log')
ax1.set_title('How2matplotlib.com - Exponential Plot')

ax2.plot(x, y2, label='Logarithmic')
ax2.set_yscale('linear')
ax2.set_title('How2matplotlib.com - Logarithmic Plot')

for ax in (ax1, ax2):
    original_ylim = ax.get_ylim()
    new_ylim = ax.yaxis.limit_range_for_scale(original_ylim[0], original_ylim[1])
    ax.set_ylim(new_ylim)
    ax.legend()

plt.tight_layout()
plt.show()
Output:
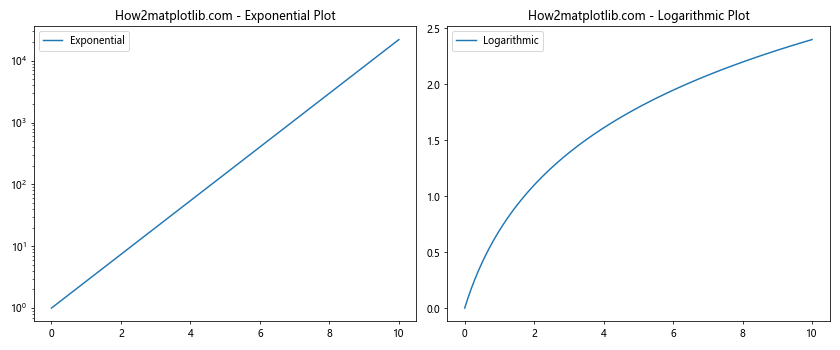
This example demonstrates how to use limit_range_for_scale() with multiple subplots, each having a different scale.
Common Pitfalls and Solutions when Using Matplotlib.axis.Axis.limit_range_for_scale()
While the Matplotlib.axis.Axis.limit_range_for_scale() function is powerful, there are some common pitfalls to be aware of:
Pitfall 1: Applying to Inappropriate Scales
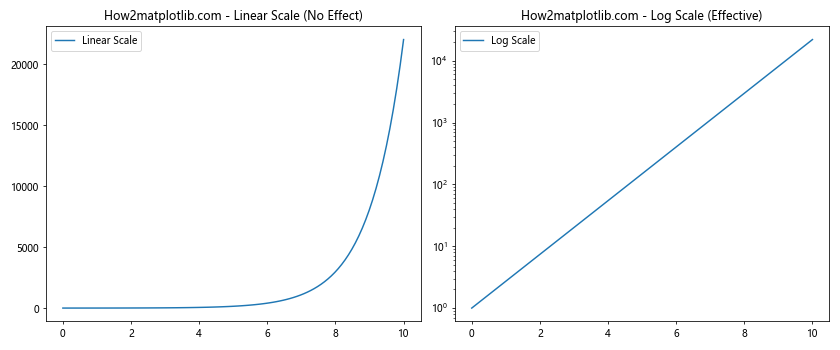
The limit_range_for_scale() function may not have a significant effect on linear scales. It’s primarily designed for non-linear scales like logarithmic or symlog.
Solution: Ensure you’re using the appropriate scale for your data before applying limit_range_for_scale().
import matplotlib.pyplot as plt
import numpy as np

fig, (ax1, ax2) = plt.subplots(1, 2, figsize=(12, 5))

x = np.linspace(0, 10, 100)
y = np.exp(x)

ax1.plot(x, y, label='Linear Scale')
ax1.set_title('How2matplotlib.com - Linear Scale (No Effect)')

ax2.plot(x, y, label='Log Scale')
ax2.set_yscale('log')
ax2.set_title('How2matplotlib.com - Log Scale (Effective)')

for ax in (ax1, ax2):
    original_ylim = ax.get_ylim()
    new_ylim = ax.yaxis.limit_range_for_scale(original_ylim[0], original_ylim[1])
    ax.set_ylim(new_ylim)
    ax.legend()

plt.tight_layout()
plt.show()
Output:
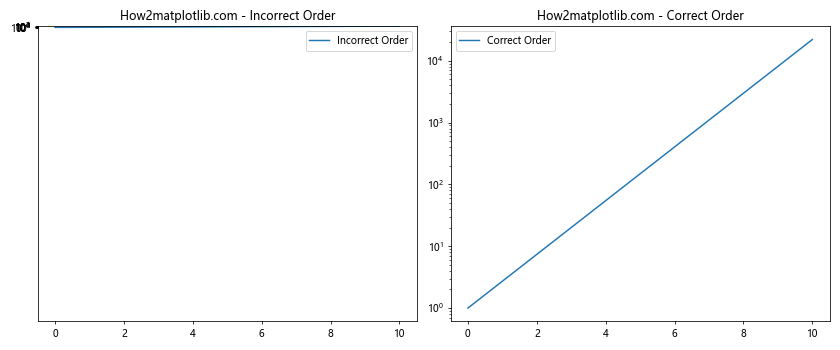
Pitfall 2: Incorrect Order of Operations
Applying limit_range_for_scale() before setting the scale can lead to unexpected results.
Solution: Always set the scale before calling limit_range_for_scale().
import matplotlib.pyplot as plt
import numpy as np

fig, (ax1, ax2) = plt.subplots(1, 2, figsize=(12, 5))

x = np.linspace(0, 10, 100)
y = np.exp(x)

# Incorrect order
ax1.plot(x, y, label='Incorrect Order')
original_ylim = ax1.get_ylim()
new_ylim = ax1.yaxis.limit_range_for_scale(original_ylim[0], original_ylim[1])
ax1.set_ylim(new_ylim)
ax1.set_yscale('log')
ax1.set_title('How2matplotlib.com - Incorrect Order')

# Correct order
ax2.plot(x, y, label='Correct Order')
ax2.set_yscale('log')
original_ylim = ax2.get_ylim()
new_ylim = ax2.yaxis.limit_range_for_scale(original_ylim[0], original_ylim[1])
ax2.set_ylim(new_ylim)
ax2.set_title('How2matplotlib.com - Correct Order')

for ax in (ax1, ax2):
    ax.legend()

plt.tight_layout()
plt.show()
Output:
Comparing Matplotlib.axis.Axis.limit_range_for_scale() with Alternative Methods
While Matplotlib.axis.Axis.limit_range_for_scale() is a powerful tool, it’s worth comparing it with alternative methods for adjusting axis ranges. Let’s explore some comparisons:
Manual Range Setting vs. limit_range_for_scale()
import matplotlib.pyplot as plt
import numpy as np

fig, (ax1, ax2) = plt.subplots(1, 2, figsize=(12, 5))

x = np.linspace(0, 10, 100)
y = np.exp(x)

# Manual range setting
ax1.plot(x, y, label='Manual Setting')
ax1.set_yscale('log')
ax1.set_ylim(1, 1e5)
ax1.set_title('How2matplotlib.com - Manual Range Setting')

# Using limit_range_for_scale()
ax2.plot(x, y, label='limit_range_for_scale()')
ax2.set_yscale('log')
original_ylim = ax2.get_ylim()
new_ylim = ax2.yaxis.limit_range_for_scale(original_ylim[0], original_ylim[1])
ax2.set_ylim(new_ylim)
ax2.set_title('How2matplotlib.com - limit_range_for_scale()')

for ax in (ax1, ax2):
    ax.legend()
    ax.grid(True, which='both', ls='-', alpha=0.2)

plt.tight_layout()
plt.show()
Output:
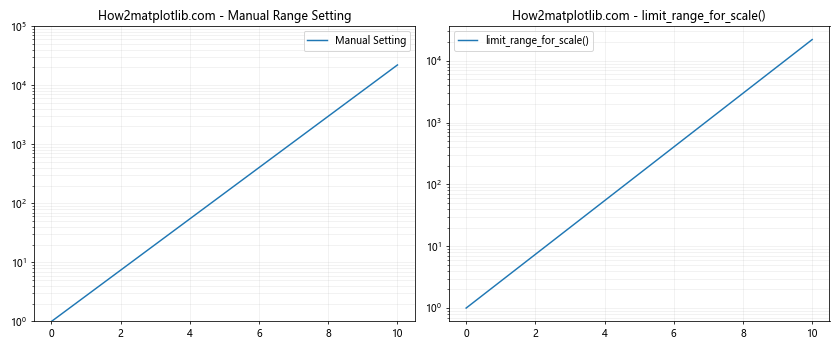
This example compares manual range setting with the use of limit_range_for_scale(). The latter provides a more dynamic and data-driven approach to range adjustment.
Autoscale vs. limit_range_for_scale()
import matplotlib.pyplot as plt
import numpy as np

fig, (ax1, ax2) = plt.subplots(1, 2, figsize=(12, 5))

x = np.linspace(0, 10, 100)
y = np.exp(x)

# Autoscale
ax1.plot(x, y, label='Autoscale')
ax1.set_yscale('log')
ax1.autoscale(enable=True, axis='y', tight=True)
ax1.set_title('How2matplotlib.com - Autoscale')

# Using limit_range_for_scale()
ax2.plot(x, y, label='limit_range_for_scale()')
ax2.set_yscale('log')
original_ylim = ax2.get_ylim()
new_ylim = ax2.yaxis.limit_range_for_scale(original_ylim[0], original_ylim[1])
ax2.set_ylim(new_ylim)
ax2.set_title('How2matplotlib.com - limit_range_for_scale()')

for ax in (ax1, ax2):
    ax.legend()
    ax.grid(True, which='both', ls='-', alpha=0.2)

plt.tight_layout()
plt.show()
Output:
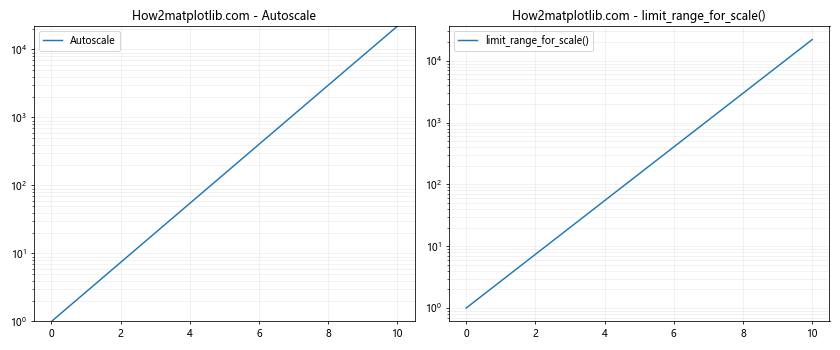
This comparison shows how limit_range_for_scale() can provide more control over the axis range compared to autoscale, especially for non-linear scales.
Real-world Applications of Matplotlib.axis.Axis.limit_range_for_scale()
The Matplotlib.axis.Axis.limit_range_for_scale() function has numerous real-world applications in data visualization. Let’s explore some scenarios where this function can be particularly useful:
Financial Data Visualization
import matplotlib.pyplot as plt
import numpy as np
import pandas as pd

# Generate sample stock data
dates = pd.date_range(start='2020-01-01', end='2021-12-31', freq='D')
prices = 100 * (1 + np.random.randn(len(dates)).cumsum() * 0.01)
volume = np.random.randint(1000, 1000000, size=len(dates))

fig, (ax1, ax2) = plt.subplots(2, 1, figsize=(10, 8), sharex=True)

# Price plot
ax1.plot(dates, prices, label='Stock Price')
ax1.set_ylabel('Price')
ax1.set_title('How2matplotlib.com - Stock Price and Volume')
ax1.legend()

# Volume plot with log scale
ax2.bar(dates, volume, label='Trading Volume', alpha=0.5)
ax2.set_yscale('log')
ax2.set_ylabel('Volume')
ax2.legend()

# Apply limit_range_for_scale to volume axis
original_ylim = ax2.get_ylim()
new_ylim = ax2.yaxis.limit_range_for_scale(original_ylim[0], original_ylim[1])
ax2.set_ylim(new_ylim)

plt.tight_layout()
plt.show()
Output:
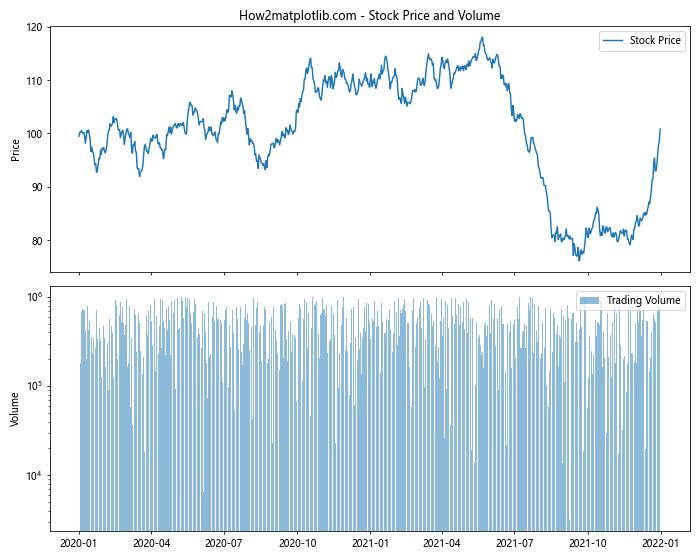
In this example, we use limit_range_for_scale() to adjust the y-axis range of a log-scaled volume plot in a financial data visualization.
Scientific Data Analysis
import matplotlib.pyplot as plt
import numpy as np

# Generate sample data
concentrations = np.logspace(-9, -3, 100)
response = 1 / (1 + (concentrations / 1e-6)**-1)

fig, ax = plt.subplots(figsize=(10, 6))

ax.plot(concentrations, response, label='Dose-Response Curve')
ax.set_xscale('log')
ax.set_xlabel('Concentration (M)')
ax.set_ylabel('Response')
ax.set_title('How2matplotlib.com - Dose-Response Curve')

# Apply limit_range_for_scale to x-axis
original_xlim = ax.get_xlim()
new_xlim = ax.xaxis.limit_range_for_scale(original_xlim[0], original_xlim[1])
ax.set_xlim(new_xlim)

ax.grid(True, which='both', ls='-', alpha=0.2)
ax.legend()

plt.tight_layout()
plt.show()
Output:
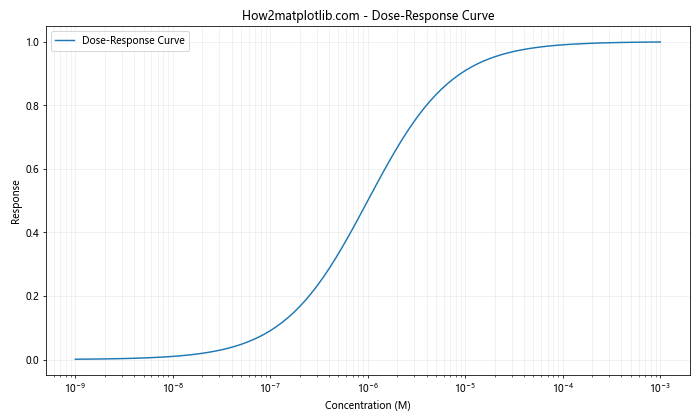
This example demonstrates the use of limit_range_for_scale() in a scientific context, adjusting the x-axis range of a dose-response curve plot.
Advanced Techniques with Matplotlib.axis.Axis.limit_range_for_scale()
Let’s explore some advanced techniques that leverage the power of the Matplotlib.axis.Axis.limit_range_for_scale() function:
Dynamic Range Adjustment
import matplotlib.pyplot as plt
import numpy as np

class DynamicPlot:
    def __init__(self):
        self.fig, self.ax = plt.subplots()
        self.x = np.linspace(0, 10, 100)
        self.line, = self.ax.plot(self.x, np.sin(self.x))
        self.ax.set_title('How2matplotlib.com - Dynamic Range Adjustment')
        self.ax.set_ylim(-1.5, 1.5)
        self.fig.canvas.mpl_connect('scroll_event', self.on_scroll)

    def on_scroll(self, event):
        cur_ylim = self.ax.get_ylim()
        if event.button == 'up':
            scale_factor = 0.9
        else:
            scale_factor = 1.1
        new_ylim = (cur_ylim[0] * scale_factor, cur_ylim[1] * scale_factor)
        adjusted_ylim = self.ax.yaxis.limit_range_for_scale(new_ylim[0], new_ylim[1])
        self.ax.set_ylim(adjusted_ylim)
        self.fig.canvas.draw_idle()

dp = DynamicPlot()
plt.show()
Output:
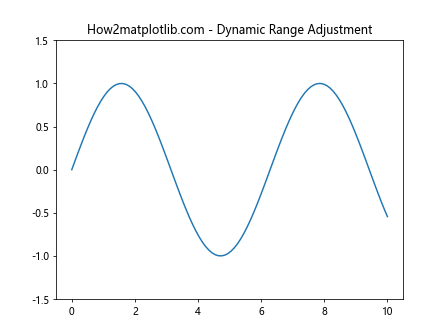
This advanced example creates an interactive plot where the y-axis range can be adjusted dynamically using the mouse scroll wheel, with limit_range_for_scale() ensuring appropriate limits.
Custom Scale with limit_range_for_scale()
import matplotlib.pyplot as plt
import matplotlib.scale as mscale
import matplotlib.transforms as mtransforms
import numpy as np

class SquareRootScale(mscale.ScaleBase):
    name = 'squareroot'

    def __init__(self, axis, **kwargs):
        mscale.ScaleBase.__init__(self, axis)

    def get_transform(self):
        return self.SquareRootTransform()

    def set_default_locators_and_formatters(self, axis):
        axis.set_major_locator(plt.AutoLocator())
        axis.set_major_formatter(plt.ScalarFormatter())

    def limit_range_for_scale(self, vmin, vmax, minpos):
        return max(0, vmin), vmax

    class SquareRootTransform(mtransforms.Transform):
        input_dims = 1
        output_dims = 1
        is_separable = True

        def transform_non_affine(self, a):
            return np.sqrt(a)

        def inverted(self):
            return SquareRootScale.InvertedSquareRootTransform()

    class InvertedSquareRootTransform(mtransforms.Transform):
        input_dims = 1
        output_dims = 1
        is_separable = True

        def transform_non_affine(self, a):
            return a ** 2

        def inverted(self):
            return SquareRootScale.SquareRootTransform()

mscale.register_scale(SquareRootScale)

fig, ax = plt.subplots()

x = np.linspace(0, 100, 1000)
y = x ** 2

ax.plot(x, y)
ax.set_yscale('squareroot')
ax.set_title('How2matplotlib.com - Custom Square Root Scale')
ax.set_xlabel('X')
ax.set_ylabel('Y')

plt.tight_layout()
plt.show()
Output:
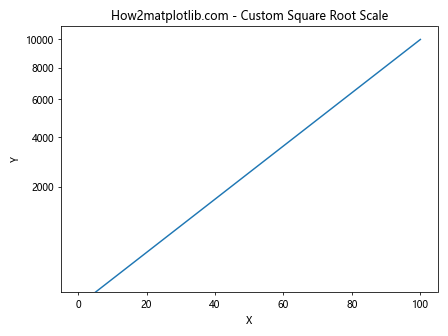
This advanced example demonstrates how to create a custom scale (square root scale) and implement a custom limit_range_for_scale() method for it.
Troubleshooting Common Issues with Matplotlib.axis.Axis.limit_range_for_scale()
When working with the Matplotlib.axis.Axis.limit_range_for_scale() function, you may encounter some issues. Here are some common problems and their solutions:
Issue 1: Inconsistent Behavior Across Different Matplotlib Versions
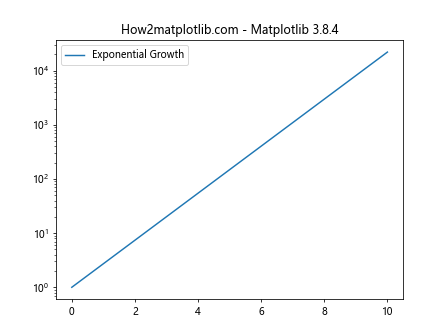
The behavior of limit_range_for_scale() may vary slightly across different Matplotlib versions.
Solution: Always specify the Matplotlib version in your project requirements and test your code with different versions if compatibility is a concern.
import matplotlib
print(f"Matplotlib version: {matplotlib.__version__}")

import matplotlib.pyplot as plt
import numpy as np

fig, ax = plt.subplots()

x = np.linspace(0, 10, 100)
y = np.exp(x)

ax.plot(x, y, label='Exponential Growth')
ax.set_yscale('log')
ax.set_title(f'How2matplotlib.com - Matplotlib {matplotlib.__version__}')

original_ylim = ax.get_ylim()
new_ylim = ax.yaxis.limit_range_for_scale(original_ylim[0], original_ylim[1])
ax.set_ylim(new_ylim)
ax.legend()

plt.show()
Output:
Conclusion
The Matplotlib.axis.Axis.limit_range_for_scale() function is a powerful tool for adjusting axis ranges in Matplotlib plots, especially when working with non-linear scales. Throughout this comprehensive guide, we’ve explored its usage, parameters, applications, and advanced techniques. We’ve also addressed common pitfalls and provided solutions to potential issues.
By mastering the Matplotlib.axis.Axis.limit_range_for_scale() function, you can create more dynamic and visually appealing data visualizations, particularly when dealing with logarithmic or custom scales. Remember to always consider the scale type, order of operations, and potential customization needs when using this function in your Matplotlib projects.