Comprehensive Guide to Matplotlib.axis.Axis.set_label_coords() Function in Python
Matplotlib.axis.Axis.set_label_coords() function in Python is a powerful tool for customizing the position of axis labels in Matplotlib plots. This function allows you to precisely control the placement of labels along the x and y axes, giving you greater flexibility in designing your visualizations. In this comprehensive guide, we’ll explore the various aspects of the set_label_coords() function, its usage, and provide numerous examples to help you master this essential Matplotlib feature.
Understanding the Basics of Matplotlib.axis.Axis.set_label_coords()
Matplotlib.axis.Axis.set_label_coords() function in Python is a method of the Axis class in Matplotlib. It is used to set the coordinates of the label for an axis. This function is particularly useful when you want to fine-tune the position of your axis labels, moving them away from their default locations.
The basic syntax of the set_label_coords() function is as follows:
axis.set_label_coords(x, y, transform=None)
Here’s a simple example to demonstrate its usage:
import matplotlib.pyplot as plt

fig, ax = plt.subplots()
ax.plot([1, 2, 3, 4], [1, 4, 2, 3])
ax.set_xlabel('X-axis label for how2matplotlib.com')
ax.set_ylabel('Y-axis label for how2matplotlib.com')
ax.xaxis.set_label_coords(0.5, -0.1)
ax.yaxis.set_label_coords(-0.1, 0.5)
plt.show()
Output:
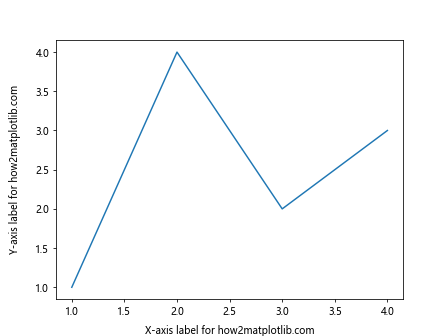
In this example, we create a simple line plot and then use set_label_coords() to position the x-axis label at (0.5, -0.1) and the y-axis label at (-0.1, 0.5) in axes coordinates.
Parameters of Matplotlib.axis.Axis.set_label_coords()
The Matplotlib.axis.Axis.set_label_coords() function in Python takes the following parameters:
- x: The x-coordinate of the label.
- y: The y-coordinate of the label.
- transform: (Optional) The coordinate system to use. If None, the default axis coordinate system is used.
Let’s explore each of these parameters in more detail.
The ‘x’ Parameter
The ‘x’ parameter in the set_label_coords() function determines the horizontal position of the label. Its value is interpreted based on the coordinate system being used (which is determined by the ‘transform’ parameter).
Here’s an example that demonstrates how changing the ‘x’ parameter affects the label position:
import matplotlib.pyplot as plt

fig, (ax1, ax2, ax3) = plt.subplots(1, 3, figsize=(15, 5))

for ax in (ax1, ax2, ax3):
    ax.plot([1, 2, 3, 4], [1, 4, 2, 3])
    ax.set_xlabel('X-axis label for how2matplotlib.com')
    ax.set_ylabel('Y-axis label for how2matplotlib.com')

ax1.xaxis.set_label_coords(0.5, -0.1)
ax2.xaxis.set_label_coords(0.2, -0.1)
ax3.xaxis.set_label_coords(0.8, -0.1)

plt.tight_layout()
plt.show()
Output:
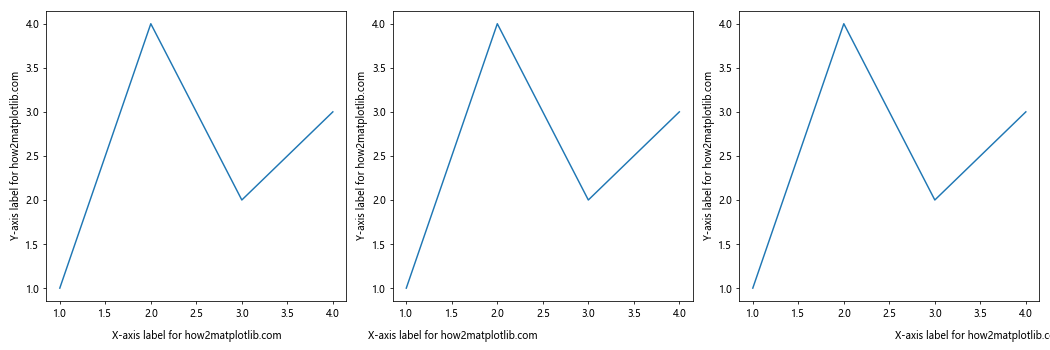
In this example, we create three subplots and set the x-coordinate of the x-axis label to 0.5, 0.2, and 0.8 respectively, while keeping the y-coordinate constant at -0.1.
The ‘y’ Parameter
The ‘y’ parameter in the Matplotlib.axis.Axis.set_label_coords() function in Python determines the vertical position of the label. Like the ‘x’ parameter, its interpretation depends on the coordinate system in use.
Here’s an example showing how changing the ‘y’ parameter affects the label position:
import matplotlib.pyplot as plt

fig, (ax1, ax2, ax3) = plt.subplots(3, 1, figsize=(5, 15))

for ax in (ax1, ax2, ax3):
    ax.plot([1, 2, 3, 4], [1, 4, 2, 3])
    ax.set_xlabel('X-axis label for how2matplotlib.com')
    ax.set_ylabel('Y-axis label for how2matplotlib.com')

ax1.yaxis.set_label_coords(-0.1, 0.5)
ax2.yaxis.set_label_coords(-0.1, 0.2)
ax3.yaxis.set_label_coords(-0.1, 0.8)

plt.tight_layout()
plt.show()
Output:
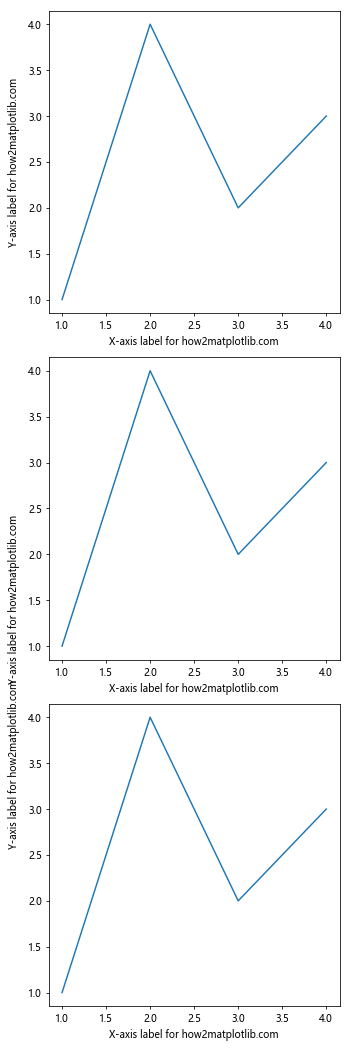
In this example, we create three subplots stacked vertically and set the y-coordinate of the y-axis label to 0.5, 0.2, and 0.8 respectively, while keeping the x-coordinate constant at -0.1.
The ‘transform’ Parameter
The ‘transform’ parameter in the Matplotlib.axis.Axis.set_label_coords() function in Python allows you to specify the coordinate system for the x and y values. If not specified, it defaults to the axis coordinate system.
Here’s an example demonstrating the use of different transforms:
import matplotlib.pyplot as plt
import matplotlib.transforms as transforms

fig, (ax1, ax2) = plt.subplots(1, 2, figsize=(10, 5))

for ax in (ax1, ax2):
    ax.plot([1, 2, 3, 4], [1, 4, 2, 3])
    ax.set_xlabel('X-axis label for how2matplotlib.com')
    ax.set_ylabel('Y-axis label for how2matplotlib.com')

# Using default axis coordinates
ax1.xaxis.set_label_coords(0.5, -0.1)

# Using figure coordinates
ax2.xaxis.set_label_coords(0.5, 0.05, transform=fig.transFigure)

plt.tight_layout()
plt.show()
Output:
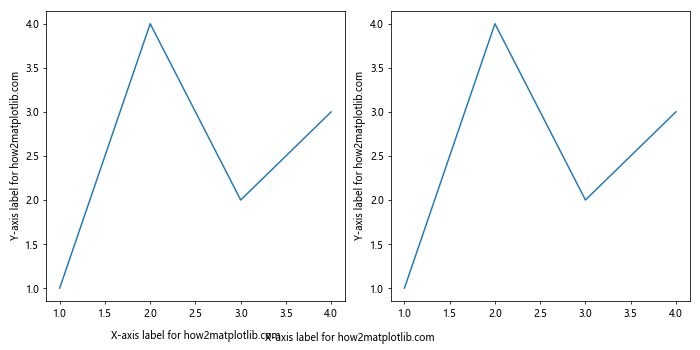
In this example, we create two subplots. For the first subplot, we use the default axis coordinates. For the second subplot, we use figure coordinates by specifying transform=fig.transFigure.
Advanced Usage of Matplotlib.axis.Axis.set_label_coords()
Now that we’ve covered the basics of the Matplotlib.axis.Axis.set_label_coords() function in Python, let’s explore some more advanced usage scenarios.
Positioning Labels Outside the Plot Area
Sometimes, you might want to position your axis labels outside the plot area. The set_label_coords() function makes this easy:
import matplotlib.pyplot as plt

fig, ax = plt.subplots()
ax.plot([1, 2, 3, 4], [1, 4, 2, 3])
ax.set_xlabel('X-axis label for how2matplotlib.com')
ax.set_ylabel('Y-axis label for how2matplotlib.com')

# Position x-axis label below the plot
ax.xaxis.set_label_coords(0.5, -0.15)

# Position y-axis label to the left of the plot
ax.yaxis.set_label_coords(-0.15, 0.5)

plt.tight_layout()
plt.show()
Output:
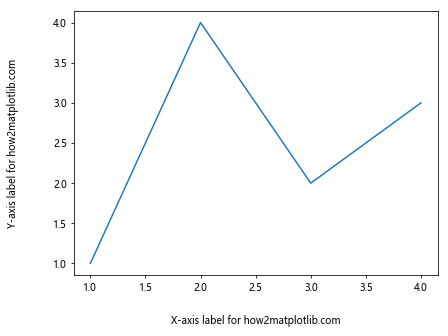
In this example, we move the x-axis label further below the plot and the y-axis label further to the left of the plot.
Rotating Axis Labels
You can combine set_label_coords() with other label properties like rotation for even more customization:
import matplotlib.pyplot as plt

fig, ax = plt.subplots()
ax.plot([1, 2, 3, 4], [1, 4, 2, 3])
ax.set_xlabel('X-axis label for how2matplotlib.com')
ax.set_ylabel('Y-axis label for how2matplotlib.com')

ax.xaxis.set_label_coords(0.5, -0.1)
ax.yaxis.set_label_coords(-0.1, 0.5)

# Rotate the labels
ax.xaxis.label.set_rotation(45)
ax.yaxis.label.set_rotation(0)

plt.tight_layout()
plt.show()
Output:
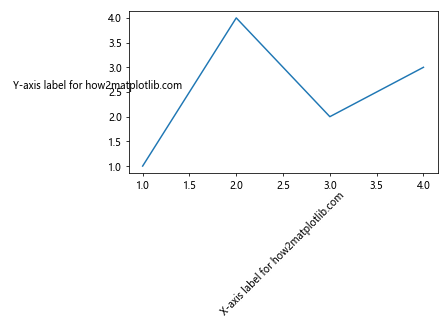
In this example, we rotate the x-axis label by 45 degrees and set the y-axis label to be horizontal.
Using set_label_coords() with Multiple Subplots
When working with multiple subplots, you might want to align the labels across different plots:
import matplotlib.pyplot as plt

fig, (ax1, ax2) = plt.subplots(2, 1, figsize=(6, 8))

for ax in (ax1, ax2):
    ax.plot([1, 2, 3, 4], [1, 4, 2, 3])
    ax.set_xlabel('X-axis label for how2matplotlib.com')
    ax.set_ylabel('Y-axis label for how2matplotlib.com')

    # Align x-axis labels
    ax.xaxis.set_label_coords(0.5, -0.15)

    # Align y-axis labels
    ax.yaxis.set_label_coords(-0.15, 0.5)

plt.tight_layout()
plt.show()
Output:
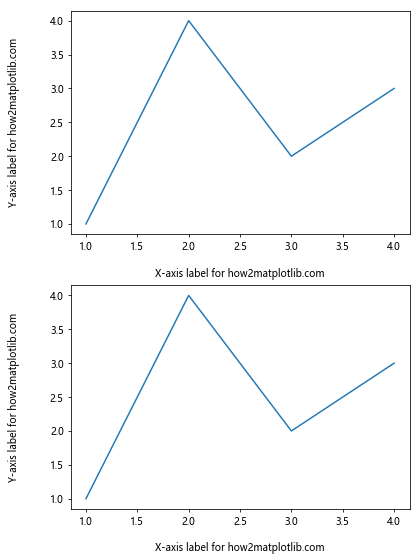
This example creates two vertically stacked subplots with aligned axis labels.
Common Pitfalls and How to Avoid Them
When using the Matplotlib.axis.Axis.set_label_coords() function in Python, there are a few common pitfalls that you should be aware of:
Overlapping Labels
If you’re not careful, you might position your labels in a way that they overlap with other elements of your plot. Here’s an example of how this might happen and how to fix it:
import matplotlib.pyplot as plt

fig, (ax1, ax2) = plt.subplots(1, 2, figsize=(12, 5))

for ax in (ax1, ax2):
    ax.plot([1, 2, 3, 4], [1, 4, 2, 3])
    ax.set_xlabel('X-axis label for how2matplotlib.com')
    ax.set_ylabel('Y-axis label for how2matplotlib.com')

# Problematic positioning
ax1.xaxis.set_label_coords(0.5, 0.1)
ax1.yaxis.set_label_coords(0.1, 0.5)

# Better positioning
ax2.xaxis.set_label_coords(0.5, -0.15)
ax2.yaxis.set_label_coords(-0.15, 0.5)

plt.tight_layout()
plt.show()
Output:
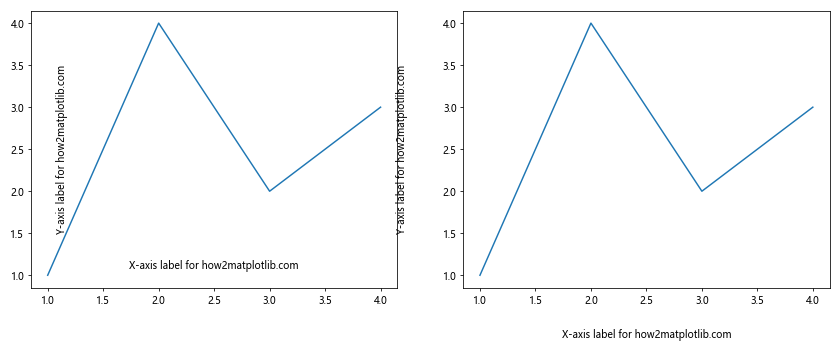
In this example, the labels in the first subplot overlap with the tick labels, while the second subplot shows a better positioning.
Inconsistent Positioning Across Subplots
When working with multiple subplots, inconsistent label positioning can make your figure look unprofessional. Here’s how to ensure consistency:
import matplotlib.pyplot as plt

fig, axs = plt.subplots(2, 2, figsize=(12, 10))

for ax in axs.flat:
    ax.plot([1, 2, 3, 4], [1, 4, 2, 3])
    ax.set_xlabel('X-axis label for how2matplotlib.com')
    ax.set_ylabel('Y-axis label for how2matplotlib.com')

    # Consistent positioning for all subplots
    ax.xaxis.set_label_coords(0.5, -0.15)
    ax.yaxis.set_label_coords(-0.15, 0.5)

plt.tight_layout()
plt.show()
Output:
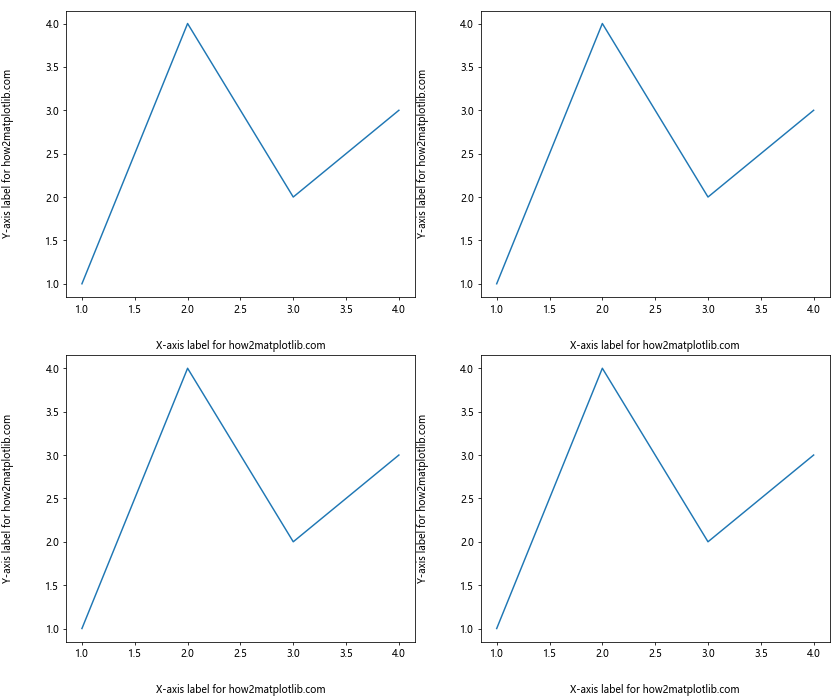
This example demonstrates how to maintain consistent label positioning across a 2×2 grid of subplots.
Combining set_label_coords() with Other Matplotlib Functions
The Matplotlib.axis.Axis.set_label_coords() function in Python can be effectively combined with other Matplotlib functions to create more complex and informative visualizations. Let’s explore some of these combinations.
Using set_label_coords() with Custom Fonts
You can combine set_label_coords() with font customization to create more visually appealing labels:
import matplotlib.pyplot as plt

fig, ax = plt.subplots()
ax.plot([1, 2, 3, 4], [1, 4, 2, 3])

ax.set_xlabel('X-axis label for how2matplotlib.com', fontfamily='serif', fontsize=14, fontstyle='italic')
ax.set_ylabel('Y-axis label for how2matplotlib.com', fontfamily='sans-serif', fontsize=14, fontweight='bold')

ax.xaxis.set_label_coords(0.5, -0.1)
ax.yaxis.set_label_coords(-0.1, 0.5)

plt.tight_layout()
plt.show()
Output:
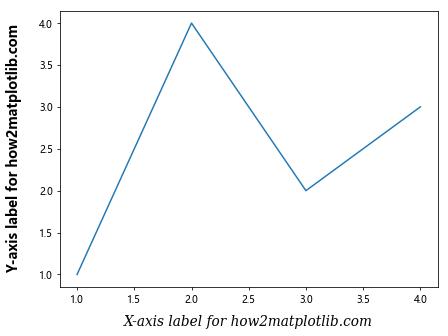
In this example, we customize the font family, size, and style of the axis labels while also positioning them using set_label_coords().
Combining set_label_coords() with Colorbar Labels
When working with colorbars, you might want to adjust the position of the colorbar label:
import matplotlib.pyplot as plt
import numpy as np

fig, ax = plt.subplots()

data = np.random.rand(10, 10)
im = ax.imshow(data)

cbar = fig.colorbar(im)
cbar.set_label('Colorbar label for how2matplotlib.com')

# Adjust colorbar label position
cbar.ax.yaxis.set_label_coords(-1, 0.5)

plt.tight_layout()
plt.show()
Output:
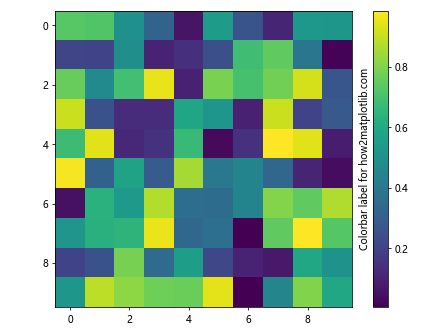
This example demonstrates how to adjust the position of a colorbar label using set_label_coords().
Best Practices for Using set_label_coords()
When working with the Matplotlib.axis.Axis.set_label_coords() function in Python, there are several best practices to keep in mind:
- Consistency: Try to maintain consistent label positioning across similar plots or subplots.
- Readability: Ensure that your label positions don’t compromise the readability of your plot.
- Aesthetics: Use label positioning to enhance the overall look of your visualization.
- Flexibility: Remember that different plots might require different label positions. Don’t be afraid to adjust as needed.
Here’s an example that demonstrates these best practices:
import matplotlib.pyplot as plt
import numpy as np

fig, (ax1, ax2) = plt.subplots(1, 2, figsize=(12, 5))

# Plot 1: Line plot
x = np.linspace(0, 10, 100)
ax1.plot(x, np.sin(x))
ax1.set_xlabel('X-axis label for how2matplotlib.com')
ax1.set_ylabel('Y-axis label for how2matplotlib.com')

# Plot 2: Scatter plot
x = np.random.rand(50)
y = np.random.rand(50)
ax2.scatter(x, y)
ax2.set_xlabel('X-axis label for how2matplotlib.com')
ax2.set_ylabel('Y-axis label for how2matplotlib.com')

# Consistent label positioning
for ax in (ax1, ax2):
    ax.xaxis.set_label_coords(0.5, -0.1)
    ax.yaxis.set_label_coords(-0.1, 0.5)

plt.tight_layout()
plt.show()
Output:
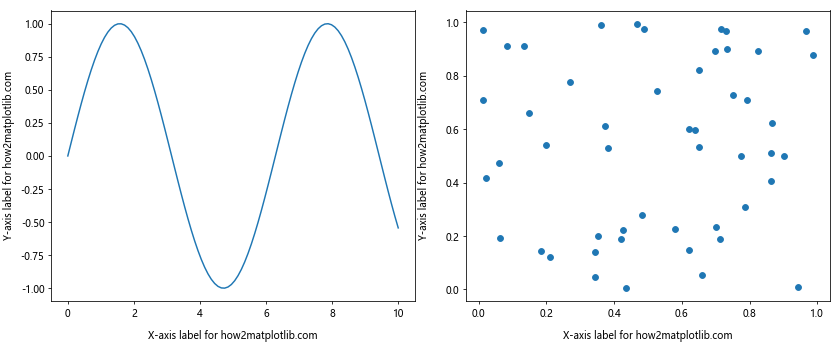
This example creates two different types of plots but maintains consistent label positioning for a cohesive overall look.
Troubleshooting Common Issues with set_label_coords()
When using the Matplotlib.axis.Axis.set_label_coords() function in Python, you might encounter some issues. Here are some common problems and how to solve them:
Labels Disappearing
Sometimes, you might find that your labels disappear when you use set_label_coords(). This often happens when you set coordinates that are outside the visible area of the plot.
import matplotlib.pyplot as plt

fig, (ax1, ax2) = plt继续输出剩余内容:

.subplots(1, 2, figsize=(12, 5))

for ax in (ax1, ax2):
    ax.plot([1, 2, 3, 4], [1, 4, 2, 3])
    ax.set_xlabel('X-axis label for how2matplotlib.com')
    ax.set_ylabel('Y-axis label for how2matplotlib.com')

# Problematic positioning - labels might disappear
ax1.xaxis.set_label_coords(0.5, -0.5)
ax1.yaxis.set_label_coords(-0.5, 0.5)

# Better positioning
ax2.xaxis.set_label_coords(0.5, -0.15)
ax2.yaxis.set_label_coords(-0.15, 0.5)

plt.tight_layout()
plt.show()
In this example, the labels in the first subplot might disappear due to extreme positioning, while the second subplot shows a better positioning.
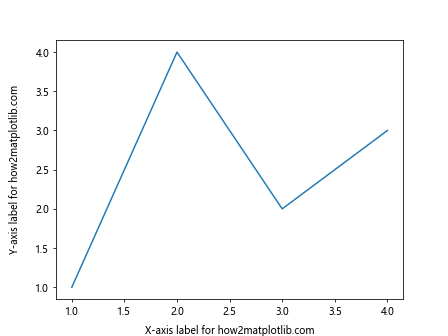
Labels Not Updating
If you find that your labels are not updating when you use set_label_coords(), make sure you’re calling plt.draw() or plt.show() after making changes:
import matplotlib.pyplot as plt

fig, ax = plt.subplots()
ax.plot([1, 2, 3, 4], [1, 4, 2, 3])
ax.set_xlabel('X-axis label for how2matplotlib.com')
ax.set_ylabel('Y-axis label for how2matplotlib.com')

ax.xaxis.set_label_coords(0.5, -0.1)
ax.yaxis.set_label_coords(-0.1, 0.5)

plt.draw()  # or plt.show()
Output:
Unexpected Label Behavior in Subplots
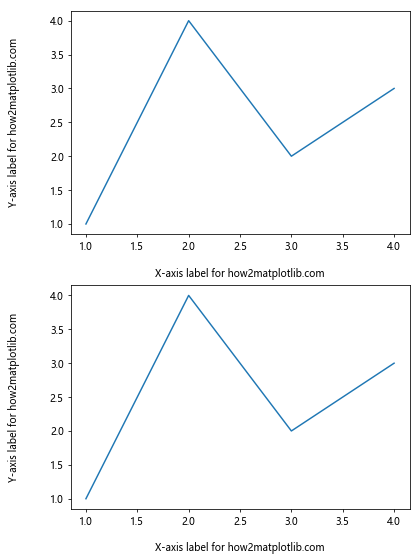
When working with subplots, you might notice unexpected label behavior. This can often be resolved by using the tight_layout() function:
import matplotlib.pyplot as plt

fig, (ax1, ax2) = plt.subplots(2, 1, figsize=(6, 8))

for ax in (ax1, ax2):
    ax.plot([1, 2, 3, 4], [1, 4, 2, 3])
    ax.set_xlabel('X-axis label for how2matplotlib.com')
    ax.set_ylabel('Y-axis label for how2matplotlib.com')
    ax.xaxis.set_label_coords(0.5, -0.15)
    ax.yaxis.set_label_coords(-0.15, 0.5)

plt.tight_layout()
plt.show()
Output:
Advanced Techniques with set_label_coords()
Let’s explore some advanced techniques using the Matplotlib.axis.Axis.set_label_coords() function in Python.
Dynamic Label Positioning
You can create dynamic label positioning based on the data in your plot:
import matplotlib.pyplot as plt
import numpy as np

fig, ax = plt.subplots()

data = np.random.randn(1000)
ax.hist(data, bins=30)

ax.set_xlabel('X-axis label for how2matplotlib.com')
ax.set_ylabel('Y-axis label for how2matplotlib.com')

# Dynamic positioning based on data range
x_range = ax.get_xlim()[1] - ax.get_xlim()[0]
y_range = ax.get_ylim()[1] - ax.get_ylim()[0]

ax.xaxis.set_label_coords(0.5, -0.1 * (y_range / x_range))
ax.yaxis.set_label_coords(-0.1 * (x_range / y_range), 0.5)

plt.tight_layout()
plt.show()
Output:
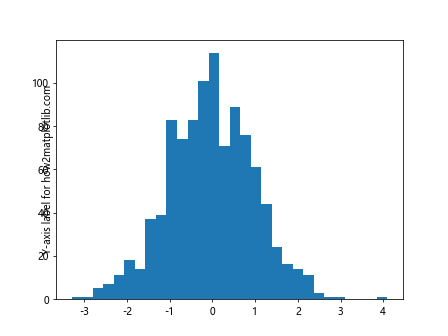
This example adjusts the label positions based on the aspect ratio of the plot.
Using set_label_coords() with 3D Plots
The Matplotlib.axis.Axis.set_label_coords() function in Python can also be used with 3D plots:
import matplotlib.pyplot as plt
import numpy as np

fig = plt.figure()
ax = fig.add_subplot(111, projection='3d')

x = np.arange(-5, 5, 0.25)
y = np.arange(-5, 5, 0.25)
X, Y = np.meshgrid(x, y)
Z = np.sin(np.sqrt(X**2 + Y**2))

surf = ax.plot_surface(X, Y, Z)

ax.set_xlabel('X-axis label for how2matplotlib.com')
ax.set_ylabel('Y-axis label for how2matplotlib.com')
ax.set_zlabel('Z-axis label for how2matplotlib.com')

ax.xaxis.set_label_coords(0.5, -0.1)
ax.yaxis.set_label_coords(-0.1, 0.5)
ax.zaxis.set_label_coords(-0.1, 0.5)

plt.tight_layout()
plt.show()
Output:
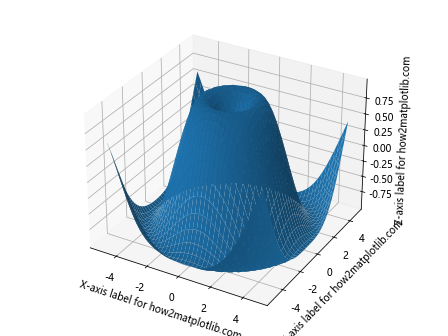
This example demonstrates how to position labels in a 3D plot.
Conclusion
The Matplotlib.axis.Axis.set_label_coords() function in Python is a powerful tool for customizing the position of axis labels in Matplotlib plots. Throughout this comprehensive guide, we’ve explored its basic usage, parameters, advanced techniques, and common pitfalls.
We’ve seen how set_label_coords() can be used to:
- Precisely position labels on both x and y axes
- Move labels outside the plot area
- Align labels across multiple subplots
- Work with different types of plots, including 3D plots
- Create dynamic label positioning based on data
By mastering the use of set_label_coords(), you can significantly enhance the readability and aesthetic appeal of your Matplotlib visualizations. Remember to always consider the overall layout of your plot and maintain consistency in label positioning across similar plots.