Mastering Matplotlib: Adding Titles to Subplots with matplotlib title on sub
Matplotlib title on sub is a crucial aspect of data visualization in Python. This comprehensive guide will explore various techniques and best practices for adding titles to subplots using Matplotlib. We’ll cover everything from basic title placement to advanced customization options, providing detailed examples and explanations along the way.
Understanding the Basics of matplotlib title on sub
Before diving into the specifics of adding titles to subplots, it’s essential to understand the fundamental concepts of Matplotlib’s subplot system. Subplots allow you to create multiple plots within a single figure, and adding titles to these subplots helps to organize and explain your data effectively.
Let’s start with a basic example of creating subplots and adding titles:
import matplotlib.pyplot as plt
import numpy as np

# Create sample data
x = np.linspace(0, 10, 100)
y1 = np.sin(x)
y2 = np.cos(x)

# Create a figure with two subplots
fig, (ax1, ax2) = plt.subplots(1, 2, figsize=(12, 5))

# Plot data on the first subplot
ax1.plot(x, y1)
ax1.set_title("Sine Wave - how2matplotlib.com")

# Plot data on the second subplot
ax2.plot(x, y2)
ax2.set_title("Cosine Wave - how2matplotlib.com")

# Add a main title to the figure
fig.suptitle("Trigonometric Functions - how2matplotlib.com", fontsize=16)

# Adjust the layout and display the plot
plt.tight_layout()
plt.show()

# Print the output
print("The plot has been displayed.")
Output:
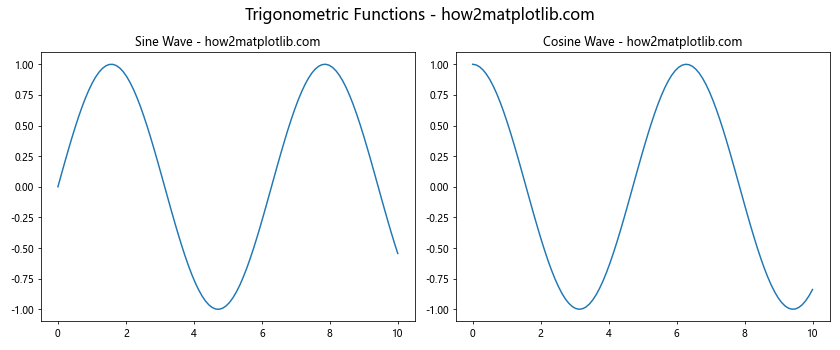
In this example, we create two subplots side by side and add individual titles to each subplot using the set_title() method. We also add a main title to the entire figure using fig.suptitle(). This basic structure forms the foundation for more advanced title customization techniques.
Advanced Techniques for matplotlib title on sub
Now that we’ve covered the basics, let’s explore some more advanced techniques for adding titles to subplots using Matplotlib.
Customizing Title Appearance
You can customize the appearance of subplot titles by adjusting various parameters such as font size, color, and style. Here’s an example that demonstrates these customization options:
import matplotlib.pyplot as plt
import numpy as np

# Create sample data
x = np.linspace(0, 10, 100)
y1 = np.sin(x)
y2 = np.cos(x)

# Create a figure with two subplots
fig, (ax1, ax2) = plt.subplots(1, 2, figsize=(12, 5))

# Plot data on the first subplot
ax1.plot(x, y1)
ax1.set_title("Sine Wave - how2matplotlib.com", fontsize=14, color='red', fontweight='bold', fontstyle='italic')

# Plot data on the second subplot
ax2.plot(x, y2)
ax2.set_title("Cosine Wave - how2matplotlib.com", fontsize=14, color='blue', fontweight='bold', fontstyle='italic')

# Add a main title to the figure
fig.suptitle("Customized Titles - how2matplotlib.com", fontsize=18, fontweight='bold')

# Adjust the layout and display the plot
plt.tight_layout()
plt.show()

# Print the output
print("The plot with customized titles has been displayed.")
Output:
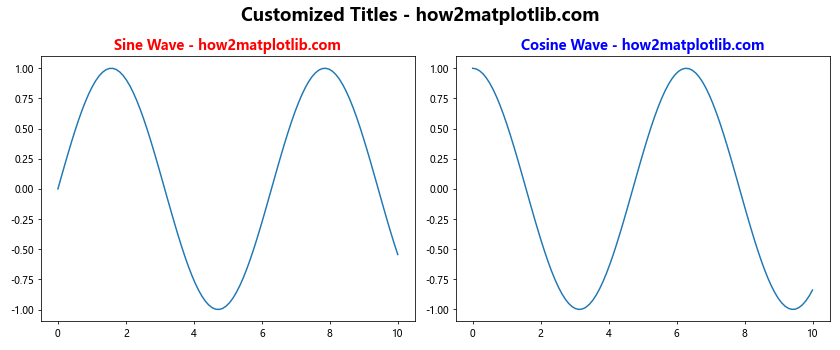
In this example, we’ve customized the subplot titles by adjusting the font size, color, weight, and style. These customization options allow you to create visually appealing and informative titles that complement your data visualization.
Positioning Titles
Matplotlib provides flexibility in positioning subplot titles. You can adjust the position of titles relative to the subplot axes using the y parameter in the set_title() method. Here’s an example that demonstrates different title positions:
import matplotlib.pyplot as plt
import numpy as np

# Create sample data
x = np.linspace(0, 10, 100)
y = np.sin(x)

# Create a figure with three subplots
fig, (ax1, ax2, ax3) = plt.subplots(1, 3, figsize=(15, 5))

# Plot data on the first subplot with title above
ax1.plot(x, y)
ax1.set_title("Title Above - how2matplotlib.com", y=1.05)

# Plot data on the second subplot with title at default position
ax2.plot(x, y)
ax2.set_title("Default Title Position - how2matplotlib.com")

# Plot data on the third subplot with title inside
ax3.plot(x, y)
ax3.set_title("Title Inside - how2matplotlib.com", y=0.95)

# Add a main title to the figure
fig.suptitle("Title Positioning - how2matplotlib.com", fontsize=16)

# Adjust the layout and display the plot
plt.tight_layout()
plt.show()

# Print the output
print("The plot with different title positions has been displayed.")
Output:
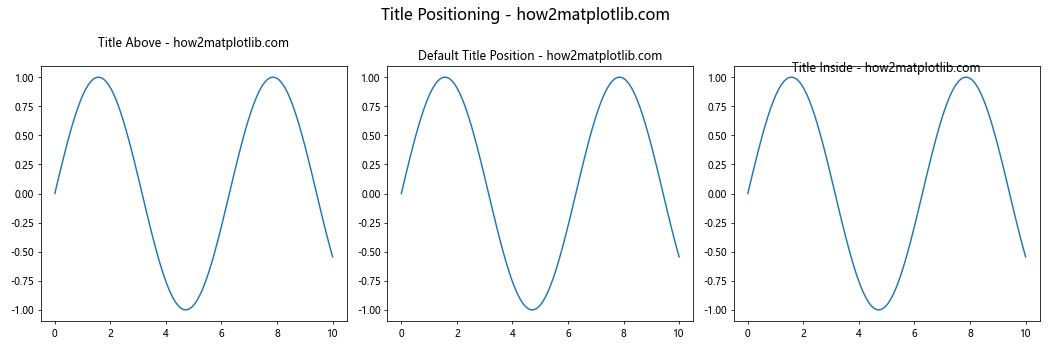
This example shows three different title positions: above the subplot, at the default position, and inside the subplot. By adjusting the y parameter, you can fine-tune the vertical position of the title to best suit your visualization needs.
Adding Titles to Subplots in a Grid
When working with a grid of subplots, you may want to add titles to each subplot in a systematic way. Here’s an example that demonstrates how to add titles to subplots in a 2×2 grid:
import matplotlib.pyplot as plt
import numpy as np

# Create sample data
x = np.linspace(0, 10, 100)
y1 = np.sin(x)
y2 = np.cos(x)
y3 = np.tan(x)
y4 = np.exp(-x/10)

# Create a figure with a 2x2 grid of subplots
fig, axs = plt.subplots(2, 2, figsize=(12, 10))

# Flatten the 2D array of axes for easier iteration
axs = axs.flatten()

# Plot data and add titles to each subplot
functions = [y1, y2, y3, y4]
titles = ["Sine Wave", "Cosine Wave", "Tangent Wave", "Exponential Decay"]

for i, (ax, func, title) in enumerate(zip(axs, functions, titles)):
    ax.plot(x, func)
    ax.set_title(f"{title} - how2matplotlib.com", fontsize=12)
    ax.set_xlabel("X-axis")
    ax.set_ylabel("Y-axis")

# Add a main title to the figure
fig.suptitle("Grid of Subplots with Titles - how2matplotlib.com", fontsize=16)

# Adjust the layout and display the plot
plt.tight_layout()
plt.show()

# Print the output
print("The grid of subplots with titles has been displayed.")
Output:
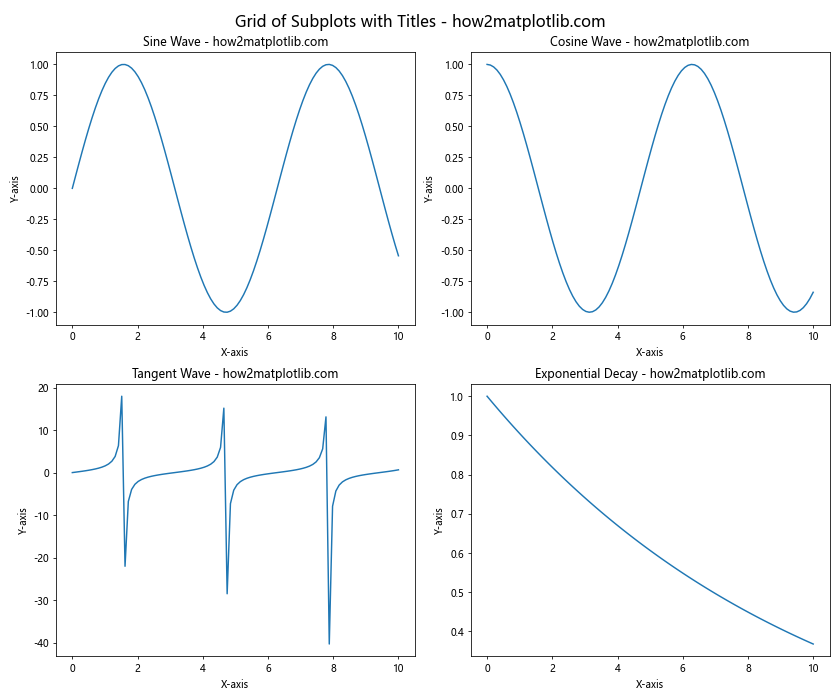
This example creates a 2×2 grid of subplots, each with its own title. By using a loop to iterate through the subplots, we can efficiently add titles and customize each subplot as needed.
Rotating Subplot Titles
In some cases, you may want to rotate subplot titles to better fit the layout of your visualization or to emphasize certain aspects of your data. Here’s an example that demonstrates how to rotate subplot titles:
import matplotlib.pyplot as plt
import numpy as np

# Create sample data
x = np.linspace(0, 10, 100)
y1 = np.sin(x)
y2 = np.cos(x)

# Create a figure with two subplots
fig, (ax1, ax2) = plt.subplots(1, 2, figsize=(12, 5))

# Plot data on the first subplot
ax1.plot(x, y1)
ax1.set_title("Sine Wave - how2matplotlib.com", rotation=45, ha='right', va='bottom')

# Plot data on the second subplot
ax2.plot(x, y2)
ax2.set_title("Cosine Wave - how2matplotlib.com", rotation=-45, ha='left', va='bottom')

# Add a main title to the figure
fig.suptitle("Rotated Subplot Titles - how2matplotlib.com", fontsize=16)

# Adjust the layout and display the plot
plt.tight_layout()
plt.show()

# Print the output
print("The plot with rotated subplot titles has been displayed.")
Output:
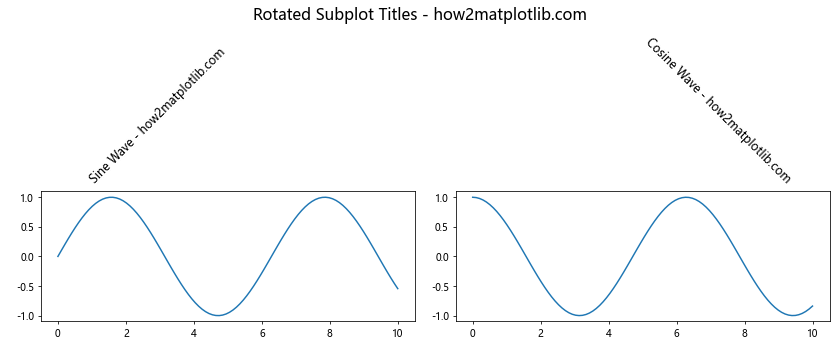
In this example, we’ve rotated the subplot titles using the rotation parameter in the set_title() method. We’ve also adjusted the horizontal and vertical alignment (ha and va) to ensure proper positioning of the rotated titles.
Adding Subtitles to Subplots
Sometimes, you may want to add both a title and a subtitle to your subplots. While Matplotlib doesn’t have a built-in method for subtitles, you can achieve this effect by using the text() method. Here’s an example:
import matplotlib.pyplot as plt
import numpy as np

# Create sample data
x = np.linspace(0, 10, 100)
y1 = np.sin(x)
y2 = np.cos(x)

# Create a figure with two subplots
fig, (ax1, ax2) = plt.subplots(1, 2, figsize=(12, 5))

# Plot data on the first subplot
ax1.plot(x, y1)
ax1.set_title("Sine Wave - how2matplotlib.com", fontsize=14)
ax1.text(0.5, 1.05, "Subtitle: Periodic Function", transform=ax1.transAxes, ha='center', fontsize=10)

# Plot data on the second subplot
ax2.plot(x, y2)
ax2.set_title("Cosine Wave - how2matplotlib.com", fontsize=14)
ax2.text(0.5, 1.05, "Subtitle: Phase-shifted Sine", transform=ax2.transAxes, ha='center', fontsize=10)

# Add a main title to the figure
fig.suptitle("Subplots with Titles and Subtitles - how2matplotlib.com", fontsize=16)

# Adjust the layout and display the plot
plt.tight_layout()
plt.show()

# Print the output
print("The plot with titles and subtitles has been displayed.")
Output:
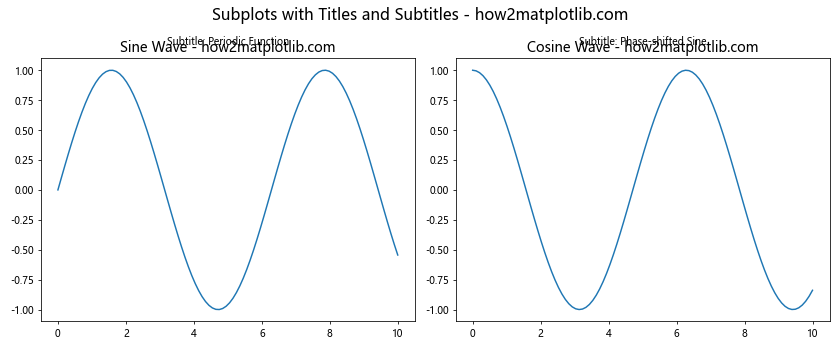
In this example, we’ve added subtitles to each subplot using the text() method. The subtitles are positioned just below the main titles, providing additional context for each subplot.
Dynamically Generating Titles
When working with large datasets or generating multiple plots, you may need to dynamically generate titles based on your data. Here’s an example that demonstrates how to create titles dynamically:
import matplotlib.pyplot as plt
import numpy as np

# Create sample data
np.random.seed(42)
data = {
    'A': np.random.randn(100),
    'B': np.random.randn(100) + 1,
    'C': np.random.randn(100) - 1
}

# Create a figure with subplots for each dataset
fig, axs = plt.subplots(1, 3, figsize=(15, 5))

# Plot data and add dynamically generated titles
for i, (key, values) in enumerate(data.items()):
    axs[i].hist(values, bins=20)
    mean = np.mean(values)
    std = np.std(values)
    axs[i].set_title(f"Dataset {key} - how2matplotlib.com\nMean: {mean:.2f}, Std: {std:.2f}")

# Add a main title to the figure
fig.suptitle("Dynamically Generated Titles - how2matplotlib.com", fontsize=16)

# Adjust the layout and display the plot
plt.tight_layout()
plt.show()

# Print the output
print("The plot with dynamically generated titles has been displayed.")
Output:
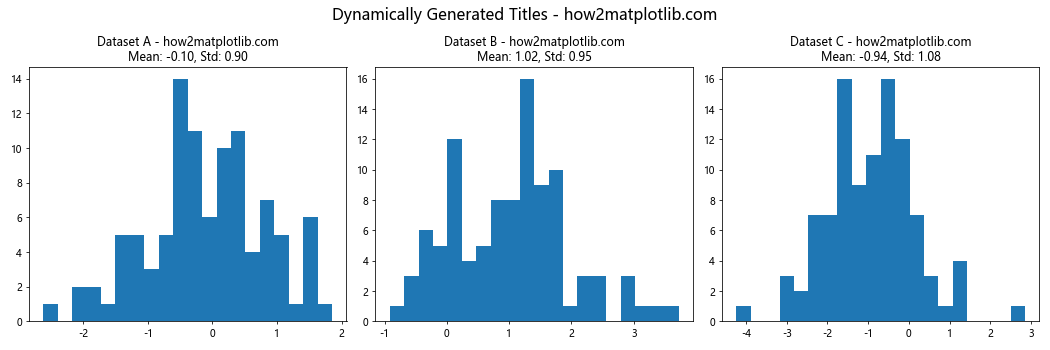
In this example, we’ve created titles that include summary statistics (mean and standard deviation) for each dataset. This approach allows you to create informative titles that reflect the characteristics of your data.
Adding Titles to 3D Subplots
Matplotlib also supports 3D plotting, and you can add titles to 3D subplots in a similar way to 2D subplots. Here’s an example that demonstrates how to add titles to 3D subplots:
import matplotlib.pyplot as plt
import numpy as np
from mpl_toolkits.mplot3d import Axes3D

# Create sample data
x = np.linspace(-5, 5, 50)
y = np.linspace(-5, 5, 50)
X, Y = np.meshgrid(x, y)
Z1 = np.sin(np.sqrt(X**2 + Y**2))
Z2 = np.cos(np.sqrt(X**2 + Y**2))

# Create a figure with two 3D subplots
fig = plt.figure(figsize=(12, 5))
ax1 = fig.add_subplot(121, projection='3d')
ax2 = fig.add_subplot(122, projection='3d')

# Plot data on the first subplot
surf1 = ax1.plot_surface(X, Y, Z1, cmap='viridis')
ax1.set_title("3D Sine Wave - how2matplotlib.com")

# Plot data on the second subplot
surf2 = ax2.plot_surface(X, Y, Z2, cmap='plasma')
ax2.set_title("3D Cosine Wave - how2matplotlib.com")

# Add a main title to the figure
fig.suptitle("3D Subplots with Titles - how2matplotlib.com", fontsize=16)

# Adjust the layout and display the plot
plt.tight_layout()
plt.show()

# Print the output
print("The 3D subplots with titles have been displayed.")
Output:
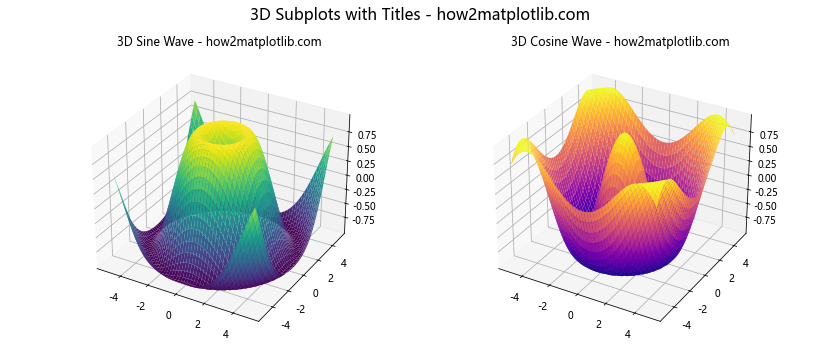
This example creates two 3D subplots, each with its own title. The process of adding titles to 3D subplots is similar to that of 2D subplots, demonstrating the consistency of Matplotlib’s API across different plot types.
Matplotlib title on sub Conclusion
Mastering the art of adding titles to subplots using matplotlib title on sub is an essential skill for creating clear, informative, and visually appealing data visualizations. Throughout this comprehensive guide, we’ve explored a wide range of techniques and best practices, from basic title placement to advanced customization options.
We’ve covered topics such as customizing title appearance, positioning titles, working with grids of subplots, using LaTeX for mathematical expressions, rotating titles, adding subtitles, dynamically generating titles, working with 3D subplots, aligning titles in complex layouts, and even animating titles for dynamic visualizations.
By mastering these techniques, you’ll be well-equipped to create professional-quality visualizations that effectively communicate your data and insights. Remember to experiment with different approaches and combinations of these techniques to find the best way to present your specific data and tell your unique story through visualization.
As you continue to work with Matplotlib, keep exploring new features and possibilities. The flexibility and power of Matplotlib’s subplot system and title customization options provide endless opportunities for creating impactful and informative visualizations.