Matplotlib Title Inside Plot: A Comprehensive Guide
1. Introduction to Matplotlib Title Inside Plot
Matplotlib is a powerful plotting library in Python that allows users to create a wide variety of static, animated, and interactive visualizations. One of the key elements in creating informative and visually appealing plots is the proper placement and formatting of titles. While the default behavior in Matplotlib is to place titles above the plot, there are situations where placing the title inside the plot area can be more effective or aesthetically pleasing. This article will explore various techniques and best practices for placing titles inside plots using Matplotlib.
Let’s start with a basic example of how to place a title inside a plot:
import matplotlib.pyplot as plt
import numpy as np

# Generate sample data
x = np.linspace(0, 10, 100)
y = np.sin(x)

# Create the plot
fig, ax = plt.subplots(figsize=(10, 6))
ax.plot(x, y)

# Add title inside the plot
ax.text(0.5, 0.95, 'Sine Wave - how2matplotlib.com',
        horizontalalignment='center', verticalalignment='center',
        transform=ax.transAxes, fontsize=16, fontweight='bold')

# Remove the default title
ax.set_title('')

# Show the plot
plt.show()

# Print output
print("The plot has been displayed with the title inside.")
Output:
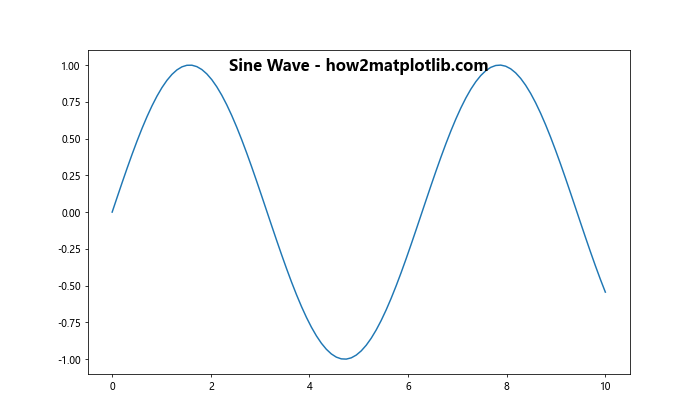
In this example, we use the ax.text() method to place the title inside the plot area. The transform=ax.transAxes argument ensures that the coordinates (0.5, 0.95) refer to the axes coordinates rather than data coordinates. This places the title at the center of the plot horizontally and near the top vertically.
2. Customizing Title Position and Appearance
When placing a title inside a plot, you have full control over its position, size, color, and other visual properties. This section will explore various ways to customize the appearance of an inside title.
2.1 Adjusting Title Position
You can fine-tune the position of the title by adjusting the x and y coordinates in the ax.text() method. Here’s an example that places the title in the upper-left corner of the plot:
import matplotlib.pyplot as plt
import numpy as np

x = np.linspace(0, 10, 100)
y = np.cos(x)

fig, ax = plt.subplots(figsize=(10, 6))
ax.plot(x, y)

ax.text(0.05, 0.95, 'Cosine Wave - how2matplotlib.com',
        horizontalalignment='left', verticalalignment='top',
        transform=ax.transAxes, fontsize=16, fontweight='bold')

ax.set_title('')
plt.show()

print("The plot has been displayed with the title in the upper-left corner.")
Output:
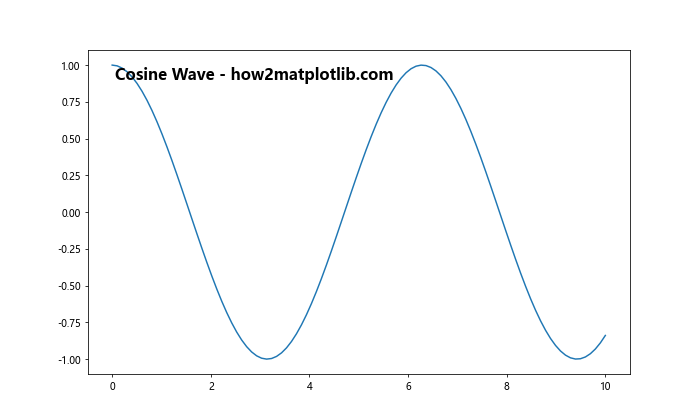
In this example, we set the x-coordinate to 0.05 and the y-coordinate to 0.95, placing the title near the top-left corner of the plot. The horizontalalignment='left' and verticalalignment='top' arguments ensure that the text is aligned correctly relative to its position.
2.2 Styling the Title
You can customize the appearance of the title by adjusting various parameters such as font size, color, style, and background. Here’s an example that demonstrates these customizations:
import matplotlib.pyplot as plt
import numpy as np

x = np.linspace(0, 10, 100)
y = np.tan(x)

fig, ax = plt.subplots(figsize=(10, 6))
ax.plot(x, y)

ax.text(0.5, 0.95, 'Tangent Function - how2matplotlib.com',
        horizontalalignment='center', verticalalignment='top',
        transform=ax.transAxes, fontsize=18, fontweight='bold',
        color='white', bbox=dict(facecolor='red', alpha=0.8, edgecolor='none', pad=5))

ax.set_title('')
plt.show()

print("The plot has been displayed with a styled title inside.")
Output:
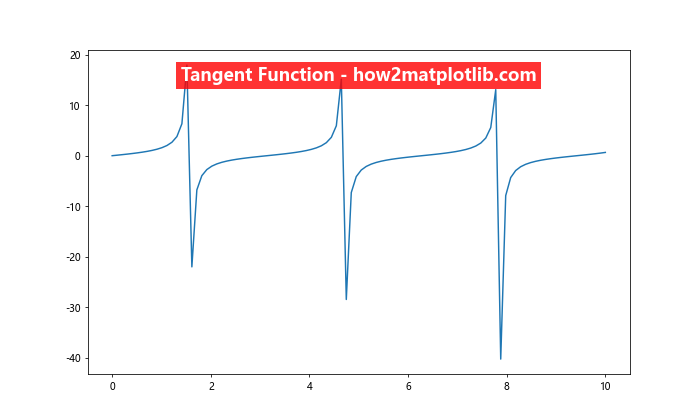
In this example, we’ve added several styling elements to the title:
fontsize=18increases the font sizefontweight='bold'makes the text boldcolor='white'sets the text color to whitebboxadds a red background box with some padding and transparency
These customizations make the title stand out and ensure it’s readable against the plot background.
3. Dynamic Title Placement
In some cases, you may want to place the title dynamically based on the data or plot characteristics. This section will explore techniques for dynamically positioning titles inside plots.
3.1 Placing Title at Data Points
You can place the title at a specific data point on the plot. This can be useful when you want to highlight a particular feature of the data. Here’s an example:
import matplotlib.pyplot as plt
import numpy as np

x = np.linspace(0, 10, 100)
y = np.exp(-x/10) * np.sin(5*x)

fig, ax = plt.subplots(figsize=(10, 6))
ax.plot(x, y)

max_index = np.argmax(y)
ax.text(x[max_index], y[max_index], 'Peak - how2matplotlib.com',
        horizontalalignment='right', verticalalignment='bottom',
        fontsize=16, fontweight='bold')

ax.set_title('')
plt.show()

print("The plot has been displayed with the title at the peak of the curve.")
Output:
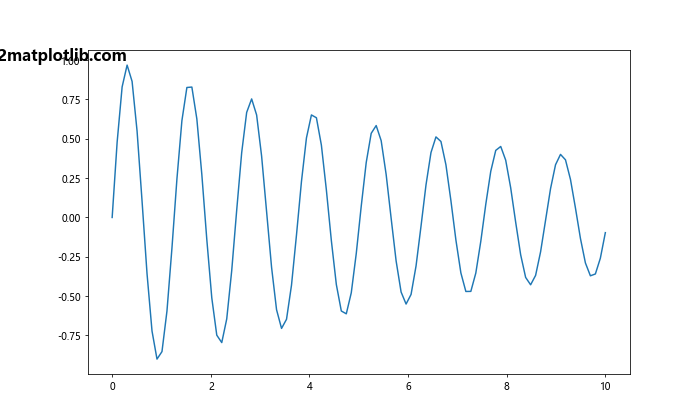
In this example, we find the index of the maximum y-value using np.argmax() and place the title at that point. This dynamically positions the title at the peak of the curve.
3.2 Avoiding Overlap with Data
When placing titles inside plots, it’s important to ensure they don’t overlap with important data points. Here’s an example that demonstrates how to place a title while avoiding data overlap:
import matplotlib.pyplot as plt
import numpy as np

x = np.linspace(0, 10, 100)
y1 = np.sin(x)
y2 = np.cos(x)

fig, ax = plt.subplots(figsize=(10, 6))
ax.plot(x, y1, label='Sine')
ax.plot(x, y2, label='Cosine')

ax.legend()

# Find the maximum y-value
y_max = max(np.max(y1), np.max(y2))

ax.text(0.5, y_max + 0.1, 'Sine and Cosine - how2matplotlib.com',
        horizontalalignment='center', verticalalignment='bottom',
        transform=ax.transAxes, fontsize=16, fontweight='bold')

ax.set_title('')
plt.show()

print("The plot has been displayed with the title placed to avoid data overlap.")
Output:
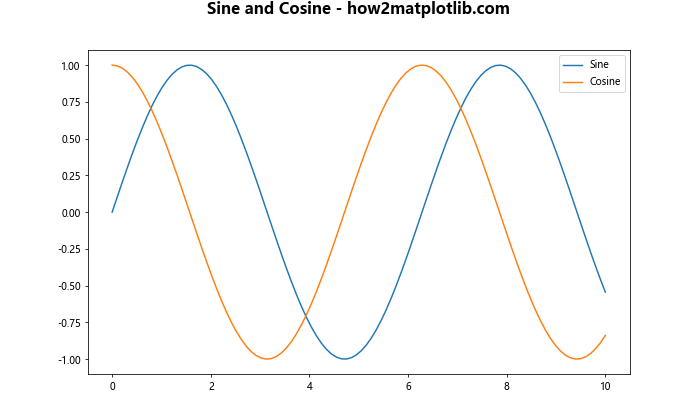
In this example, we calculate the maximum y-value across both curves and place the title slightly above this value. This ensures that the title doesn’t overlap with the plotted data.
4. Multiple Titles and Annotations
Sometimes, you may want to include multiple titles or annotations within your plot. This section will explore techniques for adding and organizing multiple text elements inside a plot.
4.1 Main Title and Subtitle
You can create a hierarchy of titles by using different sizes and positions. Here’s an example that demonstrates a main title with a subtitle:
import matplotlib.pyplot as plt
import numpy as np

x = np.linspace(0, 2*np.pi, 100)
y = np.sin(x)

fig, ax = plt.subplots(figsize=(10, 6))
ax.plot(x, y)

ax.text(0.5, 0.95, 'Sine Wave - how2matplotlib.com',
        horizontalalignment='center', verticalalignment='top',
        transform=ax.transAxes, fontsize=18, fontweight='bold')

ax.text(0.5, 0.89, 'A study of periodic functions',
        horizontalalignment='center', verticalalignment='top',
        transform=ax.transAxes, fontsize=14, fontstyle='italic')

ax.set_title('')
plt.show()

print("The plot has been displayed with a main title and subtitle inside.")
Output:
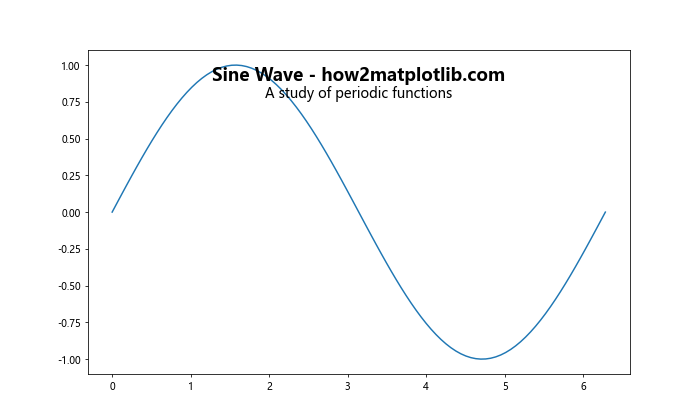
In this example, we use two ax.text() calls to create a main title and a subtitle. The main title is larger and bold, while the subtitle is slightly smaller and italicized.
4.2 Annotations and Callouts
In addition to titles, you can add annotations or callouts to highlight specific features of your plot. Here’s an example that demonstrates this:
import matplotlib.pyplot as plt
import numpy as np

x = np.linspace(0, 2*np.pi, 100)
y = np.sin(x)

fig, ax = plt.subplots(figsize=(10, 6))
ax.plot(x, y)

ax.text(0.5, 0.95, 'Sine Wave - how2matplotlib.com',
        horizontalalignment='center', verticalalignment='top',
        transform=ax.transAxes, fontsize=18, fontweight='bold')

ax.annotate('Peak', xy=(np.pi/2, 1), xytext=(np.pi/2 + 0.5, 0.8),
            arrowprops=dict(facecolor='black', shrink=0.05))

ax.annotate('Trough', xy=(3*np.pi/2, -1), xytext=(3*np.pi/2 - 0.5, -0.8),
            arrowprops=dict(facecolor='black', shrink=0.05))

ax.set_title('')
plt.show()

print("The plot has been displayed with a title and annotations inside.")
Output:
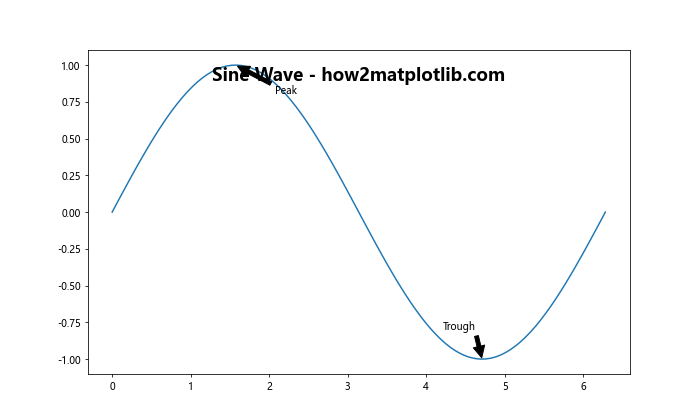
In this example, we use ax.annotate() to add callouts for the peak and trough of the sine wave. The xy parameter specifies the point to annotate, while xytext specifies where to place the annotation text. The arrowprops parameter adds an arrow connecting the annotation to the point.
5. Handling Multiple Subplots
When working with multiple subplots, you may want to add titles inside each subplot as well as an overall title for the entire figure. This section will explore techniques for handling titles in multi-subplot layouts.
5.1 Titles in Individual Subplots
Here’s an example that demonstrates how to add titles inside individual subplots:
import matplotlib.pyplot as plt
import numpy as np

x = np.linspace(0, 2*np.pi, 100)

fig, (ax1, ax2) = plt.subplots(1, 2, figsize=(15, 6))

ax1.plot(x, np.sin(x))
ax1.text(0.5, 0.95, 'Sine Wave - how2matplotlib.com',
         horizontalalignment='center', verticalalignment='top',
         transform=ax1.transAxes, fontsize=14, fontweight='bold')

ax2.plot(x, np.cos(x))
ax2.text(0.5, 0.95, 'Cosine Wave - how2matplotlib.com',
         horizontalalignment='center', verticalalignment='top',
         transform=ax2.transAxes, fontsize=14, fontweight='bold')

fig.suptitle('Trigonometric Functions', fontsize=16)
plt.show()

print("The plot has been displayed with titles inside individual subplots.")
Output:
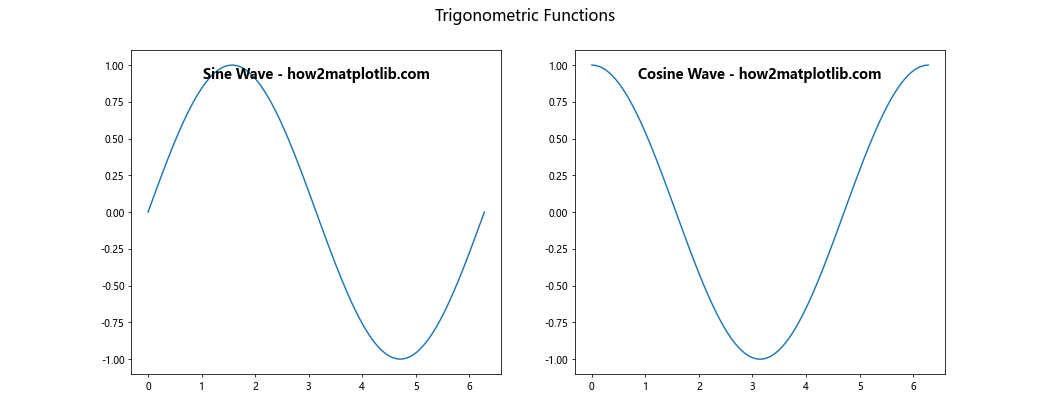
In this example, we create two subplots and add a title inside each using ax.text(). We also add an overall title for the figure using fig.suptitle().
6. Handling Different Plot Types
Different types of plots may require different approaches to placing titles inside the plot area. This section will explore techniques for handling titles in various plot types.
6.1 Bar Plots
For bar plots, you might want to place the title above the bars but still within the plot area. Here’s an example:
import matplotlib.pyplot as plt
import numpy as np

categories = ['A', 'B', 'C', 'D', 'E']
values = np.random.rand(5) * 10

fig, ax = plt.subplots(figsize=(10, 6))
ax.bar(categories, values)

ax.text(0.5, 1.05, 'Random Bar Plot - how2matplotlib.com',
        horizontalalignment='center', verticalalignment='bottom',
        transform=ax.transAxes, fontsize=16, fontweight='bold')

ax.set_ylim(0, max(values) * 1.2)  # Extend y-axis to make room for title
ax.set_title('')
plt.show()

print("The bar plot has been displayed with the title inside.")
Output:
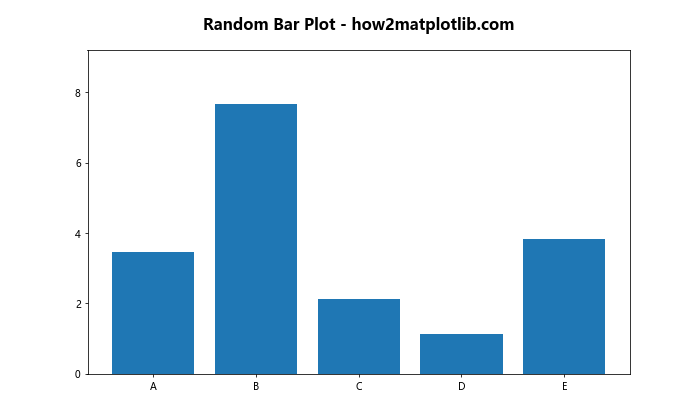
In this example, we place the title slightly above the plot area (y=1.05 in axes coordinates) and extend the y-axis limit to make room for it.
6.2 Scatter Plots
For scatter plots, you might want to place the title in a corner where it doesn’t overlap with data points. Here’s an example:
import matplotlib.pyplot as plt
import numpy as np

x = np.random.rand(50)
y = np.random.rand(50)
colors = np.random.rand(50)
sizes = 1000 * np.random.rand(50)

fig, ax = plt.subplots(figsize=(10, 6))
scatter = ax.scatter(x, y, c=colors, s=sizes, alpha=0.5)

ax.text(0.05, 0.95, 'Random Scatter Plot - how2matplotlib.com',
        horizontalalignment='left', verticalalignment='top',
        transform=ax.transAxes, fontsize=16, fontweight='bold',
        bbox=dict(facecolor='white', alpha=0.8, edgecolor='none'))

ax.set_title('')
plt.colorbar(scatter)
plt.show()

print("The scatter plot has been displayed with the title inside.")
Output:
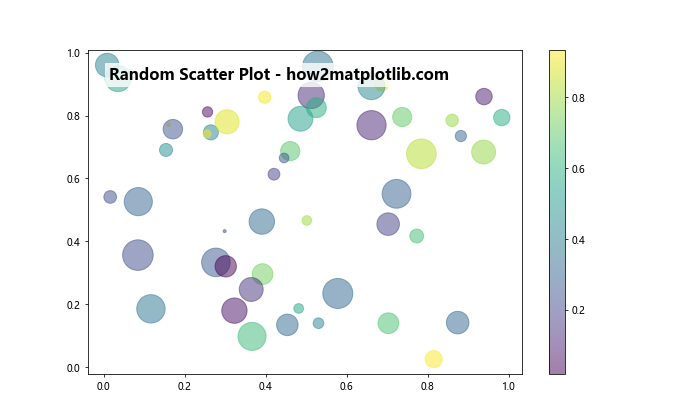
In this example, we place the title in the upper-left corner of the plot and add a semi-transparent white background to ensure it’s readable against the scatter plot.
6.3 Pie Charts
For pie charts, you might want to place the title in the center of the chart. Here’s an example:
import matplotlib.pyplot as plt

sizes = [30, 20, 25, 15, 10]
labels = ['A', 'B', 'C', 'D', 'E']
colors = ['#ff9999','#66b3ff', '#99ff99', '#ffcc99', '#ff99cc']

fig, ax = plt.subplots(figsize=(10, 10))
ax.pie(sizes, labels=labels, colors=colors, autopct='%1.1f%%', startangle=90)
ax.axis('equal')

ax.text(0, 0, 'Distribution - how2matplotlib.com',
        horizontalalignment='center', verticalalignment='center',
        fontsize=16, fontweight='bold')

plt.show()

print("The pie chart has been displayed with the title in the center.")
Output:
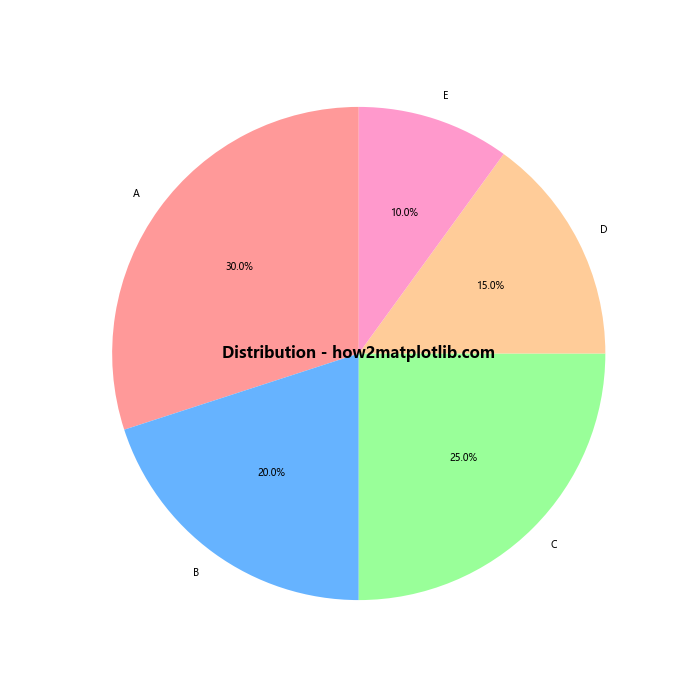
In this example, we place the title at the center of the pie chart (coordinates 0, 0).
7. Advanced Techniques for Title Placement
This section will explore some advanced techniques for placing and styling titles inside plots.
7.1 Using Text Boxes
Text boxes can be useful for creating more complex title layouts or for adding background colors and borders. Here’s an example:
import matplotlib.pyplot as plt
import matplotlib.patches as patches
import numpy as np

x = np.linspace(0, 10, 100)
y = np.sin(x)

fig, ax = plt.subplots(figsize=(10, 6))
ax.plot(x, y)

# Create a text box
props = dict(boxstyle='round', facecolor='wheat', alpha=0.5)
ax.text(0.05, 0.95, 'Sine Wave - how2matplotlib.com\nA study of periodic functions',
        transform=ax.transAxes, fontsize=14,
        verticalalignment='top', bbox=props)

ax.set_title('')
plt.show()

print("The plot has been displayed with a title in a text box.")
Output:
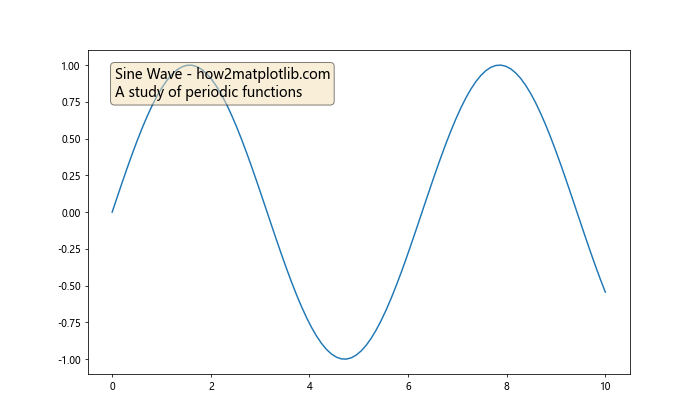
In this example, we use a dictionary props to define the properties of the text box, including its style, background color, and transparency.
7.2 Rotated Titles
In some cases, you might want to rotate the title for a different visual effect or to fit long titles in tight spaces. Here’s an example:
import matplotlib.pyplot as plt
import numpy as np

x = np.linspace(0, 10, 100)
y = np.exp(-x/10) * np.cos(5*x)

fig, ax = plt.subplots(figsize=(10, 6))
ax.plot(x, y)

ax.text(0.02, 0.5, 'Damped Oscillation - how2matplotlib.com',
        transform=ax.transAxes, fontsize=16, fontweight='bold',
        rotation=90, verticalalignment='center')

ax.set_title('')
plt.show()

print("The plot has been displayed with a rotated title.")
Output:
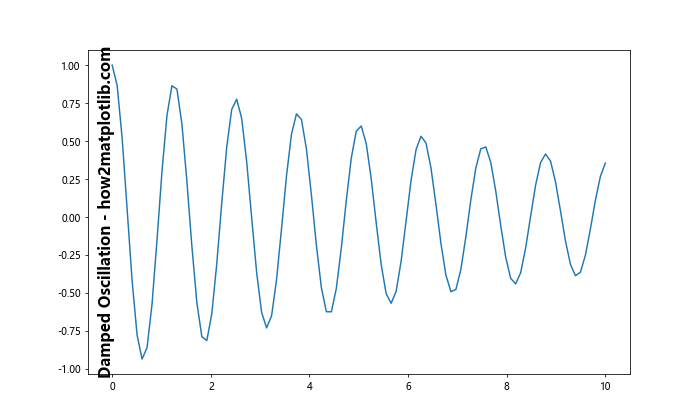
In this example, we use the rotation=90 parameter to create a vertical title along the left side of the plot.
7.3 Gradient Text
For a more eye-catching title, you can create a gradient effect using multiple text objects. Here’s an example:
import matplotlib.pyplot as plt
import numpy as np
from matplotlib import colors

x = np.linspace(0, 10, 100)
y = np.sin(x) * np.exp(-x/10)

fig, ax = plt.subplots(figsize=(10, 6))
ax.plot(x, y)

title = "Damped Sine Wave - how2matplotlib.com"
gradient = np.linspace(0, 1, len(title))
cmap = plt.get_cmap('coolwarm')

for i, char in enumerate(title):
    color = colors.rgb2hex(cmap(gradient[i]))
    ax.text(0.5 + i*0.02, 0.95, char,
            transform=ax.transAxes, fontsize=16, fontweight='bold',
            color=color, horizontalalignment='center')

ax.set_title('')
plt.show()

print("The plot has been displayed with a gradient title.")
Output:
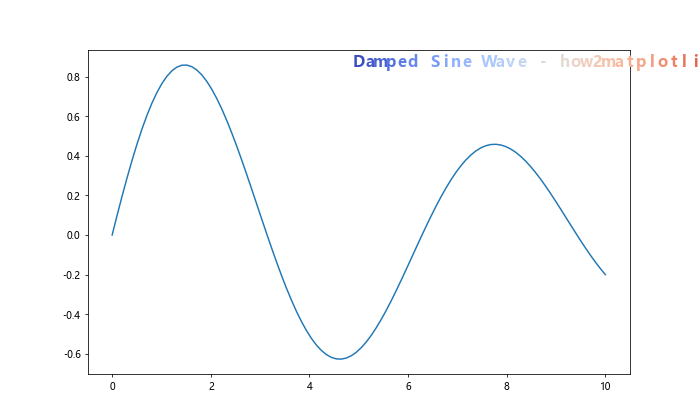
In this example, we create a gradient effect by placing each character of the title separately and assigning it a color from a colormap.
8. Handling Long Titles
When dealing with long titles, special considerations may be needed to ensure they fit well within the plot area.
8.1 Multi-line Titles
For very long titles, breaking them into multiple lines can be an effective solution. Here’s an example:
import matplotlib.pyplot as plt
import numpy as np

x = np.linspace(0, 10, 100)
y = np.sin(x) * np.exp(-x/10)

fig, ax = plt.subplots(figsize=(10, 6))
ax.plot(x, y)

title = "Damped Sine Wave:\nAn Exploration of Decay\nand Oscillation\n- how2matplotlib.com"
ax.text(0.5, 0.95, title,
        transform=ax.transAxes, fontsize=14, fontweight='bold',
        verticalalignment='top', horizontalalignment='center')

ax.set_title('')
plt.show()

print("The plot has been displayed with a multi-line title.")
Output:
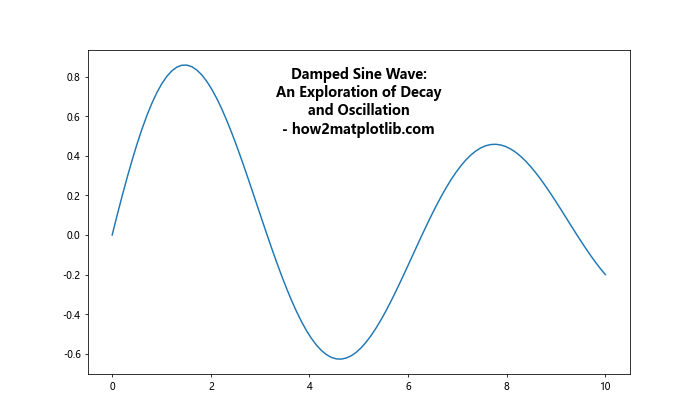
In this example, we use ‘\n’ characters to create line breaks in the title text.
8.2 Adjusting Plot Area for Long Titles
When placing long titles inside the plot, you may need to adjust the plot area to accommodate them. Here’s an example:
import matplotlib.pyplot as plt
import numpy as np

x = np.linspace(0, 10, 100)
y = np.sin(x) * np.cos(2*x)

fig, ax = plt.subplots(figsize=(10, 6))
ax.plot(x, y)

title = "Complex Oscillation: Interaction of Sine and Cosine Waves - how2matplotlib.com"
ax.text(0.5, 1.05, title,
        transform=ax.transAxes, fontsize=12, fontweight='bold',
        verticalalignment='bottom', horizontalalignment='center')

ax.set_title('')
plt.subplots_adjust(top=0.85)  # Adjust the top margin
plt.show()

print("The plot has been displayed with adjusted area for a long title.")
Output:
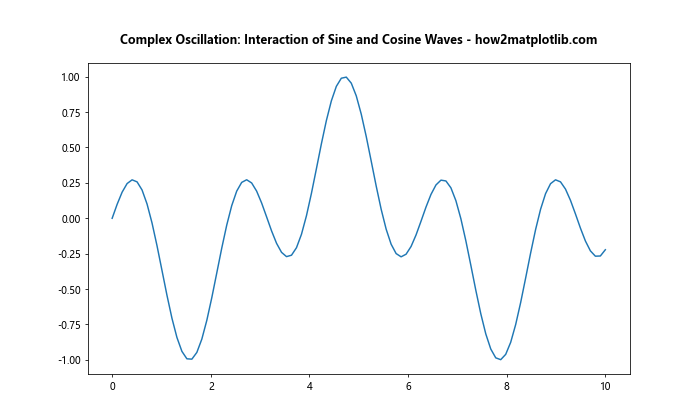
In this example, we use plt.subplots_adjust(top=0.85) to create more space at the top of the plot for the long title.
9. Integrating with Plot Legends
When placing titles inside plots, it’s important to consider how they interact with other plot elements, such as legends.
9.1 Placing Titles and Legends Together
Here’s an example of how to place both a title and a legend inside a plot:
import matplotlib.pyplot as plt
import numpy as np

x = np.linspace(0, 10, 100)
y1 = np.sin(x)
y2 = np.cos(x)

fig, ax = plt.subplots(figsize=(10, 6))
ax.plot(x, y1, label='Sine')
ax.plot(x, y2, label='Cosine')

ax.text(0.5, 1.05, 'Trigonometric Functions - how2matplotlib.com',
        transform=ax.transAxes, fontsize=16, fontweight='bold',
        verticalalignment='bottom', horizontalalignment='center')

ax.legend(loc='upper right')

ax.set_title('')
plt.subplots_adjust(top=0.85)
plt.show()

print("The plot has been displayed with both a title and legend inside.")
Output:
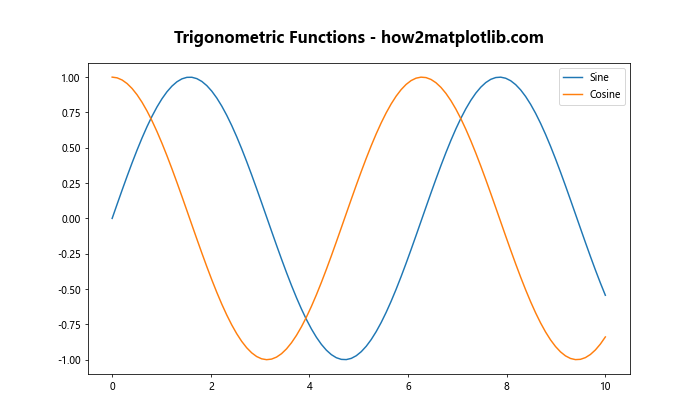
In this example, we place the title at the top of the plot and the legend in the upper right corner.
9.2 Using a Legend as a Title
In some cases, you might want to use the legend itself as a title. Here’s an example:
import matplotlib.pyplot as plt
import numpy as np

x = np.linspace(0, 10, 100)
y1 = np.sin(x)
y2 = np.cos(x)

fig, ax = plt.subplots(figsize=(10, 6))
ax.plot(x, y1, label='Sine')
ax.plot(x, y2, label='Cosine')

legend = ax.legend(title='Trigonometric Functions - how2matplotlib.com',
                   loc='upper center', bbox_to_anchor=(0.5, 1.15),
                   ncol=2, fancybox=True, shadow=True)
legend.get_title().set_fontweight('bold')

ax.set_title('')
plt.subplots_adjust(top=0.85)
plt.show()

print("The plot has been displayed with the legend used as a title.")
Output:
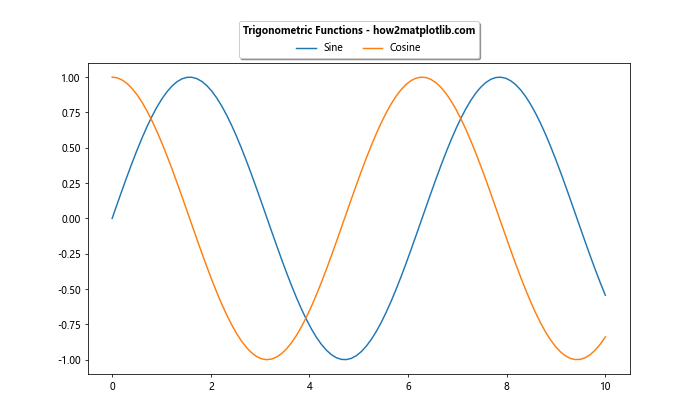
In this example, we use the legend’s title as the main title for the plot, placing it above the plot area.
10. Responsive Title Placement
When creating plots that may be resized or displayed on different devices, it can be helpful to make title placement responsive to changes in plot size.
10.1 Using Figure Events
Here’s an example of how to adjust title placement when the figure is resized:
import matplotlib.pyplot as plt
import numpy as np

def update_title(event):
    bbox = ax.get_position()
    title.set_position((0.5, bbox.y1 + 0.05))

x = np.linspace(0, 10, 100)
y = np.sin(x)

fig, ax = plt.subplots(figsize=(10, 6))
ax.plot(x, y)

title = ax.text(0.5, 1.05, 'Sine Wave - how2matplotlib.com',
                transform=ax.transAxes, fontsize=16, fontweight='bold',
                verticalalignment='bottom', horizontalalignment='center')

fig.canvas.mpl_connect('resize_event', update_title)

ax.set_title('')
plt.show()

print("The plot has been displayed with a responsive title placement.")
Output:
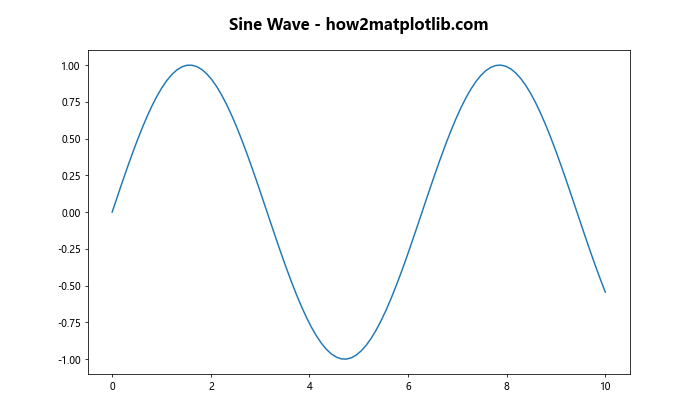
In this example, we define an update_title function that adjusts the title position based on the current axes position. This function is called whenever the figure is resized.
Matplotlib Title Inside Plot Conclusion
Placing titles inside plots in Matplotlib offers a wide range of creative possibilities for enhancing the visual appeal and informativeness of your visualizations. By leveraging the techniques discussed in this article, you can create plots with titles that are not only informative but also seamlessly integrated into the overall design of your figures.
Remember that the key to effective title placement is to balance visibility, readability, and aesthetic appeal. Experiment with different positions, styles, and techniques to find what works best for your specific data and audience.
As you continue to explore Matplotlib, you’ll discover even more ways to customize and enhance your plots. The flexibility of Matplotlib allows for endless possibilities in data visualization, and mastering title placement is just one step in creating truly impactful and professional-looking plots.