How to Create a Matplotlib Pie Chart with Percentage: A Comprehensive Guide
Matplotlib pie chart with percentage is a powerful visualization tool that allows you to represent data in a circular graph, showing the proportion of each category as a slice of the pie. In this comprehensive guide, we’ll explore various aspects of creating and customizing matplotlib pie charts with percentages, providing you with the knowledge and skills to effectively visualize your data.
Introduction to Matplotlib Pie Charts with Percentage
Matplotlib pie chart with percentage is an essential feature of the matplotlib library, which is widely used for data visualization in Python. A pie chart is particularly useful when you want to show the composition of a whole, with each slice representing a category’s proportion. Adding percentages to these slices enhances the chart’s readability and provides precise information about each category’s contribution.
Let’s start with a basic example of a matplotlib pie chart with percentage:
import matplotlib.pyplot as plt

# Data for the pie chart
sizes = [30, 20, 25, 15, 10]
labels = ['A', 'B', 'C', 'D', 'E']

# Create the pie chart
plt.pie(sizes, labels=labels, autopct='%1.1f%%')

# Add a title
plt.title('Matplotlib Pie Chart with Percentage - how2matplotlib.com')

# Display the chart
plt.show()
Output:
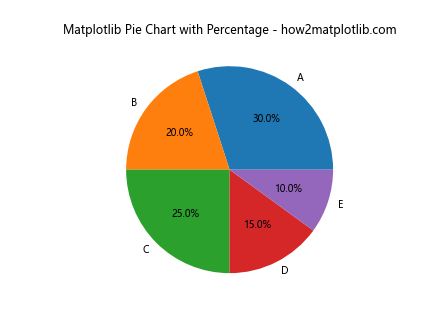
In this example, we create a simple matplotlib pie chart with percentage using the plt.pie() function. The sizes list contains the values for each slice, while labels provides the corresponding category names. The autopct parameter is set to '%1.1f%%' to display percentages with one decimal place.
Customizing Colors in Matplotlib Pie Charts with Percentage
One of the key aspects of creating an effective matplotlib pie chart with percentage is choosing appropriate colors for each slice. Matplotlib offers various ways to customize the color scheme of your pie chart.
Here’s an example demonstrating how to use custom colors in a matplotlib pie chart with percentage:
import matplotlib.pyplot as plt

# Data for the pie chart
sizes = [35, 25, 20, 15, 5]
labels = ['Category A', 'Category B', 'Category C', 'Category D', 'Category E']
colors = ['#ff9999', '#66b3ff', '#99ff99', '#ffcc99', '#ff99cc']

# Create the pie chart
plt.pie(sizes, labels=labels, colors=colors, autopct='%1.1f%%')

# Add a title
plt.title('Custom Colors in Matplotlib Pie Chart with Percentage - how2matplotlib.com')

# Display the chart
plt.show()
Output:
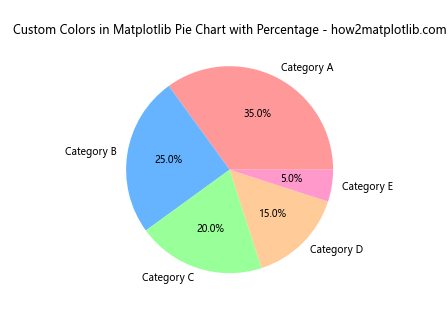
In this example, we define a custom list of colors using hexadecimal color codes. The colors parameter in the plt.pie() function is used to assign these colors to the slices of the matplotlib pie chart with percentage.
Adding a Legend to Matplotlib Pie Charts with Percentage
While labels on the pie slices can be informative, sometimes it’s beneficial to add a legend to your matplotlib pie chart with percentage, especially when dealing with many categories or long labels.
Here’s how you can add a legend to your matplotlib pie chart with percentage:
import matplotlib.pyplot as plt

# Data for the pie chart
sizes = [30, 25, 20, 15, 10]
labels = ['Product A', 'Product B', 'Product C', 'Product D', 'Product E']
colors = ['#ff9999', '#66b3ff', '#99ff99', '#ffcc99', '#ff99cc']

# Create the pie chart
plt.pie(sizes, colors=colors, autopct='%1.1f%%', startangle=90)

# Add a legend
plt.legend(labels, title="Products", loc="center left", bbox_to_anchor=(1, 0, 0.5, 1))

# Add a title
plt.title('Matplotlib Pie Chart with Percentage and Legend - how2matplotlib.com')

# Ensure the pie chart is circular
plt.axis('equal')

# Display the chart
plt.show()
Output:
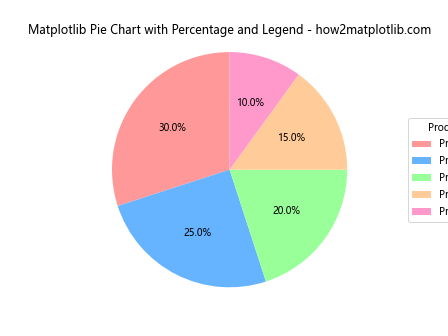
In this example, we use the plt.legend() function to add a legend to our matplotlib pie chart with percentage. The loc and bbox_to_anchor parameters are used to position the legend outside the pie chart.
Exploding Slices in Matplotlib Pie Charts with Percentage
To emphasize certain slices in your matplotlib pie chart with percentage, you can use the “explode” effect, which separates one or more slices from the main pie.
Here’s an example of how to create an exploded matplotlib pie chart with percentage:
import matplotlib.pyplot as plt

# Data for the pie chart
sizes = [35, 25, 20, 15, 5]
labels = ['Category A', 'Category B', 'Category C', 'Category D', 'Category E']
colors = ['#ff9999', '#66b3ff', '#99ff99', '#ffcc99', '#ff99cc']
explode = (0.1, 0, 0, 0, 0)  # Explode the first slice

# Create the pie chart
plt.pie(sizes, explode=explode, labels=labels, colors=colors, autopct='%1.1f%%', shadow=True, startangle=90)

# Add a title
plt.title('Exploded Matplotlib Pie Chart with Percentage - how2matplotlib.com')

# Ensure the pie chart is circular
plt.axis('equal')

# Display the chart
plt.show()
Output:
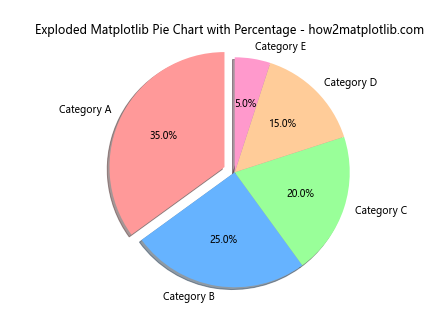
In this example, we use the explode parameter to separate the first slice from the rest of the pie. The shadow parameter is set to True to add a shadow effect, enhancing the visual appeal of the matplotlib pie chart with percentage.
Customizing Text Properties in Matplotlib Pie Charts with Percentage
The text elements in a matplotlib pie chart with percentage, including labels and percentage values, can be customized to improve readability and aesthetics.
Here’s an example demonstrating how to customize text properties in a matplotlib pie chart with percentage:
import matplotlib.pyplot as plt

# Data for the pie chart
sizes = [30, 25, 20, 15, 10]
labels = ['A', 'B', 'C', 'D', 'E']
colors = ['#ff9999', '#66b3ff', '#99ff99', '#ffcc99', '#ff99cc']

# Create the pie chart
plt.pie(sizes, labels=labels, colors=colors, autopct='%1.1f%%',
        textprops={'fontsize': 14, 'fontweight': 'bold', 'color': 'white'})

# Add a title
plt.title('Customized Text in Matplotlib Pie Chart with Percentage - how2matplotlib.com', fontsize=16)

# Ensure the pie chart is circular
plt.axis('equal')

# Display the chart
plt.show()
Output:
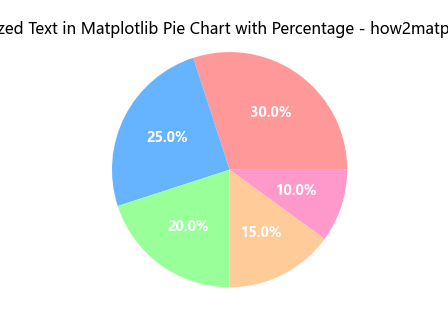
In this example, we use the textprops parameter to customize the font size, weight, and color of the text in our matplotlib pie chart with percentage. The title’s font size is also adjusted using the fontsize parameter in the plt.title() function.
Creating a Donut Chart with Matplotlib Pie Chart with Percentage
A variation of the standard pie chart is the donut chart, which has a hole in the center. This can be achieved using matplotlib pie chart with percentage functionality.
Here’s how to create a donut chart using matplotlib pie chart with percentage:
import matplotlib.pyplot as plt

# Data for the donut chart
sizes = [35, 25, 20, 15, 5]
labels = ['Category A', 'Category B', 'Category C', 'Category D', 'Category E']
colors = ['#ff9999', '#66b3ff', '#99ff99', '#ffcc99', '#ff99cc']

# Create the donut chart
plt.pie(sizes, labels=labels, colors=colors, autopct='%1.1f%%', startangle=90, pctdistance=0.85, wedgeprops=dict(width=0.5))

# Add a circle at the center to create the donut hole
centre_circle = plt.Circle((0,0), 0.70, fc='white')
fig = plt.gcf()
fig.gca().add_artist(centre_circle)

# Add a title
plt.title('Donut Chart using Matplotlib Pie Chart with Percentage - how2matplotlib.com')

# Ensure the pie chart is circular
plt.axis('equal')

# Display the chart
plt.show()
Output:
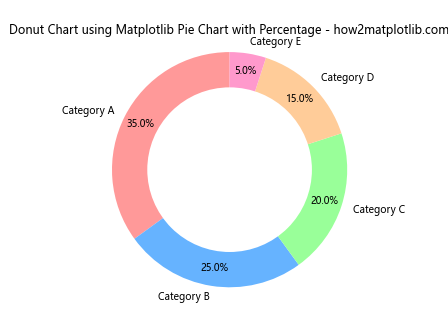
In this example, we use the wedgeprops parameter to set the width of the pie slices, creating the donut effect. We then add a white circle at the center using plt.Circle() to complete the donut chart appearance.
Handling Small Slices in Matplotlib Pie Charts with Percentage
When dealing with data that includes very small values, the resulting matplotlib pie chart with percentage might have slices that are too small to display labels or percentages clearly. One solution is to group these small slices into an “Others” category.
Here’s an example of how to handle small slices in a matplotlib pie chart with percentage:
import matplotlib.pyplot as plt

# Data for the pie chart
sizes = [30, 25, 15, 10, 5, 4, 3, 2, 1]
labels = ['A', 'B', 'C', 'D', 'E', 'F', 'G', 'H', 'I']

# Group small slices
threshold = 5
sizes_grouped = [size if size > threshold else 0 for size in sizes]
others = sum(size for size in sizes if size <= threshold)
sizes_grouped.append(others)

labels_grouped = [label if size > threshold else '' for label, size in zip(labels, sizes)]
labels_grouped.append('Others')

# Remove empty labels and corresponding sizes
sizes_final = [size for size, label in zip(sizes_grouped, labels_grouped) if label]
labels_final = [label for label in labels_grouped if label]

# Create the pie chart
plt.pie(sizes_final, labels=labels_final, autopct='%1.1f%%', startangle=90)

# Add a title
plt.title('Matplotlib Pie Chart with Percentage - Grouped Small Slices - how2matplotlib.com')

# Ensure the pie chart is circular
plt.axis('equal')

# Display the chart
plt.show()
Output:
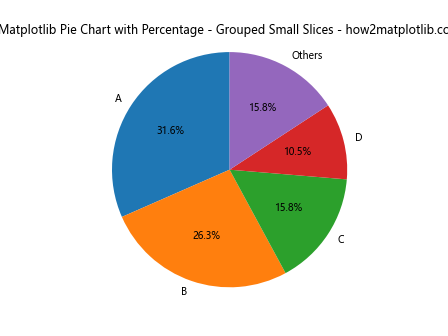
In this example, we group all slices smaller than 5% into an “Others” category. This approach helps to maintain the clarity of the matplotlib pie chart with percentage by preventing overcrowding of small slices.
Adding Data Labels to Matplotlib Pie Charts with Percentage
While percentages are informative, sometimes you might want to display the actual data values alongside the percentages in your matplotlib pie chart with percentage.
Here’s how you can add both percentages and data values to your matplotlib pie chart:
import matplotlib.pyplot as plt

# Data for the pie chart
sizes = [35, 25, 20, 15, 5]
labels = ['Category A', 'Category B', 'Category C', 'Category D', 'Category E']

# Function to format the autopct labels
def make_autopct(values):
    def my_autopct(pct):
        total = sum(values)
        val = int(round(pct*total/100.0))
        return f'{pct:.1f}%\n({val:d})'
    return my_autopct

# Create the pie chart
plt.pie(sizes, labels=labels, autopct=make_autopct(sizes), startangle=90)

# Add a title
plt.title('Matplotlib Pie Chart with Percentage and Values - how2matplotlib.com')

# Ensure the pie chart is circular
plt.axis('equal')

# Display the chart
plt.show()
Output:
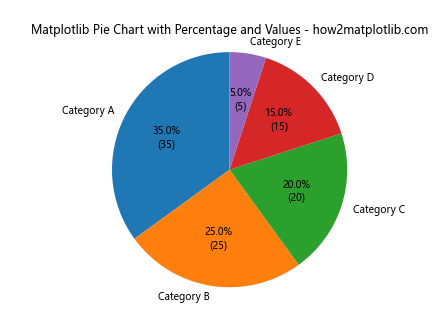
In this example, we define a custom function make_autopct() that returns another function my_autopct(). This inner function calculates both the percentage and the actual value for each slice, formatting them as a string to be displayed on the matplotlib pie chart with percentage.
Creating Multiple Pie Charts with Matplotlib
Sometimes, you might want to create multiple matplotlib pie charts with percentage for comparison. Matplotlib allows you to create subplots, which is perfect for this purpose.
Here’s an example of how to create multiple matplotlib pie charts with percentage:
import matplotlib.pyplot as plt

# Data for the pie charts
sizes1 = [35, 25, 20, 15, 5]
sizes2 = [30, 30, 15, 10, 15]
labels = ['A', 'B', 'C', 'D', 'E']

# Create a figure with two subplots
fig, (ax1, ax2) = plt.subplots(1, 2, figsize=(12, 6))

# Create the first pie chart
ax1.pie(sizes1, labels=labels, autopct='%1.1f%%', startangle=90)
ax1.set_title('Pie Chart 1 - how2matplotlib.com')

# Create the second pie chart
ax2.pie(sizes2, labels=labels, autopct='%1.1f%%', startangle=90)
ax2.set_title('Pie Chart 2 - how2matplotlib.com')

# Ensure the pie charts are circular
ax1.axis('equal')
ax2.axis('equal')

# Adjust the layout and display the charts
plt.tight_layout()
plt.show()
Output:
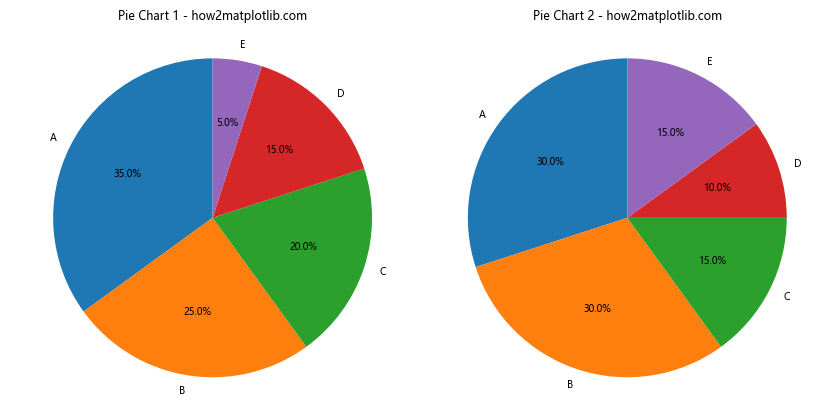
In this example, we use plt.subplots() to create a figure with two subplots. We then create a matplotlib pie chart with percentage in each subplot, allowing for easy comparison between two datasets.
Animating Matplotlib Pie Charts with Percentage
Adding animation to your matplotlib pie chart with percentage can make your visualization more engaging and dynamic, especially when presenting changing data over time.
Here’s an example of how to create an animated matplotlib pie chart with percentage:
import matplotlib.pyplot as plt
import matplotlib.animation as animation

# Data for the pie chart
sizes = [
    [30, 20, 25, 15, 10],
    [25, 25, 20, 20, 10],
    [20, 30, 15, 25, 10],
    [15, 35, 10, 30, 10],
    [10, 40, 5, 35, 10]
]
labels = ['A', 'B', 'C', 'D', 'E']

# Create the figure and axis
fig, ax = plt.subplots()

def update(frame):
    ax.clear()
    ax.pie(sizes[frame], labels=labels, autopct='%1.1f%%', startangle=90)
    ax.set_title(f'Animated Matplotlib Pie Chart with Percentage - Frame {frame+1} - how2matplotlib.com')
    ax.axis('equal')

# Create the animation
ani = animation.FuncAnimation(fig, update, frames=len(sizes), repeat=True, interval=1000)

plt.show()
Output:
In this example, we use matplotlib.animation.FuncAnimation() to create an animated matplotlib pie chart with percentage. The update() function is called for each frame, redrawing the pie chart with new data.
Saving Matplotlib Pie Charts with Percentage
After creating your matplotlib pie chart with percentage, you might want to save it for later use or to include in a report. Matplotlib provides several options for saving your charts.
Here’s an example of how to save a matplotlib pie chart with percentage:
import matplotlib.pyplot as plt

# Data for the pie chart
sizes = [35, 25, 20, 15, 5]
labels = ['Category A', 'Category B', 'Category C', 'Category D', 'Category E']
colors = ['#ff9999', '#66b3ff', '#99ff99', '#ffcc99', '#ff99cc']

# Create the pie chart
plt.figure(figsize=(10, 8))
plt.pie(sizes, labels=labels, colors=colors, autopct='%1.1f%%', startangle=90)

# Add a title
plt.title('Saved Matplotlib Pie Chart with Percentage - how2matplotlib.com')

# Ensure the pie chart is circular
plt.axis('equal')

# Save the chart
plt.savefig('pie_chart_percentage.png', dpi=300, bbox_inches='tight')

# Display the chart (optional)
plt.show()
Output:
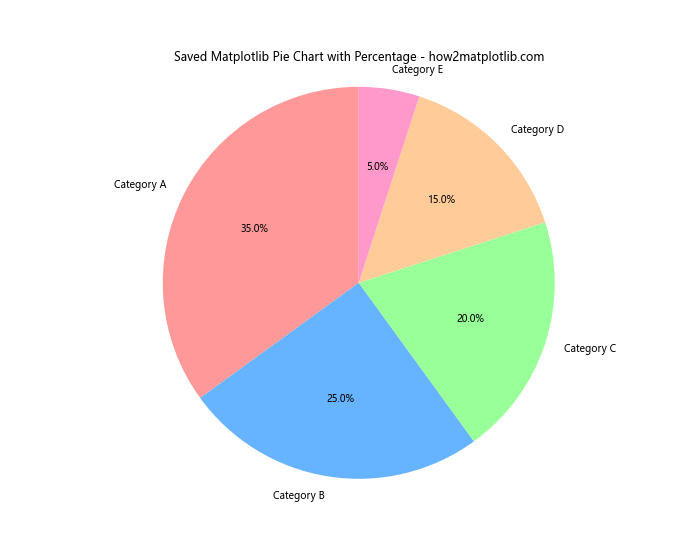
In this example, we use plt.savefig() to save our matplotlib piechart with percentage as a PNG file. The dpi parameter sets the resolution, and bbox_inches='tight' ensures that the entire chart, including labels and title, is saved without being cut off.
Using Nested Pie Charts with Matplotlib
Nested pie charts, also known as sunburst charts, can be created using matplotlib pie chart with percentage functionality. These charts are useful for displaying hierarchical data.
Here’s an example of how to create a nested matplotlib pie chart with percentage:
import matplotlib.pyplot as plt
import numpy as np

# Data for the nested pie chart
sizes_outer = [30, 40, 30]
sizes_inner = [15, 15, 20, 20, 15, 15]
labels_outer = ['Group A', 'Group B', 'Group C']
labels_inner = ['A1', 'A2', 'B1', 'B2', 'C1', 'C2']

# Colors for the chart
colors_outer = ['#ff9999', '#66b3ff', '#99ff99']
colors_inner = ['#ffcccc', '#ff9999', '#99ccff', '#66b3ff', '#ccffcc', '#99ff99']

# Create the outer pie chart
fig, ax = plt.subplots(figsize=(10, 8))
ax.pie(sizes_outer, labels=labels_outer, colors=colors_outer, autopct='%1.1f%%', startangle=90, pctdistance=0.85, wedgeprops=dict(width=0.3))

# Create the inner pie chart
ax.pie(sizes_inner, labels=labels_inner, colors=colors_inner, autopct='%1.1f%%', startangle=90, pctdistance=0.75, wedgeprops=dict(width=0.6))

# Add a title
plt.title('Nested Matplotlib Pie Chart with Percentage - how2matplotlib.com')

# Ensure the pie chart is circular
ax.axis('equal')

# Display the chart
plt.show()
Output:
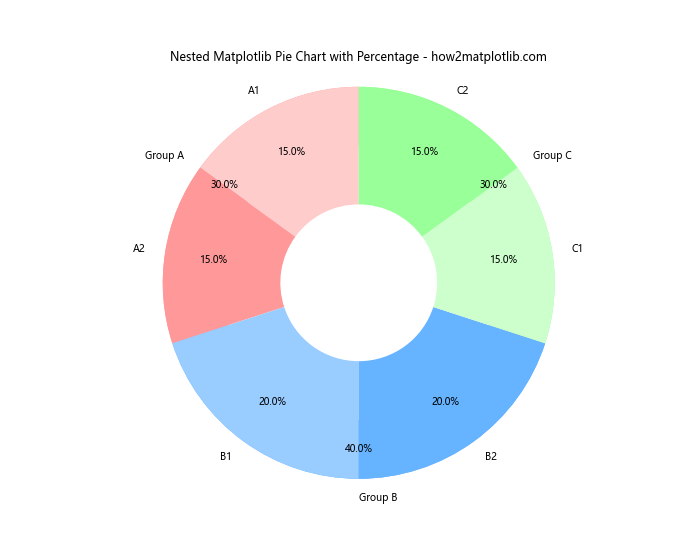
In this example, we create two pie charts: an outer chart representing the main categories and an inner chart showing subcategories. The wedgeprops parameter is used to control the width of each ring in the nested matplotlib pie chart with percentage.
Customizing the Appearance of Percentage Labels in Matplotlib Pie Charts
The appearance of percentage labels in a matplotlib pie chart with percentage can be further customized to enhance readability and visual appeal.
Here’s an example demonstrating various ways to customize percentage labels:
import matplotlib.pyplot as plt

# Data for the pie chart
sizes = [35, 25, 20, 15, 5]
labels = ['Category A', 'Category B', 'Category C', 'Category D', 'Category E']
colors = ['#ff9999', '#66b3ff', '#99ff99', '#ffcc99', '#ff99cc']

# Custom function for label formatting
def make_autopct(values):
    def my_autopct(pct):
        total = sum(values)
        val = int(round(pct*total/100.0))
        return f'{pct:.1f}%\n({val:d})'
    return my_autopct

# Create the pie chart
fig, ax = plt.subplots(figsize=(10, 8))
wedges, texts, autotexts = ax.pie(sizes, labels=labels, colors=colors, autopct=make_autopct(sizes),
                                  startangle=90, pctdistance=0.85, wedgeprops=dict(width=0.7))

# Customize the appearance of percentage labels
for autotext in autotexts:
    autotext.set_color('white')
    autotext.set_fontweight('bold')
    autotext.set_fontsize(10)

# Add a title
plt.title('Customized Percentage Labels in Matplotlib Pie Chart - how2matplotlib.com')

# Ensure the pie chart is circular
ax.axis('equal')

# Display the chart
plt.show()
Output:
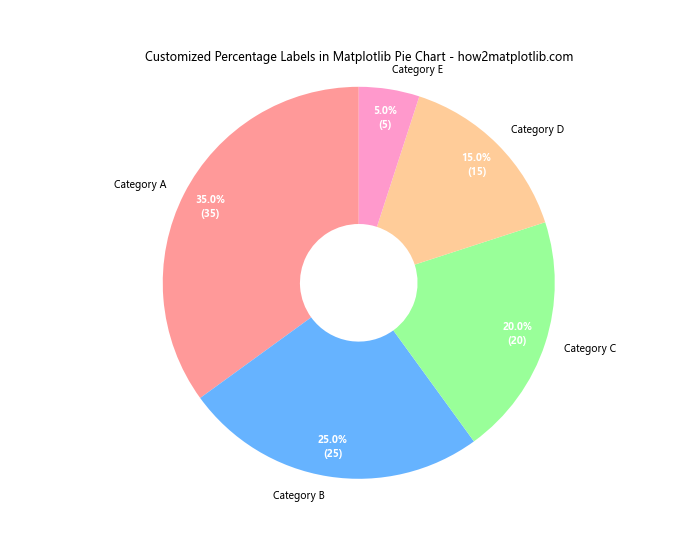
In this example, we use a custom function to format the percentage labels, including both the percentage and the actual value. We then customize the appearance of these labels by changing their color, font weight, and size.
Creating a Half Pie Chart with Matplotlib
While full pie charts are common, sometimes a half pie chart (also known as a semi-circle chart) can be more visually appealing or appropriate for certain data presentations.
Here’s how to create a half matplotlib pie chart with percentage:
import matplotlib.pyplot as plt

# Data for the half pie chart
sizes = [30, 25, 20, 15, 10]
labels = ['Category A', 'Category B', 'Category C', 'Category D', 'Category E']
colors = ['#ff9999', '#66b3ff', '#99ff99', '#ffcc99', '#ff99cc']

# Create the half pie chart
fig, ax = plt.subplots(figsize=(10, 6))
wedges, texts, autotexts = ax.pie(sizes, labels=labels, colors=colors, autopct='%1.1f%%',
                                  startangle=90, pctdistance=0.85, wedgeprops=dict(width=0.7))

# Only show the bottom half of the pie
ax.set_ylim(-1.1, 0)

# Add a title
plt.title('Half Matplotlib Pie Chart with Percentage - how2matplotlib.com')

# Ensure the pie chart is circular
ax.axis('equal')

# Display the chart
plt.show()
Output:
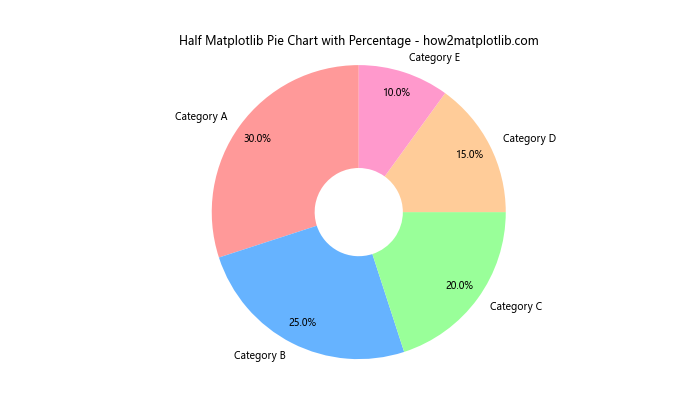
In this example, we create a full pie chart but then use ax.set_ylim(-1.1, 0) to show only the bottom half. This creates a half matplotlib pie chart with percentage, which can be useful for certain types of data visualization.
Matplotlib pie chart with percentage Conclusion
Matplotlib pie chart with percentage is a versatile and powerful tool for data visualization. Throughout this comprehensive guide, we’ve explored various aspects of creating and customizing matplotlib pie charts with percentages. From basic charts to more advanced techniques like nested charts and animations, matplotlib provides a wide range of options to create informative and visually appealing pie charts.
Key points to remember when working with matplotlib pie charts with percentage include:
- Use the
autopctparameter to display percentages on your chart. - Customize colors, labels, and text properties to enhance readability.
- Consider grouping small slices to improve clarity.
- Experiment with different chart types like donut charts or half pie charts.
- Use animations to display changing data over time.
- Save your charts in various formats for use in reports or presentations.
By mastering these techniques, you’ll be able to create effective matplotlib pie charts with percentage that clearly communicate your data insights. Remember to always consider your audience and the story you want to tell with your data when designing your charts.
Whether you’re a data scientist, analyst, or just someone interested in data visualization, matplotlib pie charts with percentage offer a powerful way to represent proportional or compositional data. With the knowledge gained from this guide, you’re now well-equipped to create stunning and informative pie charts using matplotlib.