How to Create a Matplotlib Pie Chart from DataFrame: A Comprehensive Guide
Matplotlib pie chart from DataFrame is a powerful visualization technique that allows you to represent data in a circular graph, making it easy to compare proportions and percentages. In this comprehensive guide, we’ll explore various aspects of creating a matplotlib pie chart from DataFrame, providing detailed explanations and examples along the way.
Understanding Matplotlib Pie Charts and DataFrames
Before diving into the specifics of creating a matplotlib pie chart from DataFrame, it’s essential to understand the basics of both components. A pie chart is a circular statistical graphic divided into slices to illustrate numerical proportions. In matplotlib, pie charts can be created using the pie() function. On the other hand, a DataFrame is a two-dimensional labeled data structure in pandas, which is commonly used for data manipulation and analysis.
When combining matplotlib pie charts with DataFrames, we can easily visualize proportional data stored in a tabular format. This combination is particularly useful when dealing with categorical data and their corresponding values or percentages.
Let’s start with a simple example of creating a matplotlib pie chart from DataFrame:
import matplotlib.pyplot as plt
import pandas as pd

# Create a sample DataFrame
data = {'Category': ['A', 'B', 'C', 'D'],
        'Value': [30, 20, 25, 25]}
df = pd.DataFrame(data)

# Create a pie chart
plt.figure(figsize=(8, 8))
plt.pie(df['Value'], labels=df['Category'], autopct='%1.1f%%')
plt.title('Matplotlib Pie Chart from DataFrame - how2matplotlib.com')
plt.axis('equal')
plt.show()
Output:
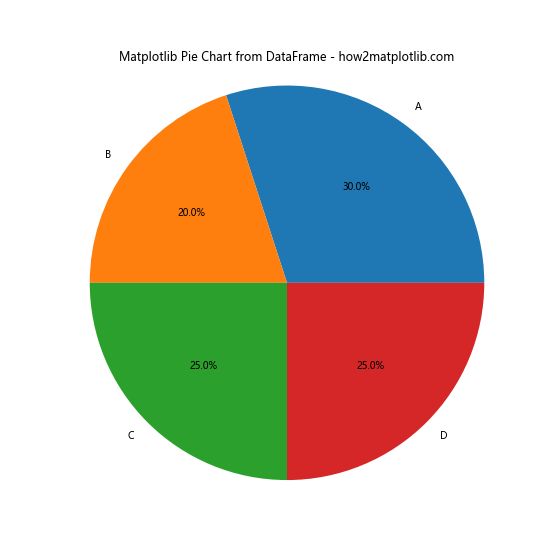
In this example, we create a simple DataFrame with two columns: ‘Category’ and ‘Value’. We then use matplotlib’s pie() function to create a pie chart, passing the ‘Value’ column as the data and ‘Category’ column as labels.
Customizing Matplotlib Pie Charts from DataFrame
One of the advantages of using matplotlib pie charts from DataFrame is the ability to customize various aspects of the visualization. Let’s explore some common customization options:
Colors and Explode
You can customize the colors of the pie slices and create an exploded effect to highlight specific segments:
import matplotlib.pyplot as plt
import pandas as pd

data = {'Category': ['A', 'B', 'C', 'D', 'E'],
        'Value': [25, 20, 15, 30, 10]}
df = pd.DataFrame(data)

colors = ['#ff9999', '#66b3ff', '#99ff99', '#ffcc99', '#ff99cc']
explode = (0.1, 0, 0, 0.2, 0)

plt.figure(figsize=(10, 8))
plt.pie(df['Value'], labels=df['Category'], colors=colors, explode=explode, autopct='%1.1f%%', shadow=True)
plt.title('Customized Matplotlib Pie Chart from DataFrame - how2matplotlib.com')
plt.axis('equal')
plt.show()
Output:
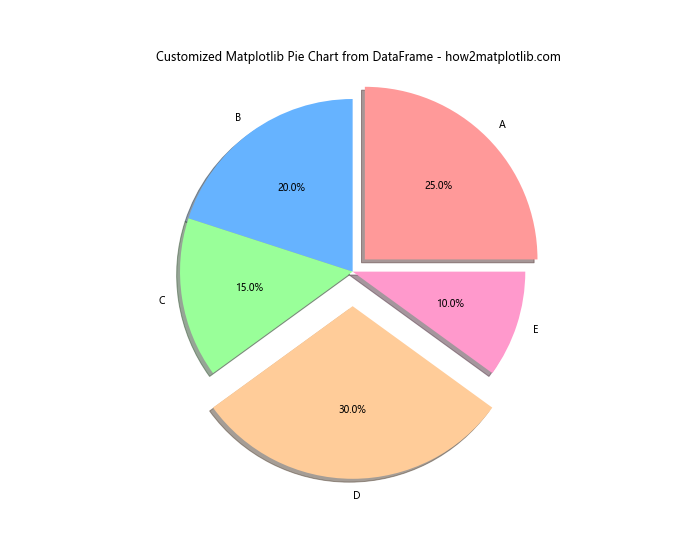
In this example, we define custom colors for each slice and use the explode parameter to separate specific slices from the center.
Adding a Legend
For better readability, you can add a legend to your matplotlib pie chart from DataFrame:
import matplotlib.pyplot as plt
import pandas as pd

data = {'Category': ['Product A', 'Product B', 'Product C', 'Product D'],
        'Sales': [1000, 1500, 800, 1200]}
df = pd.DataFrame(data)

plt.figure(figsize=(10, 8))
patches, texts, autotexts = plt.pie(df['Sales'], labels=df['Category'], autopct='%1.1f%%', startangle=90)
plt.title('Sales Distribution - how2matplotlib.com')
plt.legend(patches, df['Category'], title="Products", loc="center left", bbox_to_anchor=(1, 0, 0.5, 1))
plt.axis('equal')
plt.tight_layout()
plt.show()
Output:
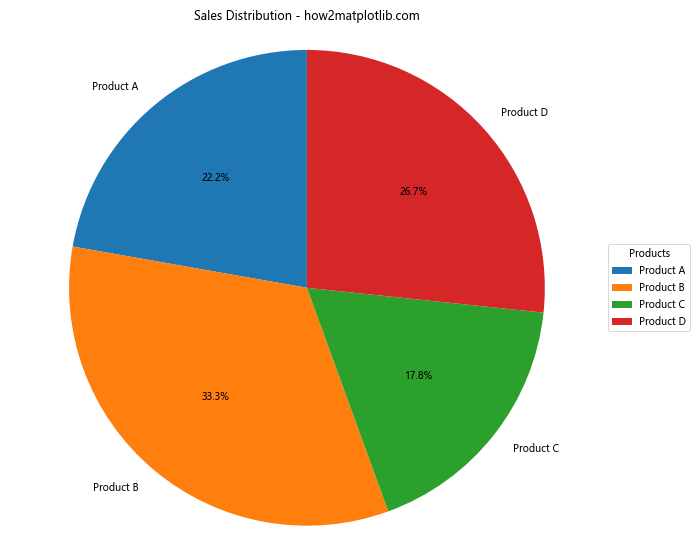
This example demonstrates how to add a legend to the pie chart, which can be particularly useful when dealing with many categories or long labels.
Handling Large Datasets in Matplotlib Pie Charts from DataFrame
When working with large datasets, creating a matplotlib pie chart from DataFrame can become challenging due to the limited space and readability issues. Here are some strategies to handle large datasets:
Using a Donut Chart
Another approach to handle large datasets is to use a donut chart, which can provide more space for labels:
import matplotlib.pyplot as plt
import pandas as pd

data = {'Category': [f'Category {i}' for i in range(10)],
        'Value': [10, 15, 8, 12, 9, 7, 6, 5, 4, 3]}
df = pd.DataFrame(data)

fig, ax = plt.subplots(figsize=(12, 8))
wedges, texts, autotexts = ax.pie(df['Value'], labels=df['Category'], autopct='%1.1f%%', pctdistance=0.85)

centre_circle = plt.Circle((0, 0), 0.70, fc='white')
fig.gca().add_artist(centre_circle)

ax.set_title('Donut Chart from DataFrame - how2matplotlib.com')
plt.tight_layout()
plt.show()
Output:
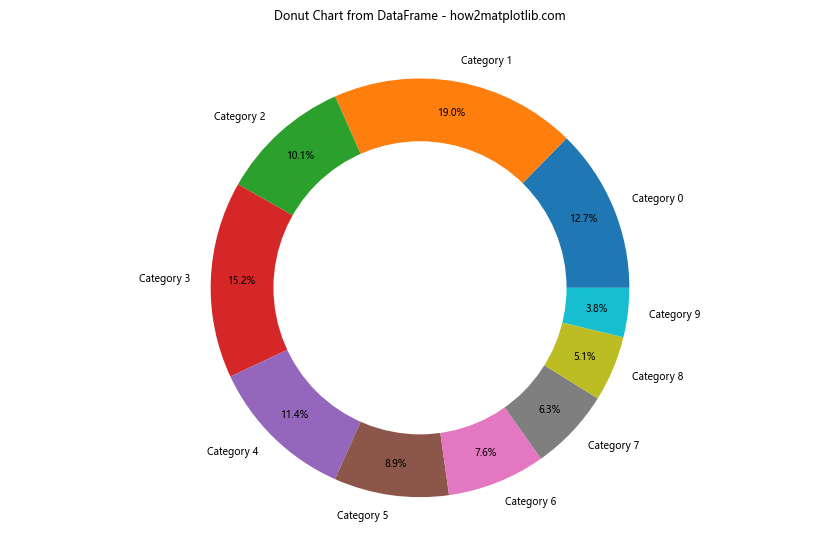
This example creates a donut chart, which can be more effective for visualizing datasets with many categories.
Advanced Techniques for Matplotlib Pie Charts from DataFrame
Let’s explore some advanced techniques for creating matplotlib pie charts from DataFrame:
Nested Pie Charts
Nested pie charts can be useful for visualizing hierarchical data:
import matplotlib.pyplot as plt
import pandas as pd

# Create a sample DataFrame with hierarchical data
data = {
    'Category': ['A', 'A', 'A', 'B', 'B', 'C'],
    'Subcategory': ['A1', 'A2', 'A3', 'B1', 'B2', 'C1'],
    'Value': [20, 15, 10, 25, 20, 10]
}
df = pd.DataFrame(data)

# Create the outer pie chart
fig, ax = plt.subplots(figsize=(12, 8))
outer_sizes = df.groupby('Category')['Value'].sum()
outer_colors = ['#ff9999', '#66b3ff', '#99ff99']
outer_wedges, outer_texts, outer_autotexts = ax.pie(outer_sizes, labels=outer_sizes.index, colors=outer_colors, autopct='%1.1f%%', pctdistance=0.85)

# Create the inner pie chart
inner_sizes = df['Value']
inner_colors = ['#ff9999', '#ffcc99', '#ffddcc', '#66b3ff', '#99ccff', '#99ff99']
inner_wedges, inner_texts, inner_autotexts = ax.pie(inner_sizes, labels=df['Subcategory'], colors=inner_colors, radius=0.7, autopct='%1.1f%%', pctdistance=0.75)

ax.set_title('Nested Pie Chart from DataFrame - how2matplotlib.com')
plt.tight_layout()
plt.show()
Output:
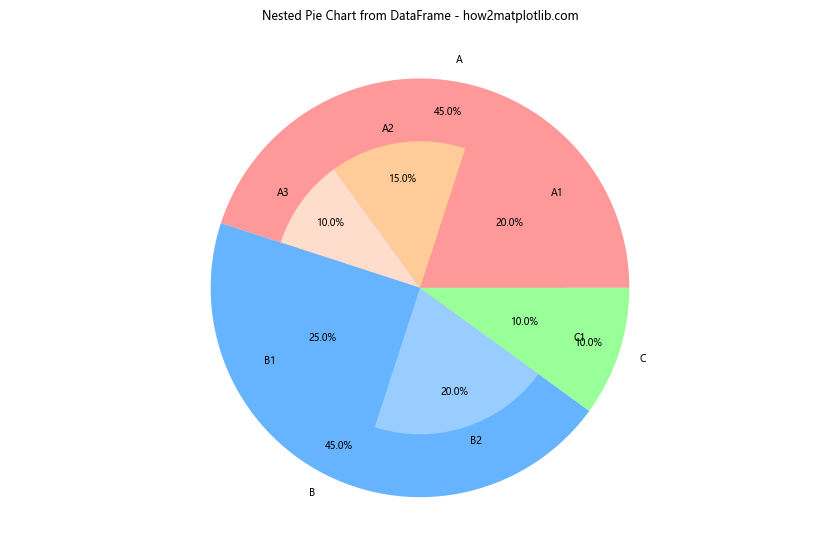
This example creates a nested pie chart, with the outer ring representing main categories and the inner ring showing subcategories.
Polar Bar Chart
For a unique twist on the traditional pie chart, you can create a polar bar chart:
import matplotlib.pyplot as plt
import pandas as pd
import numpy as np

data = {'Category': ['A', 'B', 'C', 'D', 'E', 'F'],
        'Value': [25, 20, 15, 30, 10, 25]}
df = pd.DataFrame(data)

fig = plt.figure(figsize=(10, 8))
ax = fig.add_subplot(111, projection='polar')

theta = np.linspace(0, 2*np.pi, len(df), endpoint=False)
radii = df['Value']
width = 2*np.pi / len(df)

bars = ax.bar(theta, radii, width=width, bottom=0.0)

for r, bar in zip(radii, bars):
    bar.set_facecolor(plt.cm.viridis(r / 10.))
    bar.set_alpha(0.8)

ax.set_xticks(theta)
ax.set_xticklabels(df['Category'])
ax.set_title('Polar Bar Chart from DataFrame - how2matplotlib.com')

plt.tight_layout()
plt.show()
Output:
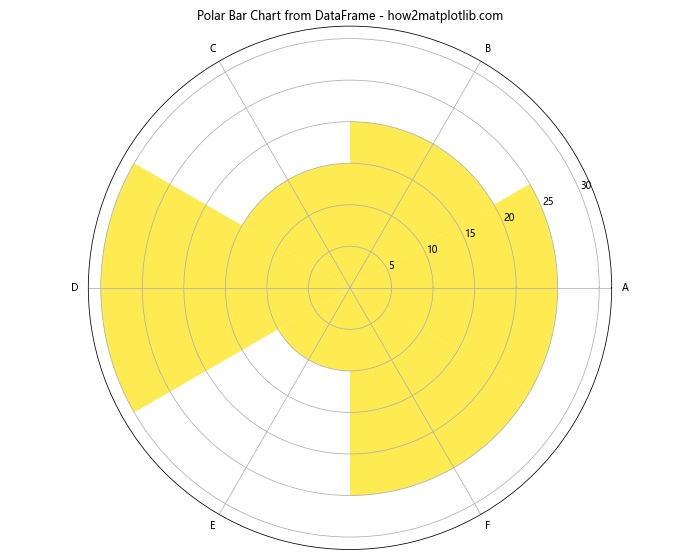
This example creates a polar bar chart, which can be an interesting alternative to traditional pie charts for certain types of data.
Combining Matplotlib Pie Charts with Other Plot Types
Sometimes, combining pie charts with other plot types can provide a more comprehensive view of the data. Let’s explore a few examples:
Pie Chart with a Bar Chart
import matplotlib.pyplot as plt
import pandas as pd

data = {'Category': ['A', 'B', 'C', 'D', 'E'],
        'Value1': [25, 20, 15, 30, 10],
        'Value2': [15, 25, 20, 10, 30]}
df = pd.DataFrame(data)

fig, (ax1, ax2) = plt.subplots(1, 2, figsize=(16, 8))

# Pie chart
ax1.pie(df['Value1'], labels=df['Category'], autopct='%1.1f%%')
ax1.set_title('Pie Chart - how2matplotlib.com')

# Bar chart
ax2.bar(df['Category'], df['Value2'])
ax2.set_title('Bar Chart - how2matplotlib.com')
ax2.set_ylabel('Value')

plt.tight_layout()
plt.show()
Output:
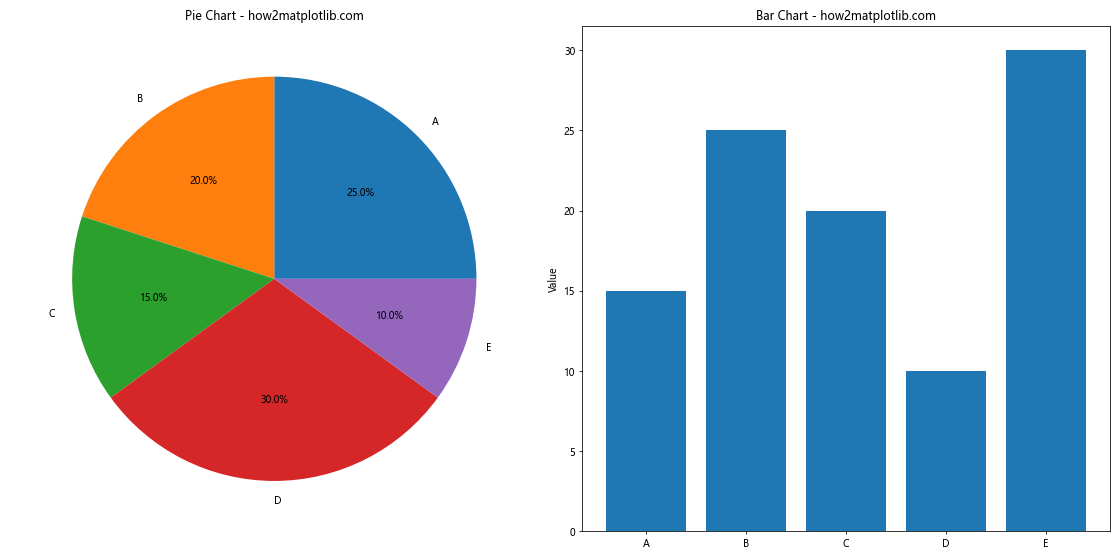
This example combines a pie chart and a bar chart side by side, allowing for easy comparison between two different sets of values.
Pie Chart with a Line Plot
import matplotlib.pyplot as plt
import pandas as pd
import numpy as np

# Create sample data
dates = pd.date_range(start='2023-01-01', end='2023-12-31', freq='D')
categories = ['A', 'B', 'C', 'D']
data = {'Date': dates}
for cat in categories:
    data[cat] = np.random.randint(10, 100, size=len(dates))

df = pd.DataFrame(data)

# Create subplots
fig, (ax1, ax2) = plt.subplots(2, 1, figsize=(12, 16))

# Pie chart (using the last day's data)
last_day = df.iloc[-1][categories]
ax1.pie(last_day, labels=categories, autopct='%1.1f%%')
ax1.set_title('Last Day Distribution - how2matplotlib.com')

# Line plot
for cat in categories:
    ax2.plot(df['Date'], df[cat], label=cat)

ax2.set_title('Time Series Data - how2matplotlib.com')
ax2.set_xlabel('Date')
ax2.set_ylabel('Value')
ax2.legend()

plt.tight_layout()
plt.show()
Output:
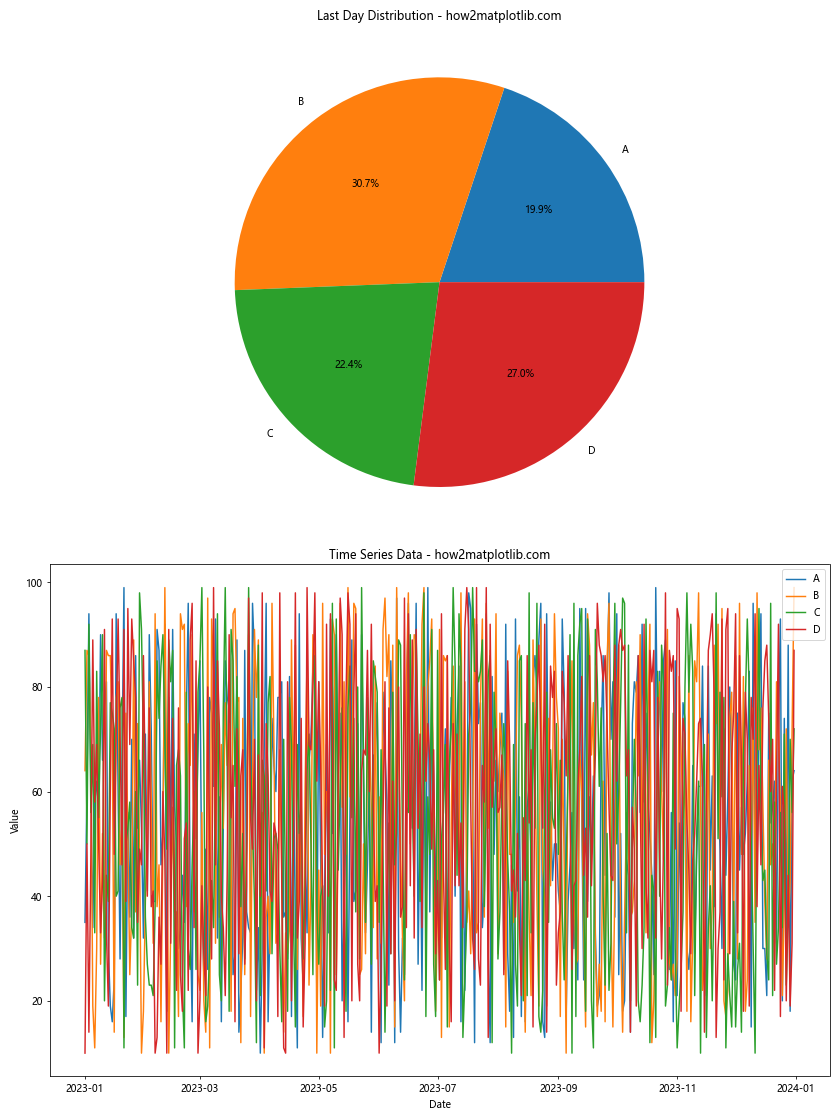
This example combines a pie chart showing the distribution of the last day’s data with a line plot showing the trends over time.
Animating Matplotlib Pie Charts from DataFrame
Creating animated pie charts can be an effective way to show changes in data over time. Here’s an example of how to create an animated pie chart using matplotlib and DataFrames:
import matplotlib.pyplot as plt
import pandas as pd
import numpy as np
from matplotlib.animation import FuncAnimation

# Create sample data
dates = pd.date_range(start='2023-01-01', end='2023-12-31', freq='D')
categories = ['A', 'B', 'C', 'D']
data = {'Date': dates}
for cat in categories:
    data[cat] = np.random.randint(10, 100, size=len(dates))

df = pd.DataFrame(data)

# Set up the figure and axis
fig, ax = plt.subplots(figsize=(10, 8))

def update(frame):
    ax.clear()
    day_data = df.iloc[frame][categories]
    ax.pie(day_data, labels=categories, autopct='%1.1f%%')
    ax.set_title(f'Distribution on {df.iloc[frame]["Date"].strftime("%Y-%m-%d")} - how2matplotlib.com')

ani = FuncAnimation(fig, update, frames=len(df), interval=100, repeat=False)

plt.tight_layout()
plt.show()
Output:
This example creates an animated pie chart that shows how the distribution changes day by day throughout the year.
Troubleshooting Common Issues with Matplotlib Pie Charts from DataFrame
When working with matplotlib pie charts from DataFrame, you may encounter some common issues. Here are some problems and their solutions:
1. Pie chart not showing all slices
If your pie chart is not showing all slices, it might be due to very small values. You can solve this by setting a minimum threshold:
import matplotlib.pyplot as plt
import pandas as pd

data = {'Category': ['A', 'B', 'C', 'D', 'E', 'F', 'G'],
        'Value': [30, 25, 20, 15, 5, 3, 2]}
df = pd.DataFrame(data)

# Set a minimum threshold
threshold = 5
small = df[df['Value'] < threshold]
large = df[df['Value'] >= threshold]

# Combine small slices into 'Others'
if not small.empty:
    others = pd.DataFrame({'Category': ['Others'], 'Value': [small['Value'].sum()]})
    df_plot = pd.concat([large, others])
else:
    df_plot = large

plt.figure(figsize=(10, 8))
plt.pie(df_plot['Value'], labels=df_plot['Category'], autopct='%1.1f%%')
plt.title('Pie Chart with Minimum Threshold - how2matplotlib.com')
plt.axis('equal')
plt.show()
Output:
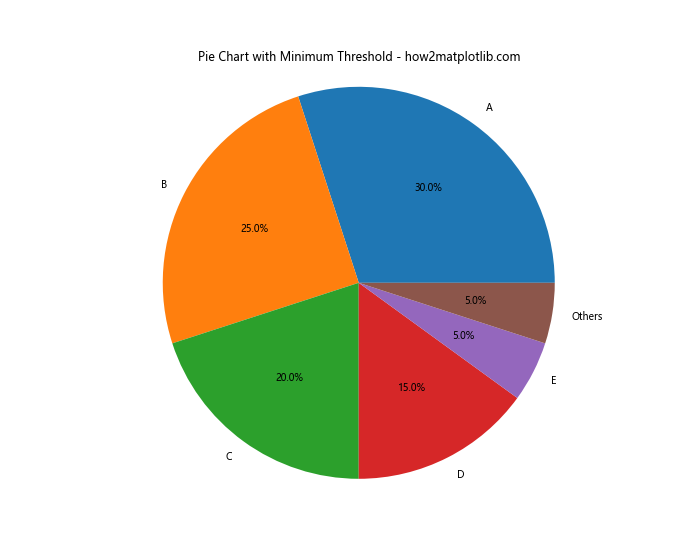
This example groups all slices smaller than the threshold into an “Others” category.
2. Labels overlapping
If you have many categories and the labels are overlapping, you can use a legend instead:
import matplotlib.pyplot as plt
import pandas as pd

data = {'Category': [f'Category {i}' for i in range(15)],
        'Value': [5, 5, 5, 5, 5, 5, 5, 5, 5, 5, 10, 10, 10, 10, 10]}
df = pd.DataFrame(data)

plt.figure(figsize=(12, 8))
patches, texts, autotexts = plt.pie(df['Value'], autopct='%1.1f%%')
plt.title('Pie Chart with Many Categories - how2matplotlib.com')
plt.legend(patches, df['Category'], title="Categories", loc="center left", bbox_to_anchor=(1, 0, 0.5, 1))
plt.axis('equal')
plt.tight_layout()
plt.show()
Output:
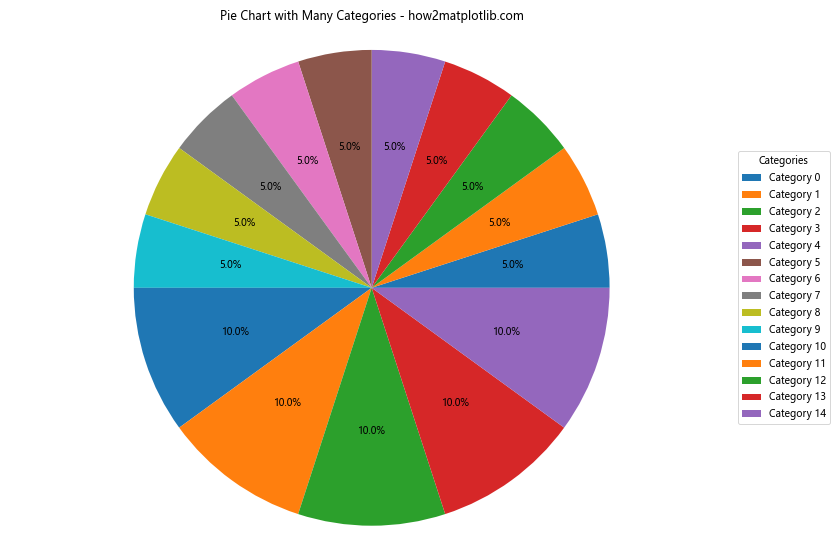
This example uses a legend instead of direct labels to avoid overlapping.
3. Inconsistent colors across charts
If you’re creating multiple charts and want consistent colors, you can define a color map:
import matplotlib.pyplot as plt
import pandas as pd

data1 = {'Category': ['A', 'B', 'C', 'D'],
         'Value': [30, 25, 20, 25]}
data2 = {'Category': ['A', 'B', 'C', 'D'],
         'Value': [20, 30, 25, 25]}

df1 = pd.DataFrame(data1)
df2 = pd.DataFrame(data2)

# Define a color map
color_map = {'A': '#ff9999', 'B': '#66b3ff', 'C': '#99ff99', 'D': '#ffcc99'}

fig, (ax1, ax2) = plt.subplots(1, 2, figsize=(16, 8))

ax1.pie(df1['Value'], labels=df1['Category'], colors=[color_map[cat] for cat in df1['Category']], autopct='%1.1f%%')
ax1.set_title('Chart 1 - how2matplotlib.com')

ax2.pie(df2['Value'], labels=df2['Category'], colors=[color_map[cat] for cat in df2['Category']], autopct='%1.1f%%')
ax2.set_title('Chart 2 - how2matplotlib.com')

plt.tight_layout()
plt.show()
Output:
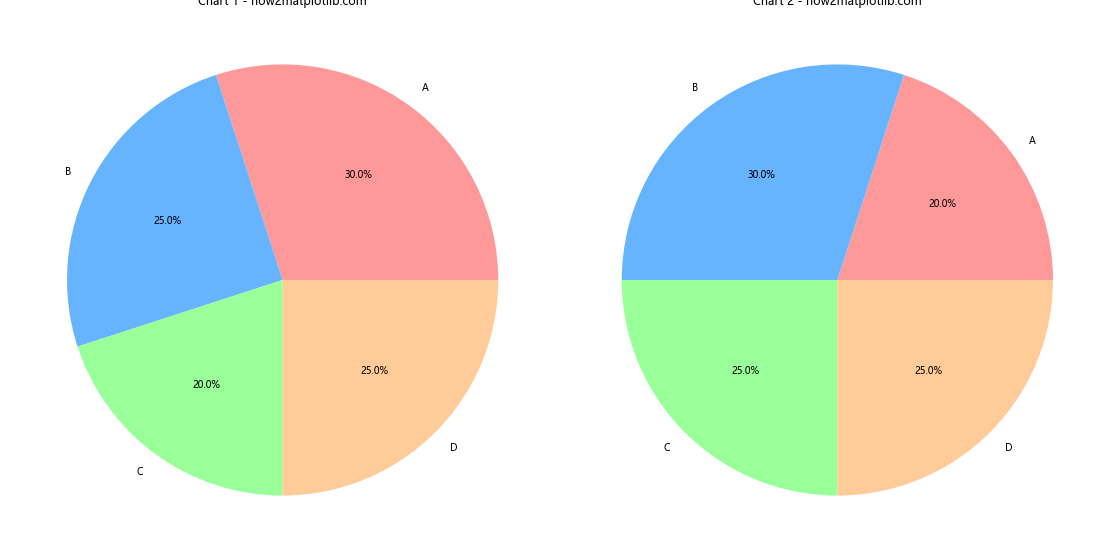
This example uses a consistent color map across multiple charts.
Advanced Customization of Matplotlib Pie Charts from DataFrame
Matplotlib offers numerous options for advanced customization of pie charts. Let’s explore some of these options:
Custom Wedge Properties
You can customize individual wedge properties like edgecolor, linewidth, and shadow:
import matplotlib.pyplot as plt
import pandas as pd

data = {'Category': ['A', 'B', 'C', 'D'],
        'Value': [30, 25, 20, 25]}
df = pd.DataFrame(data)

colors = ['#ff9999', '#66b3ff', '#99ff99', '#ffcc99']
explode = (0.1, 0, 0, 0)

plt.figure(figsize=(10, 8))
wedges, texts, autotexts = plt.pie(df['Value'], labels=df['Category'], colors=colors, explode=explode,
                                   autopct='%1.1f%%', shadow=True, startangle=90,
                                   wedgeprops={'edgecolor': 'black', 'linewidth': 2})

plt.title('Custom Wedge Properties - how2matplotlib.com')
plt.axis('equal')
plt.show()
Output:
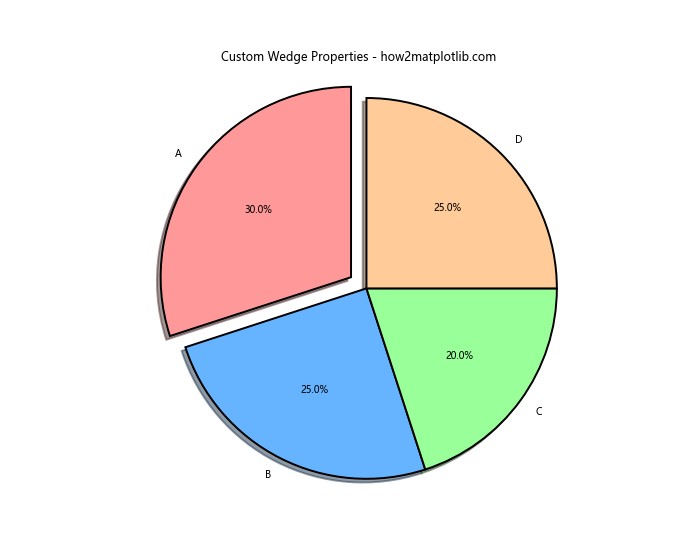
This example demonstrates how to customize wedge properties like edge color, line width, and shadow effect.
Customizing Text Properties
You can also customize the appearance of labels and percentage text:
import matplotlib.pyplot as plt
import pandas as pd

data = {'Category': ['A', 'B', 'C', 'D'],
        'Value': [30, 25, 20, 25]}
df = pd.DataFrame(data)

colors = ['#ff9999', '#66b3ff', '#99ff99', '#ffcc99']

plt.figure(figsize=(10, 8))
wedges, texts, autotexts = plt.pie(df['Value'], labels=df['Category'], colors=colors, autopct='%1.1f%%', startangle=90)

# Customize label text
for text in texts:
    text.set_fontsize(12)
    text.set_fontweight('bold')

# Customize percentage text
for autotext in autotexts:
    autotext.set_fontsize(10)
    autotext.set_color('white')

plt.title('Custom Text Properties - how2matplotlib.com', fontsize=16)
plt.axis('equal')
plt.show()
Output:
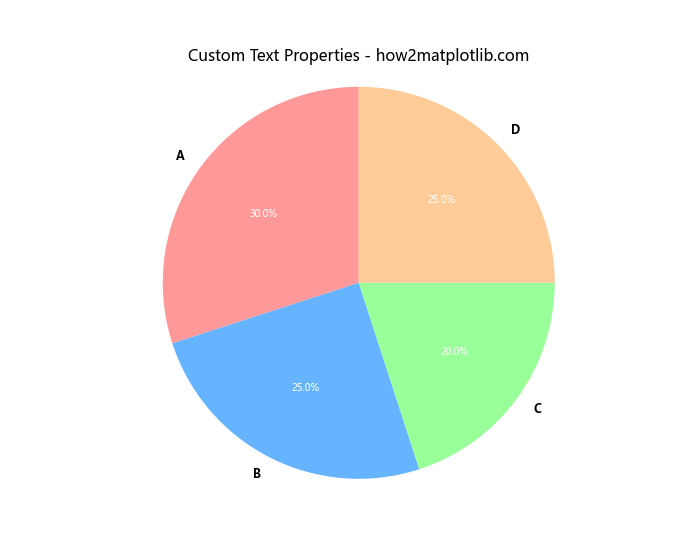
This example shows how to customize the font size, weight, and color of labels and percentage text.
Adding Annotations
You can add annotations to provide additional information about specific slices:
import matplotlib.pyplot as plt
import pandas as pd

data = {'Category': ['A', 'B', 'C', 'D'],
        'Value': [30, 25, 20, 25]}
df = pd.DataFrame(data)

colors = ['#ff9999', '#66b3ff', '#99ff99', '#ffcc99']

plt.figure(figsize=(12, 8))
wedges, texts, autotexts = plt.pie(df['Value'], labels=df['Category'], colors=colors, autopct='%1.1f%%', startangle=90)

# Add annotations
plt.annotate('Highest Value', xy=(0.2, 0.5), xytext=(0.7, 0.7),
             arrowprops=dict(facecolor='black', shrink=0.05))

plt.title('Pie Chart with Annotations - how2matplotlib.com')
plt.axis('equal')
plt.show()
Output:
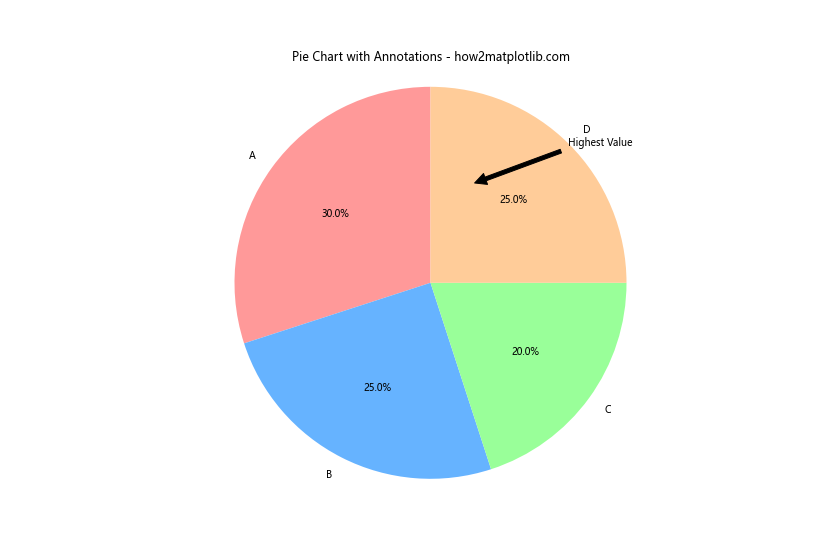
This example demonstrates how to add annotations to highlight specific aspects of the pie chart.
Comparing Matplotlib Pie Charts with Other Visualization Libraries
While matplotlib is a powerful library for creating pie charts from DataFrames, it’s worth comparing it with other popular visualization libraries:
Seaborn
Seaborn is built on top of matplotlib and provides a high-level interface for statistical graphics:
import matplotlib.pyplot as plt
import seaborn as sns
import pandas as pd

data = {'Category': ['A', 'B', 'C', 'D'],
        'Value': [30, 25, 20, 25]}
df = pd.DataFrame(data)

plt.figure(figsize=(10, 8))
sns.set_style("whitegrid")
sns.set_palette("pastel")

plt.pie(df['Value'], labels=df['Category'], autopct='%1.1f%%', startangle=90)
plt.title('Seaborn Pie Chart - how2matplotlib.com')
plt.axis('equal')
plt.show()
Output:
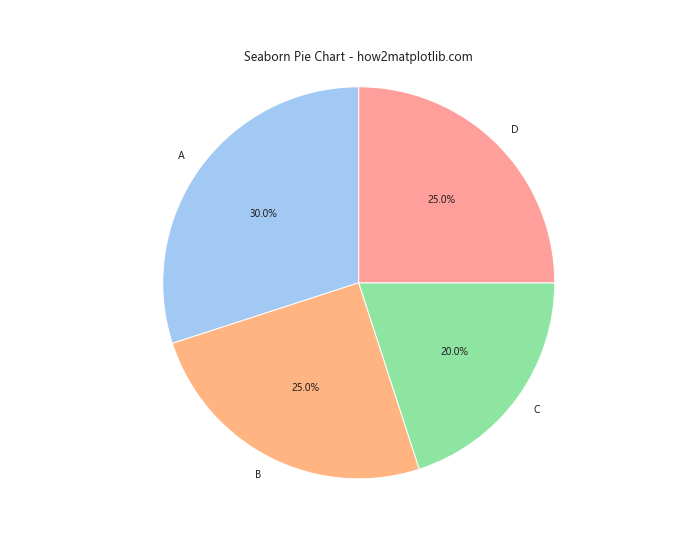
Seaborn provides a more aesthetically pleasing default style and color palette.
Plotly
Plotly is an interactive plotting library that can create web-based visualizations:
import plotly.graph_objects as go
import pandas as pd

data = {'Category': ['A', 'B', 'C', 'D'],
        'Value': [30, 25, 20, 25]}
df = pd.DataFrame(data)

fig = go.Figure(data=[go.Pie(labels=df['Category'], values=df['Value'])])
fig.update_layout(title='Plotly Pie Chart - how2matplotlib.com')
fig.show()
Plotly provides interactive features like hover information and zooming.
While these libraries offer their own advantages, matplotlib remains a popular choice due to its flexibility and extensive customization options.
Matplotlib pie chart from DataFrame Conclusion
Creating matplotlib pie charts from DataFrame is a powerful technique for visualizing proportional data. Throughout this comprehensive guide, we’ve explored various aspects of pie chart creation, from basic plots to advanced customization techniques. We’ve covered topics such as handling large datasets, combining pie charts with other plot types, animating pie charts, and troubleshooting common issues.
Remember to follow best practices when creating pie charts, such as limiting the number of slices, using clear labels, and choosing appropriate colors. With the knowledge gained from this guide, you should now be well-equipped to create informative and visually appealing matplotlib pie charts from your DataFrame data.