How to Use Matplotlib Annotate for Vertical Text: A Comprehensive Guide
Matplotlib annotate vertical text is a powerful feature that allows you to add vertical annotations to your plots. This article will explore various aspects of using matplotlib annotate for vertical text, providing detailed explanations and examples to help you master this technique.
Understanding Matplotlib Annotate Vertical Text
Matplotlib annotate vertical text is a specific application of the annotate function in Matplotlib, which allows you to add text annotations to your plots. When using matplotlib annotate for vertical text, you can create labels, captions, or explanations that are oriented vertically, adding a new dimension to your data visualization.
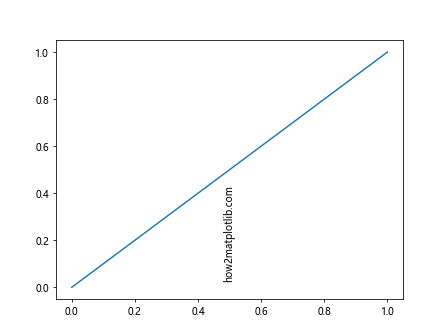
Let’s start with a basic example of how to use matplotlib annotate for vertical text:
import matplotlib.pyplot as plt

fig, ax = plt.subplots()
ax.plot([0, 1], [0, 1])
ax.annotate('how2matplotlib.com', xy=(0.5, 0.5), xytext=(-10, 0),
            textcoords='offset points', rotation=90,
            va='center', ha='right')
plt.show()
Output:
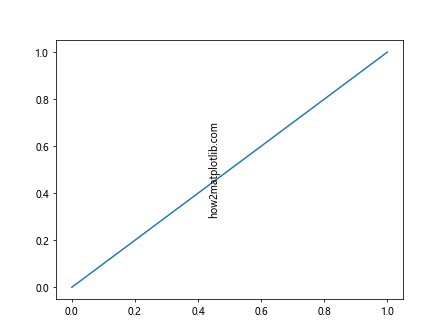
In this example, we create a simple line plot and add a vertical annotation using matplotlib annotate. The text “how2matplotlib.com” is rotated 90 degrees to appear vertically.
Key Parameters for Matplotlib Annotate Vertical Text
When using matplotlib annotate for vertical text, several parameters are crucial:
xy: The point to annotatexytext: The position of the textrotation: The angle of rotation for the textvaandha: Vertical and horizontal alignment
Let’s explore these parameters in more detail with another example:
import matplotlib.pyplot as plt

fig, ax = plt.subplots()
ax.plot([0, 1, 2, 3, 4], [0, 2, 1, 3, 2])
ax.annotate('how2matplotlib.com Vertical', xy=(2, 1), xytext=(3, 2),
            arrowprops=dict(arrowstyle='->'),
            rotation=90, va='bottom', ha='center')
plt.show()
Output:
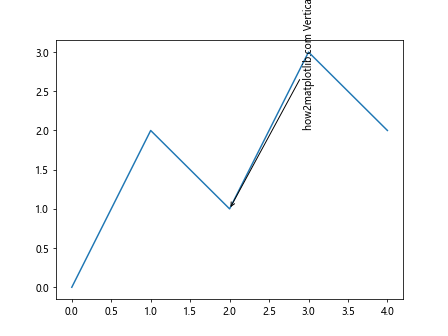
In this example, we use matplotlib annotate to create a vertical text annotation with an arrow pointing to a specific point on the plot. The rotation=90 parameter makes the text vertical.
Advanced Techniques for Matplotlib Annotate Vertical Text
Matplotlib annotate vertical text can be further customized to create more complex and informative annotations. Let’s explore some advanced techniques:
Using Custom Fonts
You can use custom fonts with matplotlib annotate vertical text to enhance the visual appeal of your annotations:
import matplotlib.pyplot as plt
from matplotlib import font_manager

fig, ax = plt.subplots()
ax.plot([0, 1], [0, 1])

custom_font = font_manager.FontProperties(family='serif', style='italic')
ax.annotate('how2matplotlib.com', xy=(0.5, 0.5), xytext=(0, 20),
            textcoords='offset points', rotation=90,
            va='bottom', ha='center', fontproperties=custom_font)
plt.show()
Output:
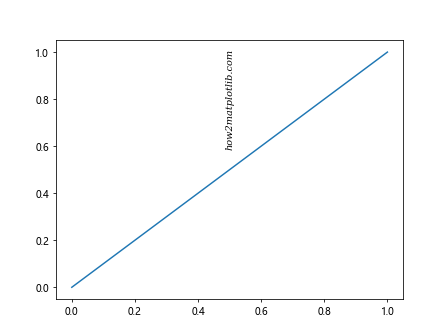
This example demonstrates how to use a custom serif font in italic style for your vertical text annotation.
Adding Background and Border
You can add a background and border to your matplotlib annotate vertical text to make it stand out:
import matplotlib.pyplot as plt

fig, ax = plt.subplots()
ax.plot([0, 1, 2, 3, 4], [0, 2, 1, 3, 2])
ax.annotate('how2matplotlib.com', xy=(2, 1), xytext=(2.5, 2),
            rotation=90, va='center', ha='center',
            bbox=dict(boxstyle='round,pad=0.5', fc='yellow', ec='k', lw=1),
            arrowprops=dict(arrowstyle='->'))
plt.show()
Output:
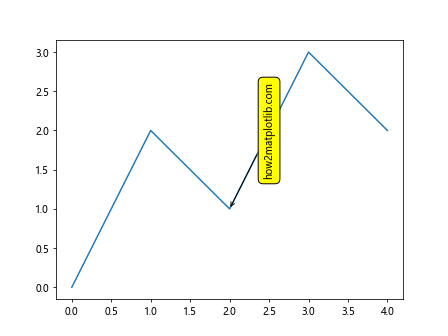
In this example, we add a yellow background with a black border to our vertical text annotation, making it more prominent in the plot.
Using Multiple Vertical Text Annotations
You can use multiple matplotlib annotate vertical text annotations to label different parts of your plot:
import matplotlib.pyplot as plt

fig, ax = plt.subplots()
ax.plot([0, 1, 2, 3, 4], [0, 2, 1, 3, 2])

ax.annotate('Peak 1', xy=(1, 2), xytext=(1.2, 2.5),
            rotation=90, va='bottom', ha='left')
ax.annotate('Valley', xy=(2, 1), xytext=(2.2, 1.5),
            rotation=90, va='bottom', ha='left')
ax.annotate('Peak 2', xy=(3, 3), xytext=(3.2, 3.5),
            rotation=90, va='bottom', ha='left')

ax.set_title('how2matplotlib.com Example')
plt.show()
Output:
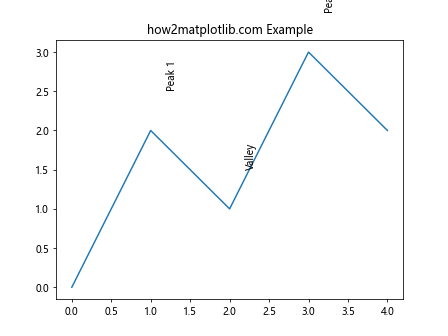
This example shows how to use multiple vertical text annotations to label different features of a line plot.
Matplotlib Annotate Vertical Text in Different Plot Types
Matplotlib annotate vertical text can be used in various types of plots. Let’s explore some examples:
Bar Plot with Vertical Text Annotations
import matplotlib.pyplot as plt
import numpy as np

categories = ['A', 'B', 'C', 'D']
values = [3, 7, 2, 5]

fig, ax = plt.subplots()
bars = ax.bar(categories, values)

for i, bar in enumerate(bars):
    height = bar.get_height()
    ax.annotate(f'Value: {height}', xy=(bar.get_x() + bar.get_width() / 2, height),
                xytext=(0, 3), textcoords='offset points',
                rotation=90, va='bottom', ha='center')

ax.set_title('how2matplotlib.com Bar Plot')
plt.show()
Output:
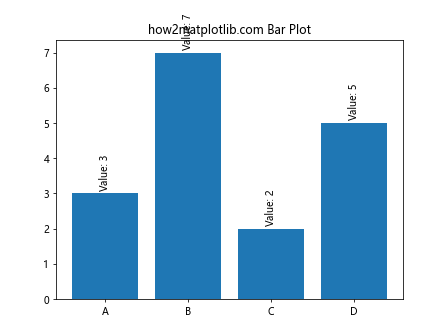
This example demonstrates how to add vertical text annotations to a bar plot, showing the value of each bar.
Scatter Plot with Vertical Text Labels
import matplotlib.pyplot as plt
import numpy as np

x = np.random.rand(20)
y = np.random.rand(20)
labels = [f'Point {i+1}' for i in range(20)]

fig, ax = plt.subplots()
ax.scatter(x, y)

for i, (xi, yi, label) in enumerate(zip(x, y, labels)):
    ax.annotate(label, xy=(xi, yi), xytext=(5, 0),
                textcoords='offset points',
                rotation=90, va='bottom', ha='left')

ax.set_title('how2matplotlib.com Scatter Plot')
plt.show()
Output:
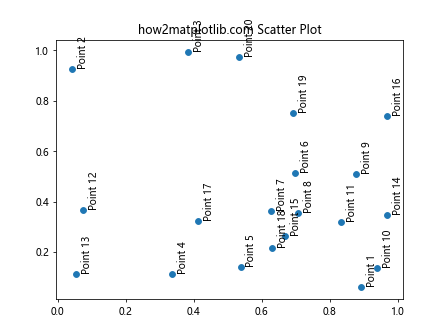
This example shows how to add vertical text labels to points in a scatter plot.
Customizing Matplotlib Annotate Vertical Text
Matplotlib annotate vertical text offers various customization options. Let’s explore some of them:
Changing Text Color and Size
import matplotlib.pyplot as plt

fig, ax = plt.subplots()
ax.plot([0, 1], [0, 1])
ax.annotate('how2matplotlib.com', xy=(0.5, 0.5), xytext=(0, 20),
            textcoords='offset points', rotation=90,
            va='bottom', ha='center',
            color='red', fontsize=16, fontweight='bold')
plt.show()
Output:
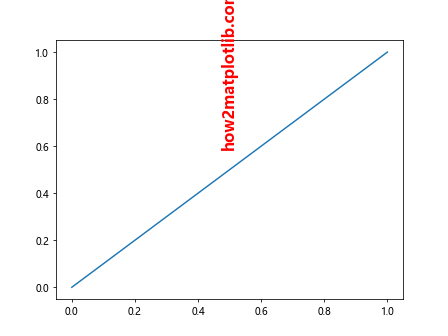
This example demonstrates how to change the color, size, and weight of the vertical text annotation.
Adding a Shadow Effect
import matplotlib.pyplot as plt
from matplotlib.patheffects import withStroke

fig, ax = plt.subplots()
ax.plot([0, 1], [0, 1])
text = ax.annotate('how2matplotlib.com', xy=(0.5, 0.5), xytext=(0, 20),
                   textcoords='offset points', rotation=90,
                   va='bottom', ha='center', fontsize=16)
text.set_path_effects([withStroke(linewidth=3, foreground='gray')])
plt.show()
Output:
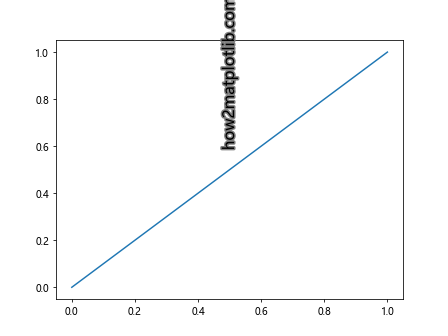
This example shows how to add a shadow effect to your vertical text annotation, making it stand out more.
Using LaTeX in Vertical Text Annotations
import matplotlib.pyplot as plt

fig, ax = plt.subplots()
ax.plot([0, 1], [0, 1])
ax.annotate(r'$\int_0^1 x^2 dx$', xy=(0.5, 0.5), xytext=(0, 20),
            textcoords='offset points', rotation=90,
            va='bottom', ha='center', fontsize=16)
ax.set_title('how2matplotlib.com LaTeX Example')
plt.show()
Output:
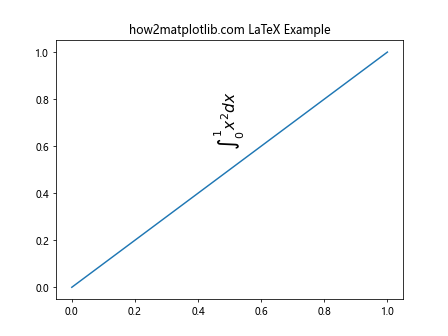
This example demonstrates how to use LaTeX formatting in your vertical text annotations, which is useful for adding mathematical expressions.
Matplotlib Annotate Vertical Text in Subplots
Matplotlib annotate vertical text can also be used effectively in subplots:
import matplotlib.pyplot as plt
import numpy as np

fig, (ax1, ax2) = plt.subplots(1, 2, figsize=(10, 5))

x = np.linspace(0, 2*np.pi, 100)
ax1.plot(x, np.sin(x))
ax1.annotate('Sin Wave', xy=(np.pi, 1), xytext=(np.pi+0.5, 0.5),
             rotation=90, va='bottom', ha='left',
             arrowprops=dict(arrowstyle='->'))

ax2.plot(x, np.cos(x))
ax2.annotate('Cos Wave', xy=(np.pi, -1), xytext=(np.pi+0.5, -0.5),
             rotation=90, va='top', ha='left',
             arrowprops=dict(arrowstyle='->'))

fig.suptitle('how2matplotlib.com Subplot Example')
plt.show()
Output:
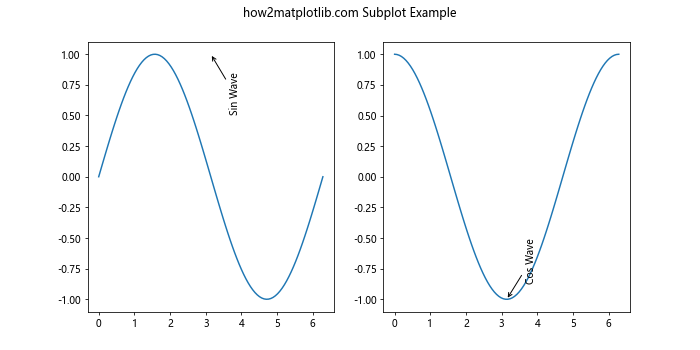
This example shows how to use matplotlib annotate vertical text in a figure with multiple subplots.
Animating Matplotlib Annotate Vertical Text
You can create animations with matplotlib annotate vertical text to make your visualizations more dynamic:
import matplotlib.pyplot as plt
import matplotlib.animation as animation
import numpy as np

fig, ax = plt.subplots()
x = np.linspace(0, 2*np.pi, 100)
line, = ax.plot(x, np.sin(x))
annotation = ax.annotate('', xy=(0, 0), xytext=(0.1, 1),
                         rotation=90, va='bottom', ha='left')

def animate(i):
    line.set_ydata(np.sin(x + i/10))
    annotation.set_text(f'Phase: {i/10:.2f}')
    annotation.xy = (i/10 % (2*np.pi), np.sin(i/10))
    return line, annotation

ani = animation.FuncAnimation(fig, animate, frames=100, blit=True)
plt.title('how2matplotlib.com Animation')
plt.show()
Output:
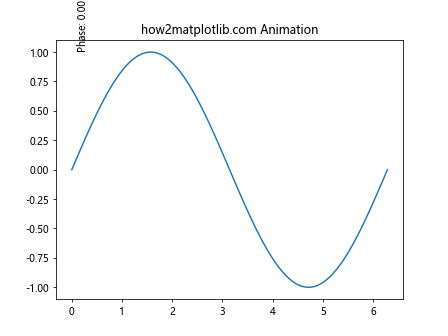
This example creates an animation of a sine wave with a vertical text annotation that updates to show the current phase.
Best Practices for Matplotlib Annotate Vertical Text
When using matplotlib annotate vertical text, consider the following best practices:
- Keep text concise: Vertical text can be harder to read, so keep your annotations brief and to the point.
- Choose appropriate font size: Make sure your vertical text is large enough to be easily readable.
- Use contrasting colors: Ensure your vertical text stands out against the background of your plot.
- Position carefully: Place your vertical text annotations where they don’t obscure important data points.
- Use arrows wisely: When using arrows with your annotations, make sure they point clearly to the relevant part of the plot.
Here’s an example implementing these best practices:
import matplotlib.pyplot as plt
import numpy as np

fig, ax = plt.subplots(figsize=(10, 6))
x = np.linspace(0, 10, 100)
y = np.sin(x) * np.exp(-x/10)

ax.plot(x, y, 'b-')
ax.set_facecolor('#f0f0f0')

ax.annotate('Peak', xy=(1.6, 0.9), xytext=(2, 1.2),
            rotation=90, va='bottom', ha='center',
            color='red', fontsize=12, fontweight='bold',
            arrowprops=dict(arrowstyle='->', color='red'))

ax.annotate('Decay', xy=(5, 0.2), xytext=(5.5, 0.5),
            rotation=90, va='bottom', ha='center',
            color='green', fontsize=12, fontweight='bold',
            bbox=dict(boxstyle='round,pad=0.5', fc='white', ec='green', alpha=0.8))

ax.set_title('how2matplotlib.com Best Practices Example')
plt.show()
Output:
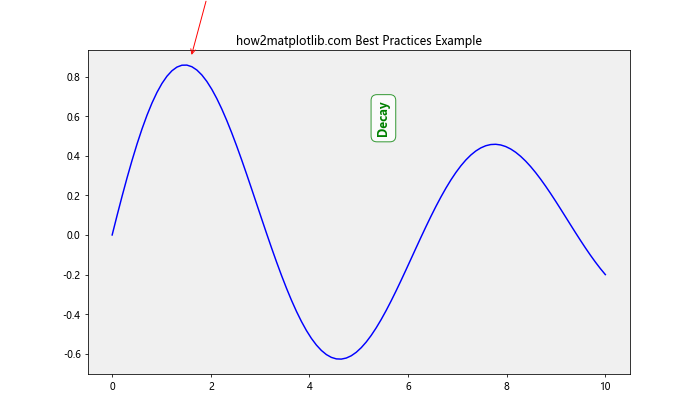
This example demonstrates the use of contrasting colors, appropriate font sizes, and careful positioning of vertical text annotations.
Troubleshooting Matplotlib Annotate Vertical Text
When working with matplotlib annotate vertical text, you might encounter some common issues. Here are some problems and their solutions:
Text Overlapping
If your vertical text annotations are overlapping, you can adjust their positions or use the bbox parameter to add some padding:
import matplotlib.pyplot as plt

fig, ax = plt.subplots()
ax.plot([0, 1, 2, 3], [0, 1, 0, 1])

ax.annotate('Label 1', xy=(0.5, 0.5), xytext=(0.5, 0.7),
            rotation=90, va='bottom', ha='center',
            bbox=dict(boxstyle='round,pad=0.5', fc='white', ec='none'))
ax.annotate('Label 2', xy=(1.5, 0.5), xytext=(1.5, 0.7),
            rotation=90, va='bottom', ha='center',
            bbox=dict(boxstyle='round,pad=0.5', fc='white', ec='none'))

plt.title('how2matplotlib.com Overlap Solution')
plt.show()
Output:
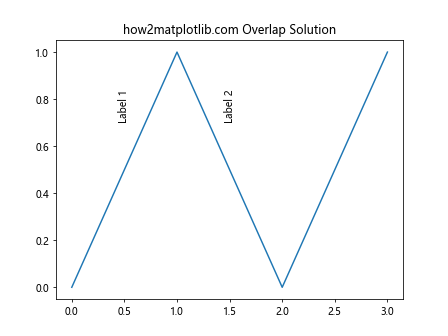
This example shows how to use bounding boxes to prevent overlapping of vertical text annotations.
Text Cutting Off
If your vertical text is being cut off at the edges of the plot, you can adjust the plot margins:
import matplotlib.pyplot as plt

fig, ax = plt.subplots()
ax.plot([0, 1], [0, 1])

ax.annotate('Long Vertical Text', xy=(0.5, 0.5), xytext=(1.1, 0.5),
            rotation=90, va='center', ha='left')

plt.subplots_adjust(right=0.8)  # Adjust right margin
plt.title('how2matplotlib.com Margin Adjustment')
plt.show()
Output:
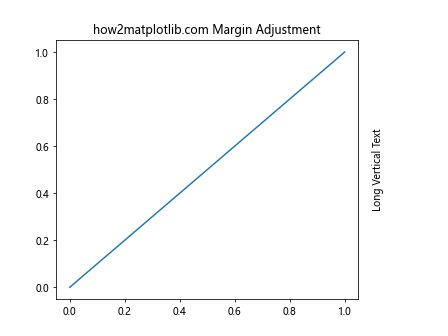
This example demonstrates how to adjust the plot margins to accommodate long vertical text annotations.
Advanced Applications of Matplotlib Annotate Vertical Text
Matplotlib annotate vertical text can be used in more advanced applications. Let’s explore a few:
Creating a Heatmap with Vertical Text Labels
import matplotlib.pyplot as plt
import numpy as np

data = np.random.rand(10, 10)
fig, ax = plt.subplots(figsize=(10, 8))

im = ax.imshow(data, cmap='YlOrRd')

# Add vertical text labels for columns
for i in range(10):
    ax.text(i, -0.5, f'Col {i+1}', rotation=90, va='top', ha='center')

# Add horizontal text labels for rows
for i in range(10):
    ax.text(-0.5, i, f'Row {i+1}', va='center', ha='right')

ax.set_title('how2matplotlib.com Heatmap with Vertical Labels')
plt.colorbar(im)
plt.tight_layout()
plt.show()
Output:
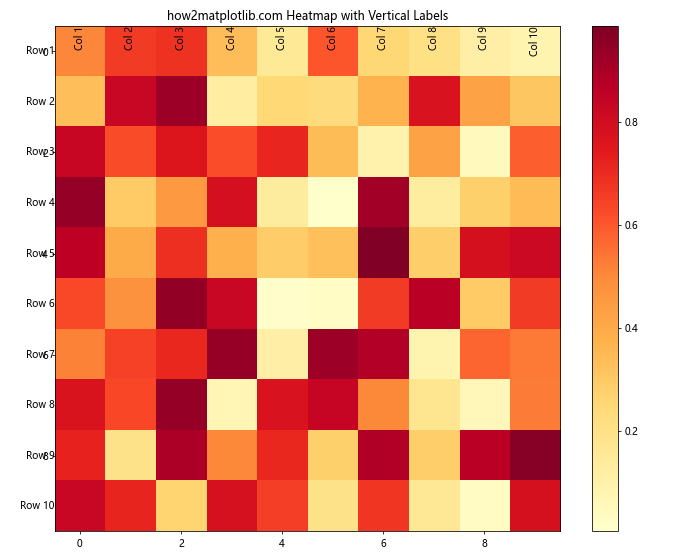
This example shows how to create a heatmap with vertical text labels for columns and horizontal text labels for rows.
Combining Matplotlib Annotate Vertical Text with Other Features
Matplotlib annotate vertical text can be combined with other Matplotlib features to create more complex and informative visualizations. Let’s explore some examples:
Vertical Text with Error Bars
import matplotlib.pyplot as plt
import numpy as np

x = np.arange(5)
y = np.random.rand(5)
error = np.random.rand(5) * 0.1

fig, ax = plt.subplots()
ax.errorbar(x, y, yerr=error, fmt='o')

for i, (xi, yi, e) in enumerate(zip(x, y, error)):
    ax.annotate(f'Value: {yi:.2f}\nError: ±{e:.2f}', xy=(xi, yi), xytext=(5, 0),
                textcoords='offset points', rotation=90,
                va='center', ha='left')

ax.set_title('how2matplotlib.com Error Bars with Vertical Text')
plt.show()
Output:
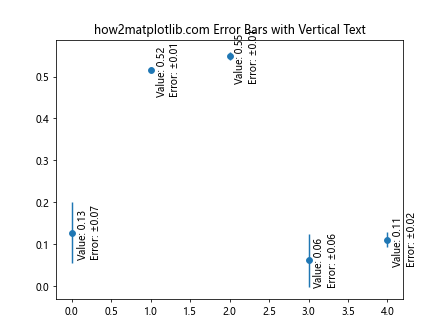
This example demonstrates how to combine error bars with vertical text annotations to provide detailed information about each data point.
Vertical Text in a Stacked Bar Chart
import matplotlib.pyplot as plt
import numpy as np

categories = ['A', 'B', 'C', 'D']
values1 = [1, 2, 3, 4]
values2 = [2, 3, 4, 5]

fig, ax = plt.subplots()
ax.bar(categories, values1, label='Group 1')
ax.bar(categories, values2, bottom=values1, label='Group 2')

for i, (v1, v2) in enumerate(zip(values1, values2)):
    ax.annotate(f'Total: {v1+v2}', xy=(i, v1+v2), xytext=(0, 5),
                textcoords='offset points', rotation=90,
                va='bottom', ha='center')

ax.set_title('how2matplotlib.com Stacked Bar Chart with Vertical Text')
ax.legend()
plt.show()
Output:
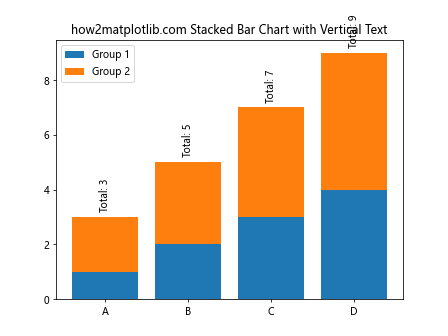
This example shows how to add vertical text annotations to a stacked bar chart, displaying the total value for each category.
Matplotlib Annotate Vertical Text in 3D Plots
Matplotlib annotate vertical text can also be used in 3D plots, although it requires a slightly different approach:
import matplotlib.pyplot as plt
from mpl_toolkits.mplot3d import Axes3D
import numpy as np

fig = plt.figure()
ax = fig.add_subplot(111, projection='3d')

x = np.linspace(-5, 5, 100)
y = np.linspace(-5, 5, 100)
X, Y = np.meshgrid(x, y)
Z = np.sin(np.sqrt(X**2 + Y**2))

surf = ax.plot_surface(X, Y, Z, cmap='viridis')

ax.text(0, 5, 0, 'how2matplotlib.com', 'y', rotation=90)
ax.text(5, 0, 0, 'X-axis', 'x')
ax.text(0, 0, 5, 'Z-axis', 'z')

ax.set_title('3D Plot with Vertical Text')
plt.show()
Output:
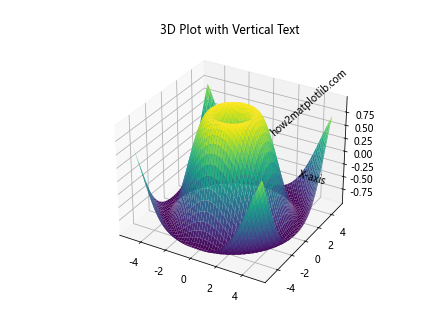
This example demonstrates how to add vertical text annotations to a 3D surface plot.
Performance Considerations for Matplotlib Annotate Vertical Text
When working with matplotlib annotate vertical text, especially in plots with many annotations, performance can become a concern. Here are some tips to improve performance:
- Use
blended_transform_factoryfor annotations that are fixed in one dimension:
import matplotlib.pyplot as plt
from matplotlib.transforms import blended_transform_factory

fig, ax = plt.subplots()
ax.plot([0, 1], [0, 1])

transform = blended_transform_factory(ax.transData, ax.transAxes)
ax.annotate('how2matplotlib.com', xy=(0.5, 0), xytext=(0, 5),
            textcoords='offset points', rotation=90,
            va='bottom', ha='center', transform=transform)

plt.show()
Output:
This example uses blended_transform_factory to create an annotation that is fixed to the x-axis but moves with the y-axis.
- Use
ax.textinstead ofax.annotatefor simple text annotations without arrows:
import matplotlib.pyplot as plt
import numpy as np

fig, ax = plt.subplots()
x = np.linspace(0, 10, 100)
y = np.sin(x)
ax.plot(x, y)

for i in range(0, 11, 2):
    ax.text(i, -1.1, f'x={i}', rotation=90, va='top', ha='center')

ax.set_title('how2matplotlib.com Text Method')
plt.show()
Output:
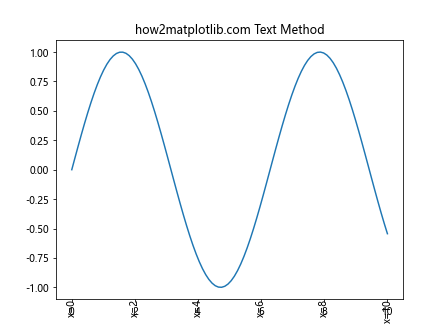
This example uses ax.text to add vertical labels to the x-axis, which can be more efficient than using ax.annotate for simple text placements.
Matplotlib annotate vertical text Conclusion
Matplotlib annotate vertical text is a powerful tool for adding informative labels and annotations to your plots. From basic usage to advanced applications, this feature offers a wide range of possibilities for enhancing your data visualizations. By mastering the various parameters and techniques discussed in this article, you can create more engaging and informative plots that effectively communicate your data insights.
Remember to consider the readability and placement of your vertical text annotations, and don’t hesitate to experiment with different styles and combinations to find what works best for your specific visualization needs. With practice and creativity, you can use matplotlib annotate vertical text to take your data visualizations to the next level.
Whether you’re creating simple line plots, complex 3D visualizations, or animated graphs, matplotlib annotate vertical text can help you add that extra layer of information and polish to your plots. Keep exploring and experimenting with this feature to discover new ways to enhance your data storytelling capabilities.