How to Use Matplotlib Annotate with Bold Text: A Comprehensive Guide
Matplotlib annotate bold is a powerful feature in the Matplotlib library that allows you to add annotations with bold text to your plots. This article will provide a detailed exploration of how to use matplotlib annotate bold effectively in your data visualization projects. We’ll cover various aspects of matplotlib annotate bold, including its syntax, customization options, and practical applications.
Understanding Matplotlib Annotate Bold
Matplotlib annotate bold is a combination of two key concepts in Matplotlib: the annotate() function and text styling. The annotate() function is used to add annotations to plots, while text styling allows you to modify the appearance of the text, including making it bold. By combining these two features, you can create visually striking and informative annotations on your plots.
Let’s start with a basic example of using matplotlib annotate bold:
import matplotlib.pyplot as plt

fig, ax = plt.subplots()
ax.plot([1, 2, 3, 4], [1, 4, 2, 3])
ax.annotate('How2Matplotlib.com', xy=(2, 4), xytext=(3, 4.5),
            arrowprops=dict(facecolor='black', shrink=0.05),
            fontweight='bold')
plt.show()
Output:
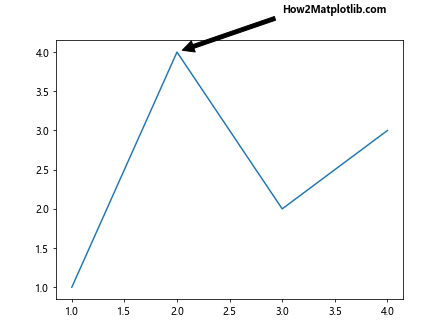
In this example, we create a simple line plot and add a bold annotation using matplotlib annotate bold. The fontweight='bold' parameter is used to make the text bold.
Syntax of Matplotlib Annotate Bold
The basic syntax for using matplotlib annotate bold is as follows:
ax.annotate(text, xy=(x, y), xytext=(x, y), fontweight='bold', **kwargs)
Here’s a breakdown of the key parameters:
text: The content of the annotationxy: The point to annotatexytext: The position of the textfontweight='bold': Makes the text bold**kwargs: Additional parameters for customization
Let’s see another example of matplotlib annotate bold using this syntax:
import matplotlib.pyplot as plt

fig, ax = plt.subplots()
ax.scatter([1, 2, 3, 4], [1, 4, 2, 3])
ax.annotate('How2Matplotlib.com Peak', xy=(2, 4), xytext=(2.5, 3.5),
            arrowprops=dict(facecolor='red', shrink=0.05),
            fontweight='bold', fontsize=12, color='blue')
plt.show()
Output:
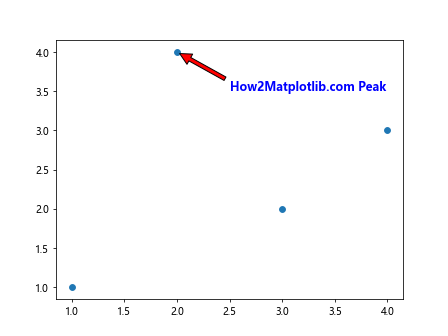
In this example, we use matplotlib annotate bold to highlight a peak in a scatter plot. The annotation is bold, blue, and has a larger font size.
Customizing Matplotlib Annotate Bold
Matplotlib annotate bold offers numerous customization options to enhance your annotations. Let’s explore some of these options:
Font Size
You can adjust the font size of your bold annotations using the fontsize parameter:
import matplotlib.pyplot as plt

fig, ax = plt.subplots()
ax.plot([1, 2, 3, 4], [1, 4, 2, 3])
ax.annotate('How2Matplotlib.com', xy=(2, 4), xytext=(3, 4.5),
            fontweight='bold', fontsize=16)
plt.show()
Output:
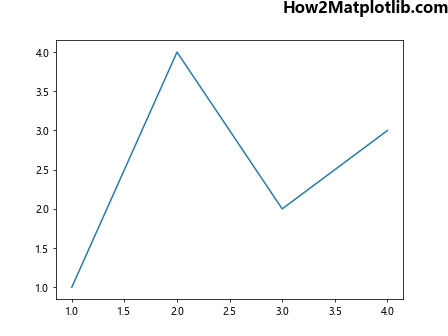
This example demonstrates how to create a larger, bold annotation using matplotlib annotate bold.
Text Color
Change the color of your bold annotations using the color parameter:
import matplotlib.pyplot as plt

fig, ax = plt.subplots()
ax.plot([1, 2, 3, 4], [1, 4, 2, 3])
ax.annotate('How2Matplotlib.com', xy=(2, 4), xytext=(3, 4.5),
            fontweight='bold', color='red')
plt.show()
Output:
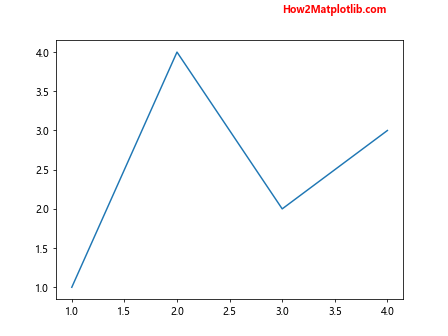
This example shows how to create a red, bold annotation using matplotlib annotate bold.
Arrow Properties
Customize the arrow connecting the annotation to the data point using the arrowprops parameter:
import matplotlib.pyplot as plt

fig, ax = plt.subplots()
ax.plot([1, 2, 3, 4], [1, 4, 2, 3])
ax.annotate('How2Matplotlib.com', xy=(2, 4), xytext=(3, 4.5),
            fontweight='bold',
            arrowprops=dict(facecolor='green', shrink=0.05, width=2))
plt.show()
Output:
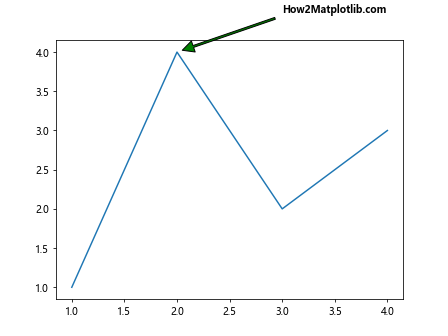
This example demonstrates how to customize the arrow of a bold annotation using matplotlib annotate bold.
Advanced Techniques with Matplotlib Annotate Bold
Now that we’ve covered the basics, let’s explore some advanced techniques for using matplotlib annotate bold.
Multiple Annotations
You can add multiple bold annotations to a single plot:
import matplotlib.pyplot as plt

fig, ax = plt.subplots()
ax.plot([1, 2, 3, 4], [1, 4, 2, 3])
ax.annotate('How2Matplotlib.com Peak', xy=(2, 4), xytext=(2.5, 4.5),
            fontweight='bold', color='red')
ax.annotate('How2Matplotlib.com Trough', xy=(3, 2), xytext=(3.5, 1.5),
            fontweight='bold', color='blue')
plt.show()
Output:
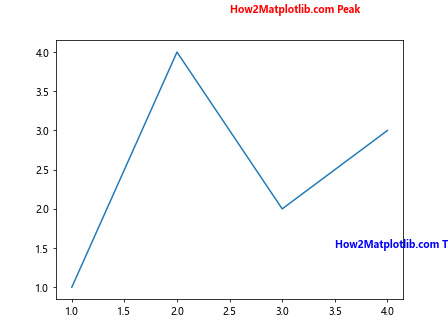
This example shows how to add multiple bold annotations using matplotlib annotate bold to highlight different features of a plot.
Rotated Text
You can rotate the text of your bold annotations:
import matplotlib.pyplot as plt

fig, ax = plt.subplots()
ax.plot([1, 2, 3, 4], [1, 4, 2, 3])
ax.annotate('How2Matplotlib.com', xy=(2, 4), xytext=(2.5, 4.5),
            fontweight='bold', rotation=45)
plt.show()
Output:
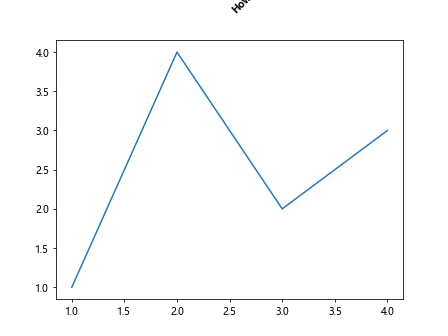
This example demonstrates how to create a rotated, bold annotation using matplotlib annotate bold.
Text Box
You can add a box around your bold annotations:
import matplotlib.pyplot as plt

fig, ax = plt.subplots()
ax.plot([1, 2, 3, 4], [1, 4, 2, 3])
ax.annotate('How2Matplotlib.com', xy=(2, 4), xytext=(3, 4.5),
            fontweight='bold',
            bbox=dict(boxstyle="round", fc="0.8"))
plt.show()
Output:
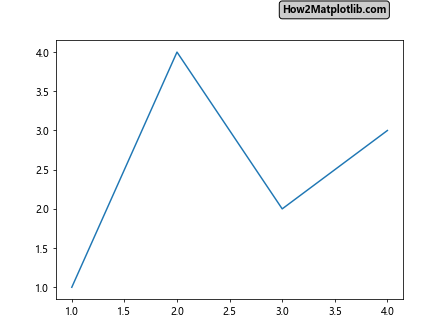
This example shows how to add a box around a bold annotation using matplotlib annotate bold.
Practical Applications of Matplotlib Annotate Bold
Matplotlib annotate bold has numerous practical applications in data visualization. Let’s explore some of these:
Highlighting Data Points
Use matplotlib annotate bold to highlight specific data points:
import matplotlib.pyplot as plt
import numpy as np

x = np.linspace(0, 10, 100)
y = np.sin(x)

fig, ax = plt.subplots()
ax.plot(x, y)
max_y = np.max(y)
max_x = x[np.argmax(y)]
ax.annotate(f'How2Matplotlib.com\nMax: {max_y:.2f}', xy=(max_x, max_y), xytext=(max_x+1, max_y),
            fontweight='bold', arrowprops=dict(facecolor='black', shrink=0.05))
plt.show()
Output:
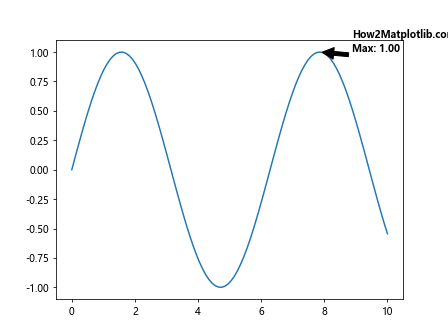
This example demonstrates how to use matplotlib annotate bold to highlight the maximum point of a sine wave.
Labeling Chart Elements
Use matplotlib annotate bold to label different elements of your chart:
import matplotlib.pyplot as plt

fig, ax = plt.subplots()
ax.bar(['A', 'B', 'C', 'D'], [3, 7, 2, 5])
ax.annotate('How2Matplotlib.com\nHighest Bar', xy=(1, 7), xytext=(1.5, 7.5),
            fontweight='bold', arrowprops=dict(facecolor='red', shrink=0.05))
plt.show()
Output:
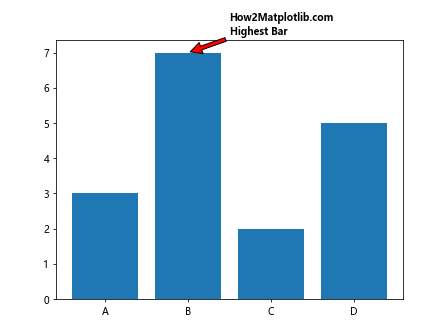
This example shows how to use matplotlib annotate bold to label the highest bar in a bar chart.
Adding Explanatory Notes
Use matplotlib annotate bold to add explanatory notes to your plots:
import matplotlib.pyplot as plt
import numpy as np

x = np.linspace(0, 10, 100)
y1 = np.sin(x)
y2 = np.cos(x)

fig, ax = plt.subplots()
ax.plot(x, y1, label='sin(x)')
ax.plot(x, y2, label='cos(x)')
ax.legend()
ax.annotate('How2Matplotlib.com\nSin and Cos Intersection', xy=(1.57, 0.7),
            xytext=(3, 0.8), fontweight='bold',
            arrowprops=dict(facecolor='green', shrink=0.05))
plt.show()
Output:
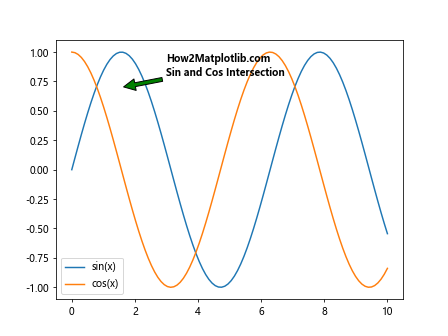
This example demonstrates how to use matplotlib annotate bold to add an explanatory note about the intersection of sine and cosine curves.
Best Practices for Using Matplotlib Annotate Bold
When using matplotlib annotate bold, it’s important to follow some best practices to ensure your annotations are effective and visually appealing:
- Use bold annotations sparingly: While bold text can draw attention, overusing it can make your plot look cluttered.
Choose appropriate font sizes: Make sure your bold annotations are readable but not overpowering.
Use contrasting colors: Choose colors for your bold annotations that stand out against the background of your plot.
Position annotations carefully: Place your bold annotations where they don’t obscure important data points.
Be concise: Keep your bold annotations brief and to the point.
Let’s see an example that follows these best practices: