How to Create Bold Text in Matplotlib: A Comprehensive Guide
Matplotlib text bold is an essential feature for creating visually appealing and informative plots. This article will explore various techniques and best practices for using bold text in Matplotlib, providing detailed explanations and examples to help you master this important aspect of data visualization.
Understanding Matplotlib Text Bold
Matplotlib text bold is a crucial element in data visualization that allows you to emphasize important information and create visually striking plots. By using bold text, you can draw attention to specific labels, titles, or annotations within your charts and graphs. Matplotlib provides several methods to achieve bold text, which we’ll explore in detail throughout this article.
The Importance of Bold Text in Data Visualization
Before diving into the specifics of Matplotlib text bold, it’s essential to understand why bold text is so important in data visualization:
- Emphasis: Bold text helps highlight key information, making it stand out from other elements in the plot.
- Hierarchy: Using bold text can establish a visual hierarchy, guiding the viewer’s attention to the most important parts of the visualization.
- Readability: Bold text can improve readability, especially for smaller font sizes or when dealing with dense information.
- Professionalism: Properly used bold text can enhance the overall appearance of your plots, making them look more polished and professional.
Now that we understand the importance of Matplotlib text bold, let’s explore various methods to implement it in your plots.
Basic Matplotlib Text Bold Techniques
Using the ‘weight’ Parameter
One of the simplest ways to create bold text in Matplotlib is by using the ‘weight’ parameter. This parameter can be set to ‘bold’ or a numeric value to control the thickness of the text.
Here’s a basic example of using the ‘weight’ parameter to create bold text:
import matplotlib.pyplot as plt

fig, ax = plt.subplots()
ax.text(0.5, 0.5, 'How2Matplotlib.com - Bold Text Example',
        fontweight='bold', ha='center', va='center')
plt.show()
Output:
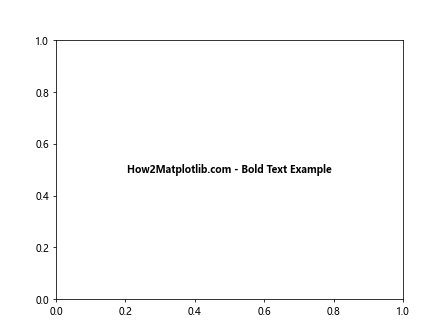
In this example, we create a simple plot and add bold text to the center of the figure using the text() function. The fontweight='bold' parameter sets the text to bold.
Using Font Properties
Another way to create Matplotlib text bold is by using font properties. This method gives you more control over the text appearance and allows you to create custom font styles.
Here’s an example using font properties to create bold text:
import matplotlib.pyplot as plt
from matplotlib.font_manager import FontProperties

fig, ax = plt.subplots()
font_bold = FontProperties(weight='bold')
ax.text(0.5, 0.5, 'How2Matplotlib.com - Bold Font Properties',
        fontproperties=font_bold, ha='center', va='center')
plt.show()
Output:
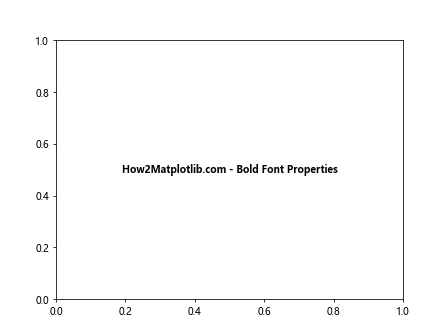
In this example, we create a FontProperties object with weight='bold' and use it to set the text to bold. This method allows for more flexibility in customizing text appearance.
Advanced Matplotlib Text Bold Techniques
Combining Bold Text with Other Styles
Matplotlib text bold can be combined with other text styles to create more complex and visually appealing text elements. Let’s explore how to combine bold text with italic and underlined styles.
import matplotlib.pyplot as plt

fig, ax = plt.subplots()
ax.text(0.5, 0.7, 'How2Matplotlib.com - Bold and Italic',
        fontweight='bold', fontstyle='italic', ha='center', va='center')
ax.text(0.5, 0.3, 'How2Matplotlib.com - Bold and Underlined',
        fontweight='bold', ha='center', va='center',
        bbox=dict(facecolor='none', edgecolor='black', boxstyle='round,pad=0.5'))
plt.show()
Output:
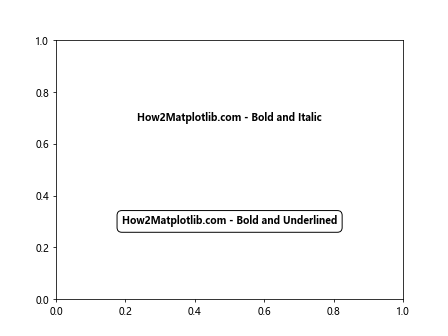
In this example, we create two text elements: one that combines bold and italic styles, and another that combines bold text with an underline effect created using a bounding box.
Using HTML-like Tags for Matplotlib Text Bold
Matplotlib supports HTML-like tags for text formatting, including bold text. This method can be particularly useful when you need to apply different styles to different parts of the same text string.
Here’s an example of using HTML-like tags for Matplotlib text bold:
import matplotlib.pyplot as plt

fig, ax = plt.subplots()
ax.text(0.5, 0.5, 'How2Matplotlib.com - Bold and Italic',
        ha='center', va='center', fontsize=12,
        bbox=dict(facecolor='white', edgecolor='black', boxstyle='round,pad=0.5'))
plt.rcParams['font.family'] = 'sans-serif'
plt.rcParams['font.sans-serif'] = ['Arial']
plt.show()
Output:
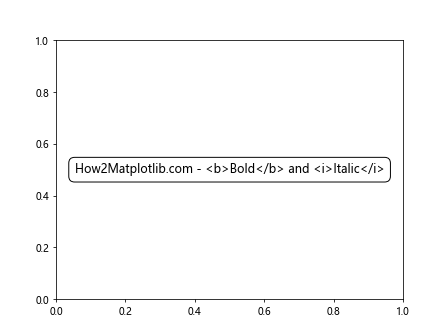
In this example, we use the tag to create bold text and the tag for italic text within the same string. Note that we need to set the font family to a sans-serif font like Arial for the HTML-like tags to work properly.
Matplotlib Text Bold in Different Plot Types
Bold Text in Line Plots
Let’s explore how to use Matplotlib text bold in line plots to emphasize important information.
import matplotlib.pyplot as plt
import numpy as np

x = np.linspace(0, 10, 100)
y1 = np.sin(x)
y2 = np.cos(x)

fig, ax = plt.subplots()
ax.plot(x, y1, label='Sine')
ax.plot(x, y2, label='Cosine')
ax.set_title('How2Matplotlib.com - Trigonometric Functions', fontweight='bold')
ax.set_xlabel('X-axis', fontweight='bold')
ax.set_ylabel('Y-axis', fontweight='bold')
ax.legend(title='Legend', title_fontproperties={'weight': 'bold'})
plt.show()
Output:
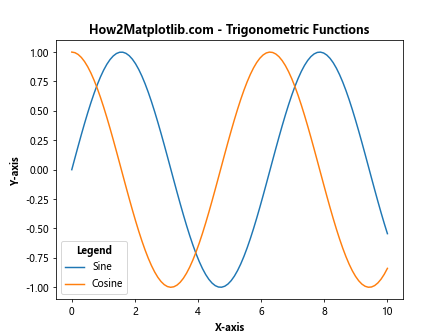
In this example, we create a line plot with two trigonometric functions and use bold text for the title, axis labels, and legend title.
Bold Text in Bar Charts
Matplotlib text bold can be particularly effective in bar charts to highlight specific categories or values.
import matplotlib.pyplot as plt
import numpy as np

categories = ['A', 'B', 'C', 'D']
values = [4, 7, 2, 8]

fig, ax = plt.subplots()
bars = ax.bar(categories, values)
ax.set_title('How2Matplotlib.com - Bar Chart Example', fontweight='bold')
ax.set_xlabel('Categories', fontweight='bold')
ax.set_ylabel('Values', fontweight='bold')

for i, v in enumerate(values):
    ax.text(i, v, str(v), ha='center', va='bottom', fontweight='bold')

plt.show()
Output:
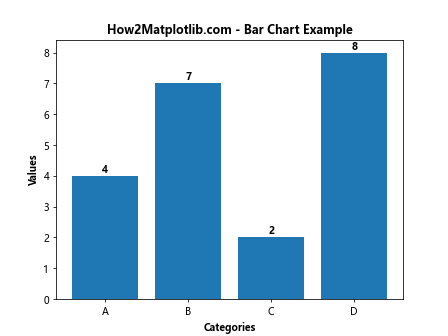
In this example, we create a bar chart and use bold text for the title, axis labels, and value annotations above each bar.
Bold Text in Scatter Plots
Scatter plots can benefit from Matplotlib text bold to emphasize specific data points or annotations.
import matplotlib.pyplot as plt
import numpy as np

np.random.seed(42)
x = np.random.rand(50)
y = np.random.rand(50)
colors = np.random.rand(50)
sizes = 1000 * np.random.rand(50)

fig, ax = plt.subplots()
scatter = ax.scatter(x, y, c=colors, s=sizes, alpha=0.5)
ax.set_title('How2Matplotlib.com - Scatter Plot Example', fontweight='bold')
ax.set_xlabel('X-axis', fontweight='bold')
ax.set_ylabel('Y-axis', fontweight='bold')

ax.text(0.5, 0.95, 'Important Data Point', ha='center', va='top',
        fontweight='bold', transform=ax.transAxes)

plt.show()
Output:
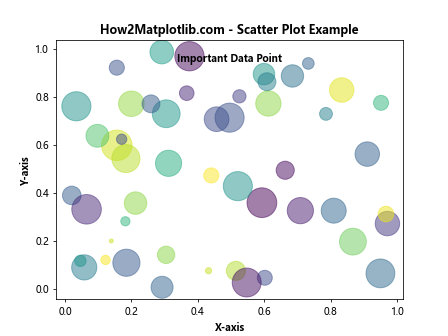
In this example, we create a scatter plot with random data points and use bold text for the title, axis labels, and an annotation highlighting an important data point.
Customizing Matplotlib Text Bold
Adjusting Bold Text Weight
Matplotlib allows you to fine-tune the weight of bold text by using numeric values instead of the ‘bold’ keyword.
import matplotlib.pyplot as plt

fig, ax = plt.subplots()
weights = ['normal', 'bold', 'heavy', 100, 200, 500, 800]

for i, weight in enumerate(weights):
    ax.text(0.1, 1 - (i+1)*0.1, f'How2Matplotlib.com - Weight: {weight}',
            fontweight=weight)

ax.set_title('Matplotlib Text Bold Weight Comparison', fontweight='bold')
ax.axis('off')
plt.show()
Output:
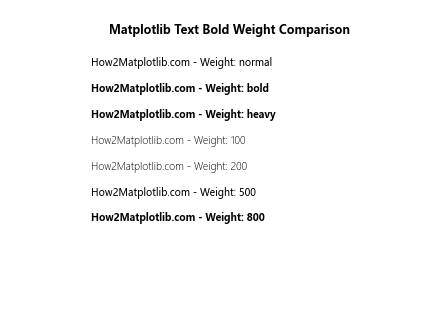
This example demonstrates different text weights, ranging from normal to heavy, and including numeric values for more precise control.
Combining Bold Text with Different Fonts
Matplotlib text bold can be combined with different fonts to create unique and visually appealing text styles.
import matplotlib.pyplot as plt

fig, ax = plt.subplots()
fonts = ['Arial', 'Times New Roman', 'Courier New', 'Verdana']

for i, font in enumerate(fonts):
    ax.text(0.1, 1 - (i+1)*0.2, f'How2Matplotlib.com - {font}',
            fontfamily=font, fontweight='bold')

ax.set_title('Matplotlib Text Bold with Different Fonts', fontweight='bold')
ax.axis('off')
plt.show()
Output:

This example shows how bold text appears with different font families, demonstrating the versatility of Matplotlib text bold.
Matplotlib Text Bold in Annotations
Creating Bold Annotations
Annotations are an essential part of data visualization, and using Matplotlib text bold can make them more effective.
import matplotlib.pyplot as plt
import numpy as np

x = np.linspace(0, 10, 100)
y = np.sin(x)

fig, ax = plt.subplots()
ax.plot(x, y)
ax.set_title('How2Matplotlib.com - Sine Wave with Annotation', fontweight='bold')

ax.annotate('Peak', xy=(np.pi/2, 1), xytext=(np.pi/2, 1.2),
            arrowprops=dict(facecolor='black', shrink=0.05),
            fontweight='bold', ha='center')

plt.show()
Output:
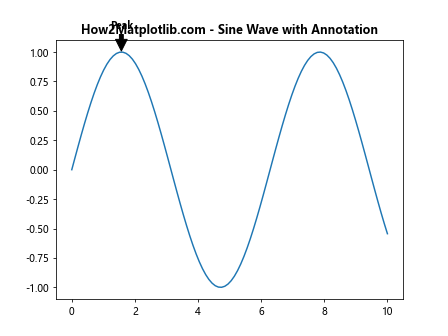
In this example, we create a sine wave plot with a bold annotation pointing to the peak of the wave.
Using Bold Text in Text Boxes
Text boxes are useful for adding explanatory text to plots, and Matplotlib text bold can make this information stand out.
import matplotlib.pyplot as plt
import numpy as np

x = np.linspace(0, 10, 100)
y = np.exp(-x/10) * np.sin(x)

fig, ax = plt.subplots()
ax.plot(x, y)
ax.set_title('How2Matplotlib.com - Damped Sine Wave', fontweight='bold')

textstr = 'Important Notes:\n\n- Amplitude decreases\n- Frequency constant'
props = dict(boxstyle='round', facecolor='wheat', alpha=0.5)
ax.text(0.05, 0.95, textstr, transform=ax.transAxes, fontsize=10,
        verticalalignment='top', bbox=props, fontweight='bold')

plt.show()
Output:
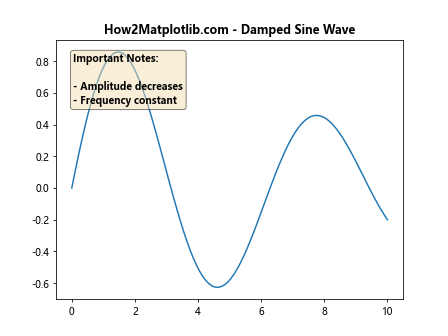
This example demonstrates how to use bold text in a text box to provide additional information about the plot.
Matplotlib Text Bold in Subplots
Applying Bold Text to Multiple Subplots
When working with multiple subplots, Matplotlib text bold can be used to create consistent and visually appealing titles and labels.
import matplotlib.pyplot as plt
import numpy as np

fig, axs = plt.subplots(2, 2, figsize=(10, 10))
fig.suptitle('How2Matplotlib.com - Multiple Subplots', fontweight='bold')

x = np.linspace(0, 10, 100)

axs[0, 0].plot(x, np.sin(x))
axs[0, 0].set_title('Sine Wave', fontweight='bold')

axs[0, 1].plot(x, np.cos(x))
axs[0, 1].set_title('Cosine Wave', fontweight='bold')

axs[1, 0].plot(x, np.exp(x))
axs[1, 0].set_title('Exponential', fontweight='bold')

axs[1, 1].plot(x, np.log(x))
axs[1, 1].set_title('Logarithm', fontweight='bold')

for ax in axs.flat:
    ax.set(xlabel='X-axis', ylabel='Y-axis')
    ax.label_outer()

plt.tight_layout()
plt.show()
Output:
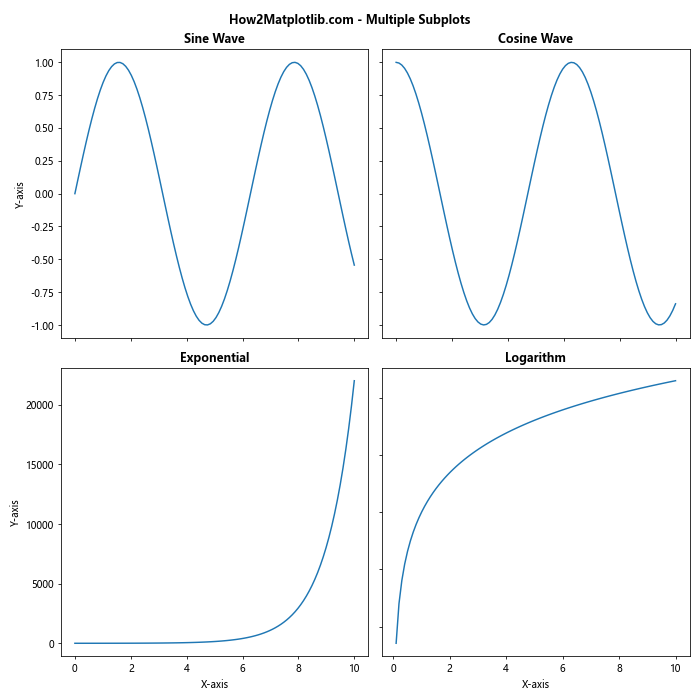
This example creates a 2×2 grid of subplots, each with its own bold title, demonstrating how to apply Matplotlib text bold consistently across multiple plots.
Advanced Matplotlib Text Bold Techniques
Creating Custom Text Styles
For more complex text styling needs, you can create custom text styles that include bold text along with other properties.
import matplotlib.pyplot as plt
from matplotlib.font_manager import FontProperties

fig, ax = plt.subplots()

custom_font = FontProperties(family='Arial', weight='bold', style='italic', size=14)
ax.text(0.5, 0.5, 'How2Matplotlib.com - Custom Style', fontproperties=custom_font,
        ha='center', va='center')

ax.set_title('Custom Text Style Example', fontweight='bold')
ax.axis('off')
plt.show()
Output:
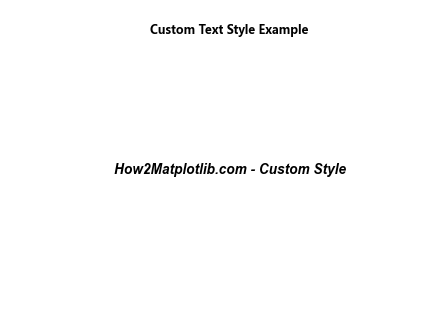
This example demonstrates how to create a custom font style that combines bold text with italic style and a specific font size.
Using LaTeX for Bold Mathematical Expressions
Matplotlib supports LaTeX rendering, which can be useful for creating bold mathematical expressions.
import matplotlib.pyplot as plt

fig, ax = plt.subplots()

ax.text(0.5, 0.7, r'$\mathbf{F} = m\mathbf{a}$', fontsize=16, ha='center')
ax.text(0.5, 0.3, r'How2Matplotlib.com - $\boldsymbol{\nabla} \cdot \mathbf{E} = \frac{\rho}{\epsilon_0}$',
        fontsize=16, ha='center')

ax.set_title("LaTeX Bold Mathematical Expressions", fontweight='bold')
ax.axis('off')
plt.show()
Output:
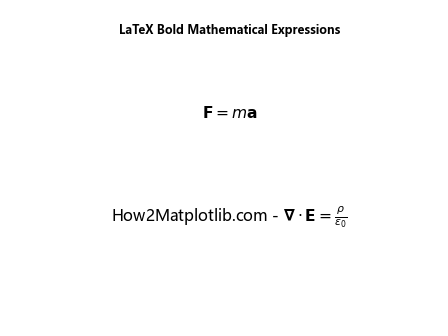
This example shows how to use LaTeX commands to create bold mathematical expressions within Matplotlib plots.
Best Practices for Using Matplotlib Text Bold
When using Matplotlib text bold, it’s important to follow some best practices to ensure your plots are both visually appealing and effective in conveying information:
- Use bold text sparingly: Overusing bold text can reduce its impact and make your plots look cluttered.
Maintain consistency: Use bold text consistently throughout your plot for similar elements (e.g., all axis labels or all titles).
Consider contrast: Ensure that bold text has sufficient contrast with the background for readability.
Combine with other styles: Use bold text in combination with other styles (e.g., italics, different colors) to create a clear visual hierarchy.
Test different weights: Experiment with different bold weights to find the right balance between emphasis and readability.
Consider font compatibility: Some fonts may not have a true bold variant, so test your chosen font to ensure it displays correctly when bold.
Use for emphasis: Reserve bold text for the most important information or key takeaways in your plot.
Balance with other elements: Ensure that bold text doesn’t overpower other important visual elements in your plot.
Accessibility: Consider how bold text affects accessibility for viewers with visual impairments.
Export compatibility: Test your plots with bold text in different export formats to ensure the styling is preserved.
Troubleshooting Common Matplotlib Text Bold Issues
When working with Matplotlib text bold, you may encounter some common issues. Here are some problems and their solutions: