How to Customize Matplotlib Xticks Font Size: A Comprehensive Guide
Matplotlib xticks font size is an essential aspect of data visualization that can significantly impact the readability and overall appearance of your plots. In this comprehensive guide, we’ll explore various techniques to adjust the matplotlib xticks font size, providing you with the knowledge and tools to create visually appealing and informative charts. We’ll cover everything from basic font size adjustments to advanced customization options, ensuring that you can effectively control the matplotlib xticks font size in your data visualizations.
Understanding Matplotlib Xticks Font Size
Before diving into the specifics of adjusting matplotlib xticks font size, it’s crucial to understand what xticks are and why their font size matters. In Matplotlib, xticks refer to the labels and tick marks along the x-axis of a plot. The font size of these xticks plays a vital role in the overall readability and aesthetics of your visualization.
Matplotlib xticks font size can be adjusted using various methods, allowing you to customize the appearance of your x-axis labels to suit your specific needs. Whether you’re creating a simple line plot or a complex multi-axis chart, controlling the matplotlib xticks font size is essential for producing clear and professional-looking visualizations.
Let’s start with a basic example of how to create a plot and adjust the matplotlib xticks font size:
import matplotlib.pyplot as plt

# Create sample data
x = [1, 2, 3, 4, 5]
y = [2, 4, 6, 8, 10]

# Create the plot
plt.figure(figsize=(10, 6))
plt.plot(x, y, marker='o')

# Set the title and labels
plt.title('How to adjust matplotlib xticks font size - how2matplotlib.com')
plt.xlabel('X-axis')
plt.ylabel('Y-axis')

# Adjust xticks font size
plt.xticks(fontsize=14)

# Display the plot
plt.show()
Output:
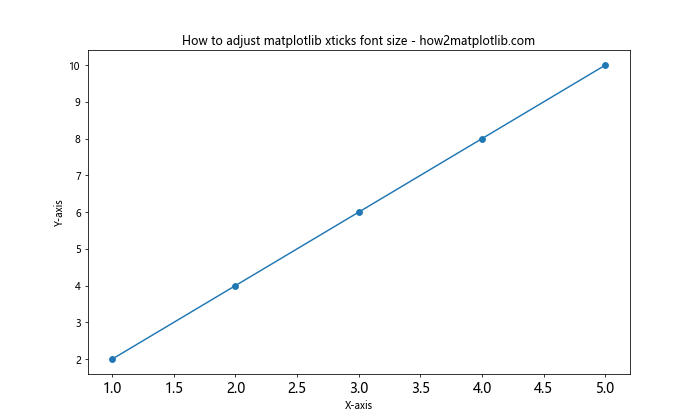
In this example, we’ve created a simple line plot and used the plt.xticks() function to set the matplotlib xticks font size to 14. This is one of the most straightforward ways to adjust the font size of your x-axis labels.
Methods for Adjusting Matplotlib Xticks Font Size
There are several methods you can use to customize the matplotlib xticks font size. Let’s explore some of the most common and effective techniques:
1. Using plt.xticks()
The plt.xticks() function is a versatile tool for adjusting various aspects of your x-axis ticks, including the matplotlib xticks font size. Here’s an example that demonstrates how to use this function to set custom tick locations and labels while also adjusting the font size:
import matplotlib.pyplot as plt
import numpy as np

# Create sample data
x = np.arange(0, 10, 0.1)
y = np.sin(x)

# Create the plot
plt.figure(figsize=(12, 6))
plt.plot(x, y)

# Set custom xticks and adjust font size
plt.xticks(np.arange(0, 11, 2), ['0', '2π', '4π', '6π', '8π', '10π'], fontsize=16)

# Set the title and labels
plt.title('Sine Wave with Custom Xticks - how2matplotlib.com')
plt.xlabel('X-axis')
plt.ylabel('Y-axis')

# Display the plot
plt.show()
Output:
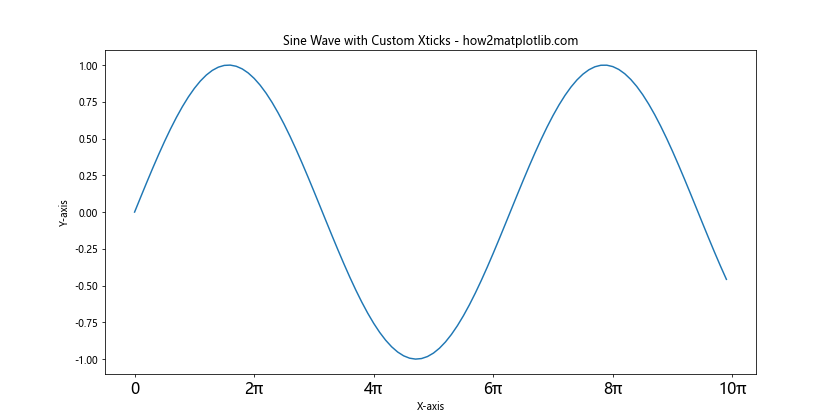
In this example, we’ve created a sine wave plot and used plt.xticks() to set custom tick locations and labels. The fontsize parameter is used to adjust the matplotlib xticks font size to 16.
2. Using tick_params()
Another powerful method for adjusting matplotlib xticks font size is the tick_params() function. This function allows you to modify various tick parameters, including the font size, for both x and y axes simultaneously. Here’s an example:
import matplotlib.pyplot as plt

# Create sample data
x = [1, 2, 3, 4, 5]
y = [2, 4, 6, 8, 10]

# Create the plot
plt.figure(figsize=(10, 6))
plt.plot(x, y, marker='o')

# Set the title and labels
plt.title('Using tick_params() to adjust xticks font size - how2matplotlib.com')
plt.xlabel('X-axis')
plt.ylabel('Y-axis')

# Adjust xticks font size using tick_params()
plt.tick_params(axis='x', labelsize=18)

# Display the plot
plt.show()
Output:
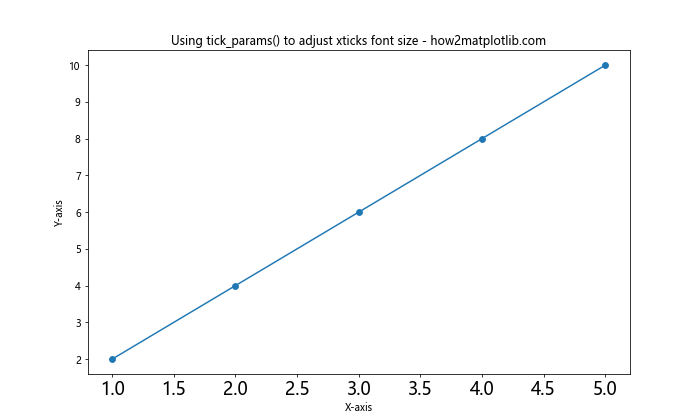
In this example, we’ve used plt.tick_params() to set the matplotlib xticks font size to 18. The axis='x' parameter specifies that we want to adjust only the x-axis ticks.
3. Using rcParams
For a more global approach to adjusting matplotlib xticks font size, you can use the rcParams dictionary. This method allows you to set default values for various plot parameters, including font sizes. Here’s an example:
import matplotlib.pyplot as plt

# Set global font size for xticks
plt.rcParams['xtick.labelsize'] = 16

# Create sample data
x = [1, 2, 3, 4, 5]
y = [2, 4, 6, 8, 10]

# Create the plot
plt.figure(figsize=(10, 6))
plt.plot(x, y, marker='o')

# Set the title and labels
plt.title('Using rcParams to adjust xticks font size - how2matplotlib.com')
plt.xlabel('X-axis')
plt.ylabel('Y-axis')

# Display the plot
plt.show()
Output:
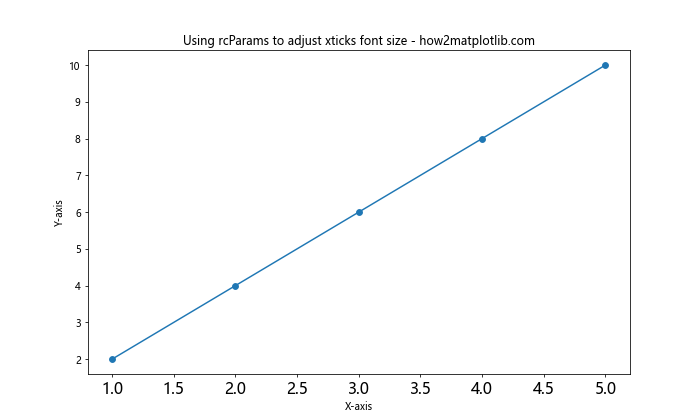
In this example, we’ve used plt.rcParams['xtick.labelsize'] = 16 to set the default matplotlib xticks font size to 16 for all subsequent plots in the script.
Advanced Techniques for Matplotlib Xticks Font Size Customization
Now that we’ve covered the basic methods for adjusting matplotlib xticks font size, let’s explore some more advanced techniques that allow for greater customization and control over your x-axis labels.
1. Using Axes Object
When working with more complex plots or subplots, you may want to adjust the matplotlib xticks font size for specific axes. You can do this by accessing the axes object directly. Here’s an example:
import matplotlib.pyplot as plt

# Create sample data
x = [1, 2, 3, 4, 5]
y1 = [2, 4, 6, 8, 10]
y2 = [1, 3, 5, 7, 9]

# Create the plot with two subplots
fig, (ax1, ax2) = plt.subplots(2, 1, figsize=(10, 10))

# Plot data on the first subplot
ax1.plot(x, y1, marker='o')
ax1.set_title('Subplot 1 - how2matplotlib.com')
ax1.set_xlabel('X-axis')
ax1.set_ylabel('Y-axis')

# Adjust xticks font size for the first subplot
ax1.tick_params(axis='x', labelsize=14)

# Plot data on the second subplot
ax2.plot(x, y2, marker='s')
ax2.set_title('Subplot 2 - how2matplotlib.com')
ax2.set_xlabel('X-axis')
ax2.set_ylabel('Y-axis')

# Adjust xticks font size for the second subplot
ax2.tick_params(axis='x', labelsize=18)

# Adjust layout and display the plot
plt.tight_layout()
plt.show()
Output:
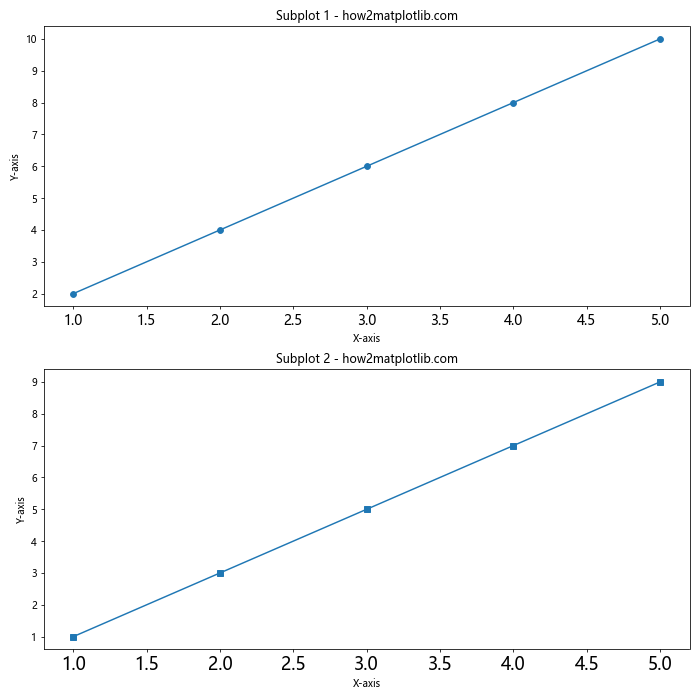
In this example, we’ve created two subplots and adjusted the matplotlib xticks font size separately for each subplot using the tick_params() method on the individual axes objects.
2. Using seaborn with Matplotlib
Seaborn is a popular data visualization library built on top of Matplotlib. It provides a high-level interface for creating attractive statistical graphics. When using seaborn, you can still adjust the matplotlib xticks font size. Here’s an example:
import matplotlib.pyplot as plt
import seaborn as sns

# Set seaborn style
sns.set_style("whitegrid")

# Create sample data
x = [1, 2, 3, 4, 5]
y = [2, 4, 6, 8, 10]

# Create the plot using seaborn
plt.figure(figsize=(10, 6))
sns.lineplot(x=x, y=y, marker='o')

# Set the title and labels
plt.title('Seaborn plot with custom xticks font size - how2matplotlib.com')
plt.xlabel('X-axis')
plt.ylabel('Y-axis')

# Adjust xticks font size
plt.xticks(fontsize=16)

# Display the plot
plt.show()
Output:
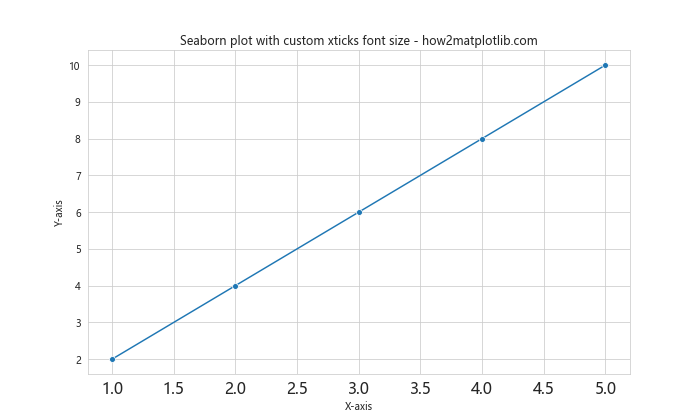
In this example, we’ve created a plot using seaborn’s lineplot() function and then adjusted the matplotlib xticks font size using plt.xticks().
3. Adjusting Font Properties
For even more control over the appearance of your xticks, you can adjust various font properties beyond just the size. Here’s an example that demonstrates how to customize the font family, weight, and style of your xticks:
import matplotlib.pyplot as plt

# Create sample data
x = [1, 2, 3, 4, 5]
y = [2, 4, 6, 8, 10]

# Create the plot
plt.figure(figsize=(10, 6))
plt.plot(x, y, marker='o')

# Set the title and labels
plt.title('Custom font properties for xticks - how2matplotlib.com')
plt.xlabel('X-axis')
plt.ylabel('Y-axis')

# Adjust xticks font properties
plt.xticks(fontsize=14, fontfamily='serif', fontweight='bold', fontstyle='italic')

# Display the plot
plt.show()
Output:
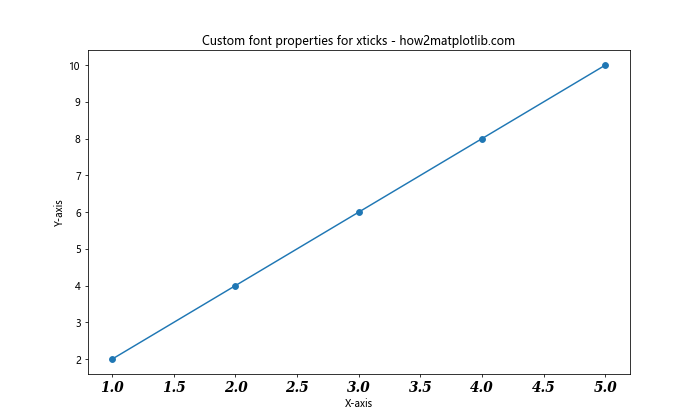
In this example, we’ve used the plt.xticks() function to set the matplotlib xticks font size to 14, change the font family to serif, make the font bold, and apply an italic style.
Handling Long X-axis Labels
When dealing with long x-axis labels, adjusting the matplotlib xticks font size alone may not be sufficient to improve readability. In such cases, you might need to rotate the labels or adjust their alignment. Here’s an example that demonstrates how to handle long x-axis labels:
import matplotlib.pyplot as plt

# Create sample data with long labels
x = ['Category A', 'Category B', 'Category C', 'Category D', 'Category E']
y = [2, 4, 6, 8, 10]

# Create the plot
plt.figure(figsize=(12, 6))
plt.bar(x, y)

# Set the title and labels
plt.title('Handling long x-axis labels - how2matplotlib.com')
plt.xlabel('Categories')
plt.ylabel('Values')

# Adjust xticks font size and rotate labels
plt.xticks(fontsize=12, rotation=45, ha='right')

# Adjust layout to prevent label cutoff
plt.tight_layout()

# Display the plot
plt.show()
Output:
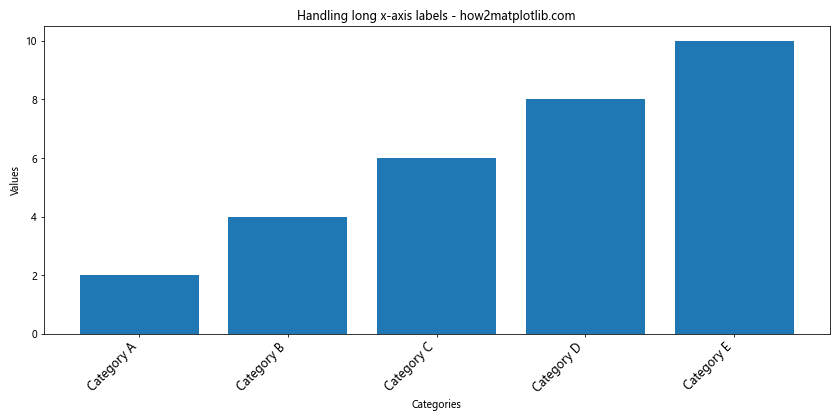
In this example, we’ve created a bar plot with long category names as x-axis labels. We’ve adjusted the matplotlib xticks font size to 12, rotated the labels by 45 degrees, and aligned them to the right using the ha='right' parameter. The plt.tight_layout() function is used to prevent label cutoff.
Customizing Xticks for Different Plot Types
Different types of plots may require different approaches to adjusting matplotlib xticks font size. Let’s explore how to customize xticks for various plot types:
1. Scatter Plot
import matplotlib.pyplot as plt
import numpy as np

# Create sample data
x = np.random.rand(50)
y = np.random.rand(50)

# Create the scatter plot
plt.figure(figsize=(10, 6))
plt.scatter(x, y, alpha=0.5)

# Set the title and labels
plt.title('Scatter plot with custom xticks - how2matplotlib.com')
plt.xlabel('X-axis')
plt.ylabel('Y-axis')

# Adjust xticks font size and format
plt.xticks(np.arange(0, 1.1, 0.2), fontsize=14, fontweight='bold')
plt.gca().xaxis.set_major_formatter(plt.FormatStrFormatter('%.1f'))

# Display the plot
plt.show()
Output:
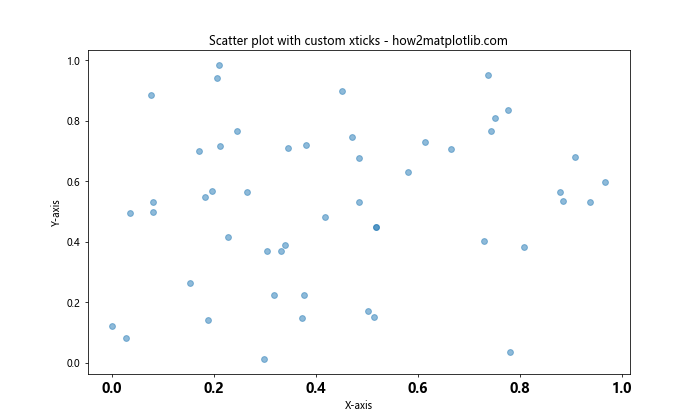
In this example, we’ve created a scatter plot and customized the matplotlib xticks font size, weight, and format. We’ve also used FormatStrFormatter to control the number of decimal places displayed on the x-axis.
2. Histogram
import matplotlib.pyplot as plt
import numpy as np

# Create sample data
data = np.random.normal(0, 1, 1000)

# Create the histogram
plt.figure(figsize=(10, 6))
plt.hist(data, bins=30, edgecolor='black')

# Set the title and labels
plt.title('Histogram with custom xticks - how2matplotlib.com')
plt.xlabel('Values')
plt.ylabel('Frequency')

# Adjust xticks font size and style
plt.xticks(fontsize=12, fontstyle='italic')

# Display the plot
plt.show()
Output:
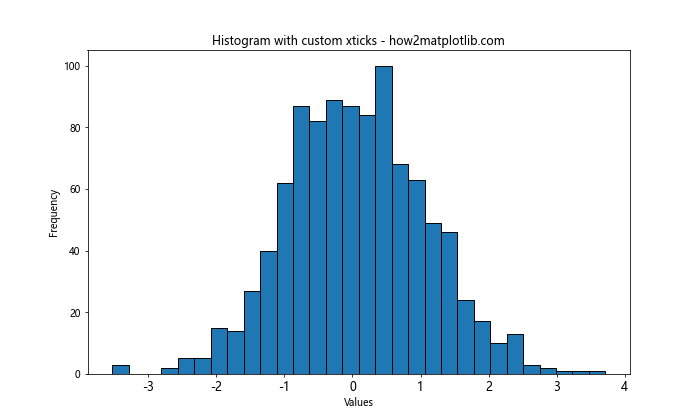
In this example, we’ve created a histogram and customized the matplotlib xticks font size and style to improve readability.
3. Box Plot
import matplotlib.pyplot as plt
import numpy as np

# Create sample data
data = [np.random.normal(0, std, 100) for std in range(1, 4)]

# Create the box plot
plt.figure(figsize=(10, 6))
plt.boxplot(data)

# Set the title and labels
plt.title('Box plot with custom xticks - how2matplotlib.com')
plt.xlabel('Groups')
plt.ylabel('Values')

# Adjust xticks font size and labels
plt.xticks([1, 2, 3], ['Group A', 'Group B', 'Group C'], fontsize=14)

# Display the plot
plt.show()
Output:
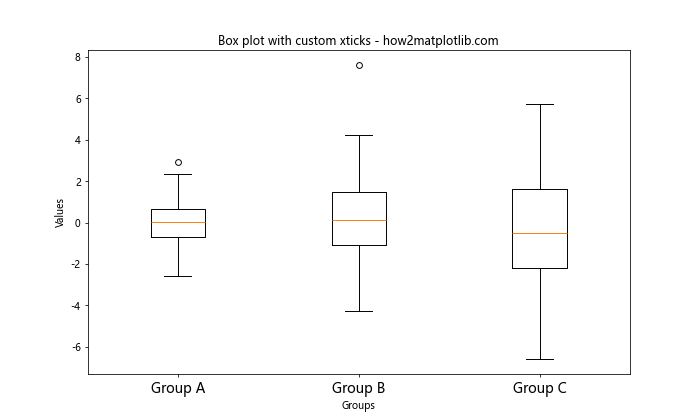
In this example, we’ve created a box plot and customized the matplotlib xticks font size and labels to provide more meaningful group names.
Handling Date and Time X-axis Labels
When working with time series data, you may need to adjust the matplotlib xticks font size for date and time labels. Here’s an example that demonstrates how to handle date-based x-axis labels:
import matplotlib.pyplot as plt
import pandas as pd

# Create sample time series data
dates = pd.date_range(start='2023-01-01', end='2023-12-31', freq='M')
values = [10, 15, 13, 18, 20, 22, 25, 23, 21, 19, 17, 12]

# Create the plot
plt.figure(figsize=(12, 6))
plt.plot(dates, values, marker='o')

# Set the title and labels
plt.title('Time series plot with custom date xticks - how2matplotlib.com')
plt.xlabel('Date')
plt.ylabel('Values')

# Adjust xticks font size and format
plt.xticks(fontsize=12, rotation=45, ha='right')
plt.gca().xaxis.set_major_formatter(plt.DateFormatter('%Y-%m-%d'))

# Adjust layout to prevent label cutoff
plt.tight_layout()

# Display the plot
plt.show()
In this example, we’ve created a time series plot using pandas date range. We’ve adjusted the matplotlib xticks font size, rotated the labels, and used DateFormatter to control the date format displayed on the x-axis.
Customizing Xticks in 3D Plots
When working with 3D plots, you may need to adjust the matplotlib xticks font size for all three axes. Here’s an example that demonstrates how to customize xticks in a 3D surface plot:
import matplotlib.pyplot as plt
import numpy as np
from mpl_toolkits.mplot3d import Axes3D

# Create sample data
x = np.arange(-5, 5, 0.25)
y = np.arange(-5, 5, 0.25)
x, y = np.meshgrid(x, y)
r = np.sqrt(x**2 + y**2)
z = np.sin(r)

# Create the 3D surface plot
fig = plt.figure(figsize=(12, 8))
ax = fig.add_subplot(111, projection='3d')
surf = ax.plot_surface(x, y, z, cmap='viridis')

# Set the title and labels
ax.set_title('3D surface plot with custom xticks - how2matplotlib.com')
ax.set_xlabel('X-axis')
ax.set_ylabel('Y-axis')
ax.set_zlabel('Z-axis')

# Adjust xticks font size for all axes
ax.tick_params(axis='x', labelsize=10)
ax.tick_params(axis='y', labelsize=10)
ax.tick_params(axis='z', labelsize=10)

# Add a color bar
fig.colorbar(surf, shrink=0.5, aspect=5)

# Display the plot
plt.show()
Output:
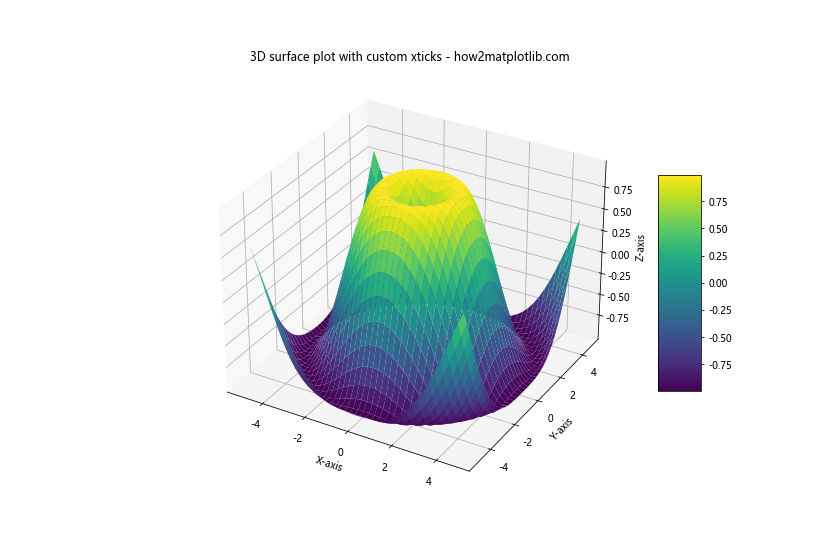
In this example, we’ve created a 3D surface plot and adjusted the matplotlib xticks font size for all three axes using the tick_params() method.
Adjusting Xticks in Subplots with Shared X-axis
When creating multiple subplots with a shared x-axis, you may want to adjust the matplotlib xticks font size consistently across all subplots. Here’s an example that demonstrates how to achieve this:
import matplotlib.pyplot as plt
import numpy as np

# Create sample data
x = np.linspace(0, 10, 100)
y1 = np.sin(x)
y2 = np.cos(x)
y3 = np.tan(x)

# Create subplots with shared x-axis
fig, (ax1, ax2, ax3) = plt.subplots(3, 1, figsize=(12, 10), sharex=True)

# Plot data on each subplot
ax1.plot(x, y1)
ax1.set_title('Sine - how2matplotlib.com')
ax1.set_ylabel('sin(x)')

ax2.plot(x, y2)
ax2.set_title('Cosine - how2matplotlib.com')
ax2.set_ylabel('cos(x)')

ax3.plot(x, y3)
ax3.set_title('Tangent - how2matplotlib.com')
ax3.set_ylabel('tan(x)')
ax3.set_xlabel('X-axis')

# Adjust xticks font size for all subplots
for ax in [ax1, ax2, ax3]:
    ax.tick_params(axis='x', labelsize=12)

# Adjust layout
plt.tight_layout()

# Display the plot
plt.show()
Output:
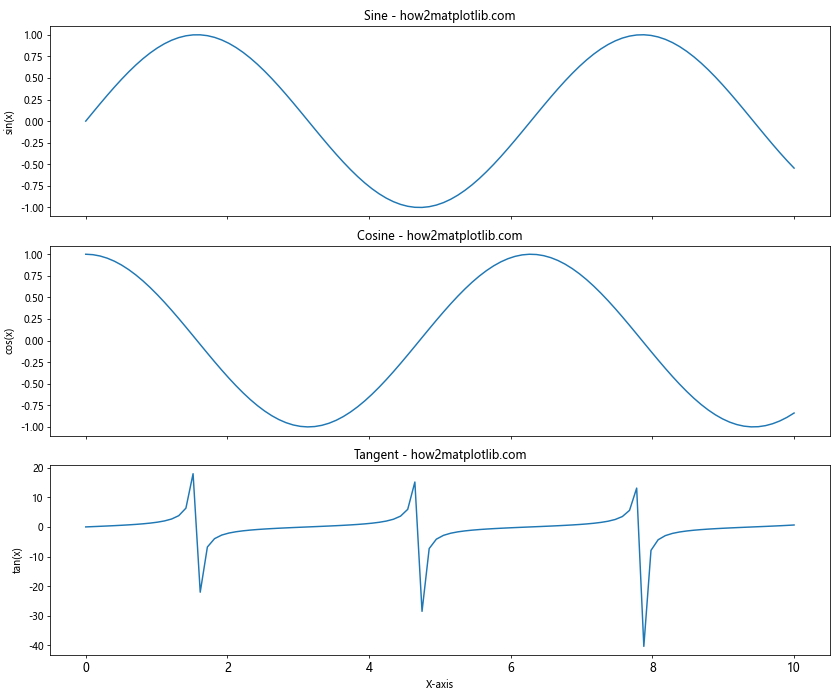
In this example, we’ve created three subplots with a shared x-axis and adjusted the matplotlib xticks font size consistently for all subplots using a loop.
Using LaTeX Formatting for Xticks
For scientific or mathematical plots, you may want to use LaTeX formatting for your x-axis labels. Matplotlib supports LaTeX rendering, allowing you to create professional-looking equations in your xticks. Here’s an example:
import matplotlib.pyplot as plt
import numpy as np

# Enable LaTeX rendering
plt.rcParams['text.usetex'] = True
plt.rcParams['font.family'] = 'serif'

# Create sample data
x = np.linspace(0, 2*np.pi, 100)
y = np.sin(x)

# Create the plot
plt.figure(figsize=(12, 6))
plt.plot(x, y)

# Set the title and labels
plt.title('Sine wave with LaTeX formatted xticks - how2matplotlib.com')
plt.xlabel('$x$')
plt.ylabel('$\sin(x)$')

# Set LaTeX formatted xticks
plt.xticks([0, np.pi/2, np.pi, 3*np.pi/2, 2*np.pi],
           ['$0$', r'$\frac{\pi}{2}$', r'$\pi$', r'$\frac{3\pi}{2}$', r'$2\pi$'],
           fontsize=14)

# Display the plot
plt.show()
In this example, we’ve enabled LaTeX rendering and used LaTeX formatting for the x-axis labels. The matplotlib xticks font size is set to 14 for the LaTeX-formatted labels.
Adjusting Xticks in Polar Plots
Polar plots have a unique circular layout, which requires a different approach to adjusting matplotlib xticks font size. Here’s an example that demonstrates how to customize xticks in a polar plot:
import matplotlib.pyplot as plt
import numpy as np

# Create sample data
r = np.arange(0, 2, 0.01)
theta = 2 * np.pi * r

# Create the polar plot
fig, ax = plt.subplots(figsize=(10, 10), subplot_kw=dict(projection='polar'))
ax.plot(theta, r)

# Set the title
ax.set_title('Polar plot with custom xticks - how2matplotlib.com', fontsize=16)

# Adjust xticks font size and labels
ax.set_xticks(np.arange(0, 2*np.pi, np.pi/4))
ax.set_xticklabels(['0°', '45°', '90°', '135°', '180°', '225°', '270°', '315°'], fontsize=12)

# Adjust yticks font size
ax.tick_params(axis='y', labelsize=10)

# Display the plot
plt.show()
Output:
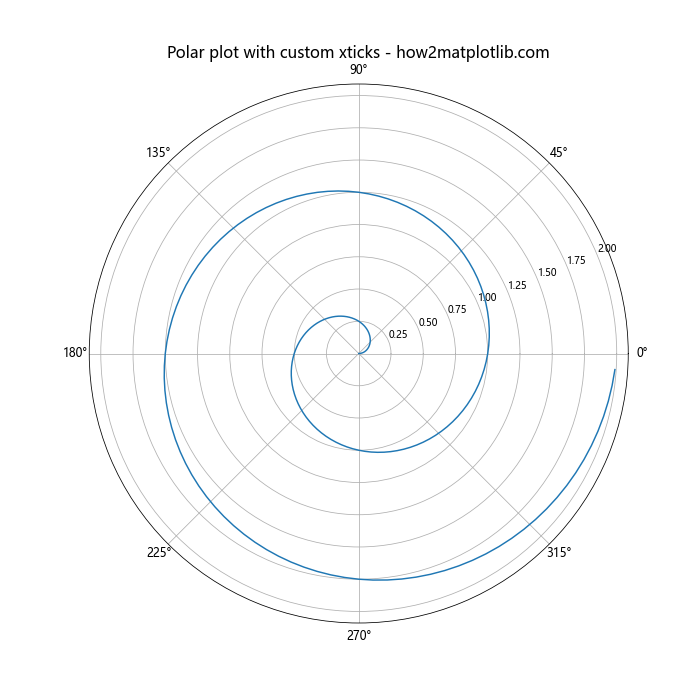
In this example, we’ve created a polar plot and customized the matplotlib xticks font size and labels to display degree values around the circular axis.
Handling Overlapping Xticks
When dealing with a large number of x-axis labels or long label text, you may encounter overlapping xticks. Here are some techniques to handle this issue:
1. Rotating Labels
import matplotlib.pyplot as plt
import numpy as np

# Create sample data with many x-axis labels
x = np.arange(20)
y = np.random.rand(20)

# Create the plot
plt.figure(figsize=(12, 6))
plt.bar(x, y)

# Set the title and labels
plt.title('Handling overlapping xticks - how2matplotlib.com')
plt.xlabel('Categories')
plt.ylabel('Values')

# Rotate xticks to prevent overlap
plt.xticks(x, [f'Category {i}' for i in x], rotation=45, ha='right', fontsize=10)

# Adjust layout
plt.tight_layout()

# Display the plot
plt.show()
Output:
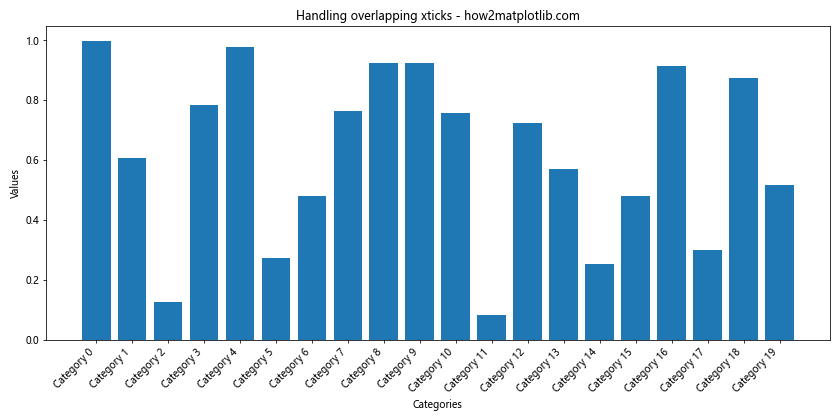
In this example, we’ve rotated the x-axis labels by 45 degrees and aligned them to the right to prevent overlap.
2. Using Fewer Ticks
import matplotlib.pyplot as plt
import numpy as np

# Create sample data with many x-axis values
x = np.linspace(0, 100, 1000)
y = np.sin(x)

# Create the plot
plt.figure(figsize=(12, 6))
plt.plot(x, y)

# Set the title and labels
plt.title('Using fewer xticks - how2matplotlib.com')
plt.xlabel('X-axis')
plt.ylabel('Y-axis')

# Set fewer xticks to prevent overlap
plt.xticks(np.arange(0, 101, 20), fontsize=12)

# Display the plot
plt.show()
Output:
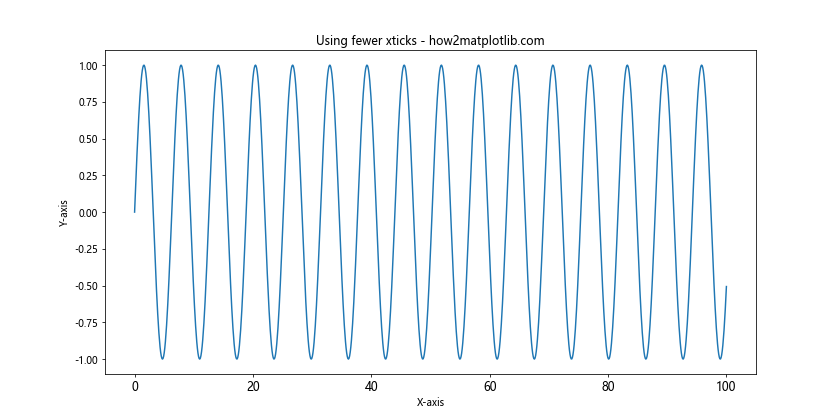
In this example, we’ve reduced the number of x-axis ticks to prevent overlap while maintaining readability.
Customizing Xticks in Logarithmic Plots
When working with logarithmic scales, adjusting matplotlib xticks font size requires special consideration. Here’s an example that demonstrates how to customize xticks in a logarithmic plot:
import matplotlib.pyplot as plt
import numpy as np

# Create sample data
x = np.logspace(0, 5, 100)
y = x**2

# Create the logarithmic plot
plt.figure(figsize=(12, 6))
plt.loglog(x, y)

# Set the title and labels
plt.title('Logarithmic plot with custom xticks - how2matplotlib.com')
plt.xlabel('X-axis (log scale)')
plt.ylabel('Y-axis (log scale)')

# Customize xticks
plt.xticks(fontsize=12)
plt.gca().xaxis.set_major_formatter(plt.FuncFormatter(lambda x, _: f'{x:.0e}'))

# Display the plot
plt.show()
Output:
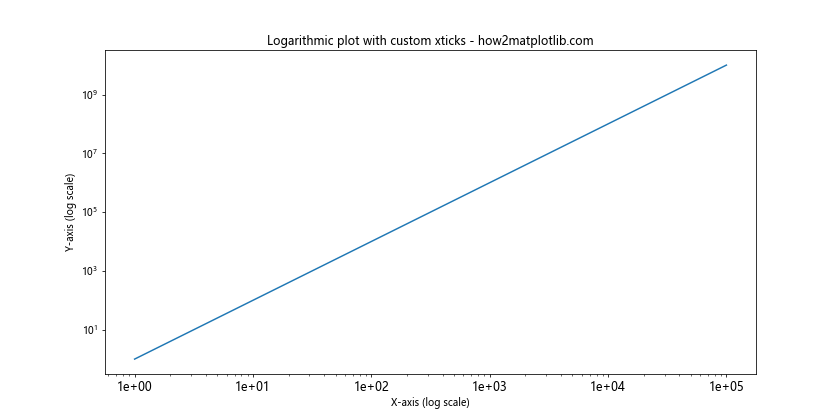
In this example, we’ve created a logarithmic plot and customized the matplotlib xticks font size. We’ve also used a custom formatter to display x-axis labels in scientific notation.
Matplotlib xticks font size Conclusion
Mastering the art of adjusting matplotlib xticks font size is crucial for creating clear, readable, and visually appealing data visualizations. Throughout this comprehensive guide, we’ve explored various techniques and best practices for customizing xticks in different plot types and scenarios.
From basic font size adjustments using plt.xticks() to more advanced techniques like handling date-based labels and using LaTeX formatting, you now have a wide range of tools at your disposal to fine-tune the appearance of your x-axis labels.
Remember that the optimal matplotlib xticks font size may vary depending on the specific requirements of your plot, the amount of data being displayed, and the overall layout of your visualization. Don’t hesitate to experiment with different font sizes, styles, and formatting options to find the perfect balance between readability and aesthetics.
By applying the techniques and examples provided in this guide, you’ll be well-equipped to create professional-looking charts and graphs with perfectly customized x-axis labels. Whether you’re working on simple line plots or complex multi-axis visualizations, mastering matplotlib xticks font size customization will help you effectively communicate your data insights to your audience.