How to Display Text on Boxplot in Matplotlib
How to display text on boxplot in Matplotlib is an essential skill for data visualization enthusiasts and professionals alike. This article will delve deep into the various techniques and methods to effectively add text to your boxplots using Matplotlib. We’ll explore different approaches, customization options, and best practices to enhance your data presentations. By the end of this guide, you’ll be well-equipped to create informative and visually appealing boxplots with text annotations.
Understanding Boxplots and Text Display in Matplotlib
Before we dive into the specifics of how to display text on boxplot in Matplotlib, let’s briefly review what boxplots are and why adding text to them can be beneficial.
Boxplots, also known as box-and-whisker plots, are a standardized way of displaying the distribution of data based on a five-number summary: minimum, first quartile, median, third quartile, and maximum. They provide a quick visual representation of the spread and skewness of data.
Adding text to boxplots can enhance their informativeness by:
- Displaying exact values for statistical measures
- Labeling outliers
- Providing additional context or explanations
- Highlighting specific data points or ranges
Now, let’s explore how to display text on boxplot in Matplotlib through various examples and techniques.
Basic Text Display on Boxplot
To begin with, let’s look at a simple example of how to display text on boxplot in Matplotlib:
import matplotlib.pyplot as plt
import numpy as np

# Generate sample data
data = [np.random.normal(0, std, 100) for std in range(1, 4)]

# Create boxplot
fig, ax = plt.subplots(figsize=(10, 6))
bp = ax.boxplot(data)

# Add text to the plot
ax.text(1, 4, 'How to display text on boxplot\nin Matplotlib', ha='center', va='bottom')

plt.title('How to display text on boxplot in Matplotlib - Basic Example')
plt.xlabel('Groups')
plt.ylabel('Values')

plt.savefig('how2matplotlib.com_boxplot_text_basic.png')
plt.show()
Output:
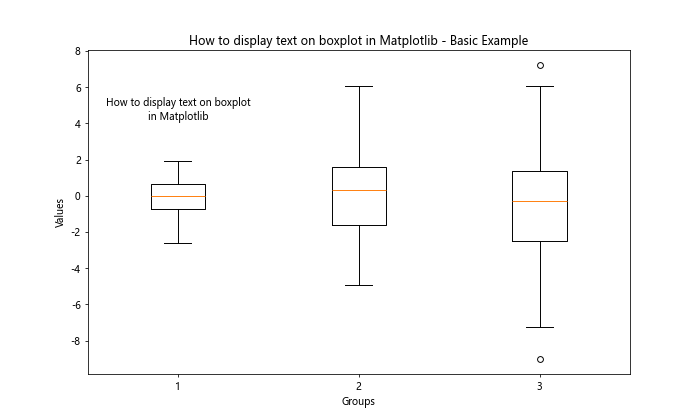
In this example, we’ve created a basic boxplot and added text using the ax.text() method. The text is positioned at x=1 and y=4, with center horizontal alignment and bottom vertical alignment. This demonstrates a simple way of how to display text on boxplot in Matplotlib.
Adding Statistical Information to Boxplots
One common use case for adding text to boxplots is to display statistical information. Let’s see how to display text on boxplot in Matplotlib to show median values:
import matplotlib.pyplot as plt
import numpy as np

# Generate sample data
data = [np.random.normal(0, std, 100) for std in range(1, 4)]

# Create boxplot
fig, ax = plt.subplots(figsize=(10, 6))
bp = ax.boxplot(data)

# Add median values as text
for i, median in enumerate(bp['medians']):
    median_val = median.get_ydata()[0]
    ax.text(i+1, median_val, f'Median: {median_val:.2f}',
            ha='center', va='bottom', fontweight='bold')

plt.title('How to display text on boxplot in Matplotlib - Median Values')
plt.xlabel('Groups')
plt.ylabel('Values')

plt.savefig('how2matplotlib.com_boxplot_text_median.png')
plt.show()
Output:
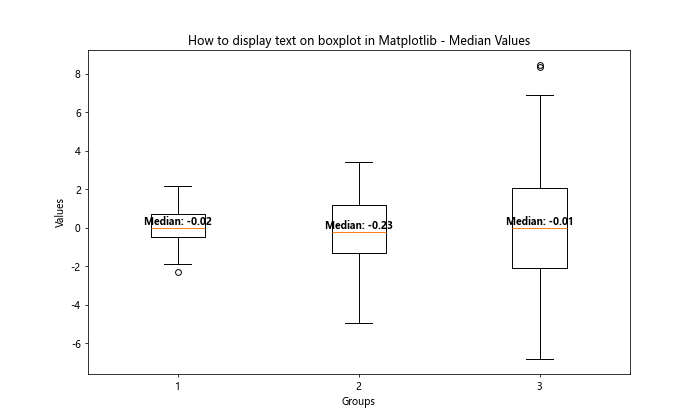
This example demonstrates how to display text on boxplot in Matplotlib by adding the median values for each box. We iterate through the median lines of the boxplot and use their y-coordinates to position the text accurately.
Labeling Outliers on Boxplots
Another useful application of how to display text on boxplot in Matplotlib is labeling outliers. Here’s an example:
import matplotlib.pyplot as plt
import numpy as np

# Generate sample data with outliers
np.random.seed(42)
data = [np.random.normal(0, 1, 100) for _ in range(3)]
outliers = [np.random.uniform(3, 4, 5) for _ in range(3)]
for i in range(3):
    data[i] = np.concatenate([data[i], outliers[i]])

# Create boxplot
fig, ax = plt.subplots(figsize=(10, 6))
bp = ax.boxplot(data)

# Label outliers
for i, d in enumerate(data):
    outlier_mask = d > bp['caps'][i*2+1].get_ydata()[0]
    outliers = d[outlier_mask]
    for j, outlier in enumerate(outliers):
        ax.text(i+1, outlier, f'Outlier {j+1}', ha='left', va='center')

plt.title('How to display text on boxplot in Matplotlib - Labeling Outliers')
plt.xlabel('Groups')
plt.ylabel('Values')

plt.savefig('how2matplotlib.com_boxplot_text_outliers.png')
plt.show()
Output:
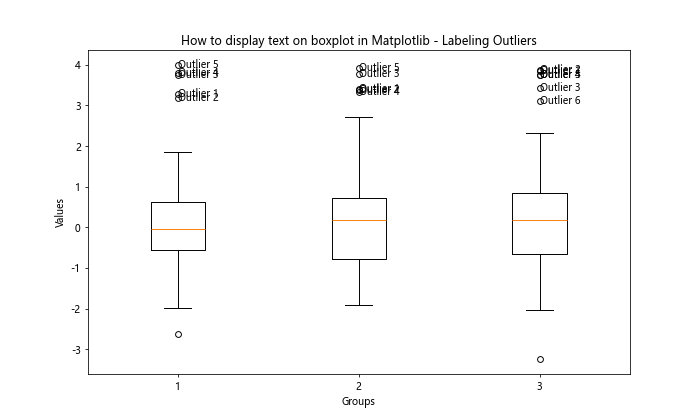
This example shows how to display text on boxplot in Matplotlib by labeling outliers. We identify outliers by comparing data points to the upper whisker of each box, then add text labels next to each outlier.
Customizing Text Appearance
When learning how to display text on boxplot in Matplotlib, it’s important to know how to customize the appearance of the text. Let’s explore some options:
import matplotlib.pyplot as plt
import numpy as np

# Generate sample data
data = [np.random.normal(0, std, 100) for std in range(1, 4)]

# Create boxplot
fig, ax = plt.subplots(figsize=(10, 6))
bp = ax.boxplot(data)

# Add customized text
ax.text(1, 4, 'Bold Red Text', color='red', fontweight='bold', fontsize=14)
ax.text(2, 4, 'Italic Blue Text', color='blue', fontstyle='italic', fontsize=12)
ax.text(3, 4, 'Custom Font', fontfamily='serif', fontsize=16)

plt.title('How to display text on boxplot in Matplotlib - Custom Text Appearance')
plt.xlabel('Groups')
plt.ylabel('Values')

plt.savefig('how2matplotlib.com_boxplot_text_custom.png')
plt.show()
Output:
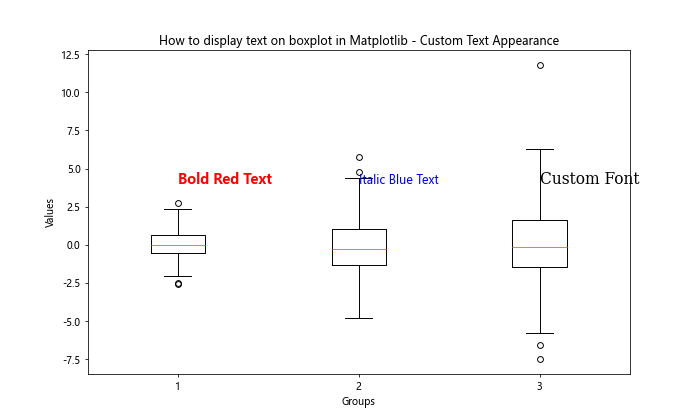
This example demonstrates various ways to customize text when learning how to display text on boxplot in Matplotlib. We’ve shown how to change color, font weight, font style, font size, and font family.
Adding Annotations with Arrows
To make your text more informative when learning how to display text on boxplot in Matplotlib, you can add annotations with arrows:
import matplotlib.pyplot as plt
import numpy as np

# Generate sample data
data = [np.random.normal(0, std, 100) for std in range(1, 4)]

# Create boxplot
fig, ax = plt.subplots(figsize=(10, 6))
bp = ax.boxplot(data)

# Add annotations with arrows
ax.annotate('Median', xy=(1, bp['medians'][0].get_ydata()[0]),
            xytext=(0.5, 3), textcoords='data',
            arrowprops=dict(arrowstyle="->", connectionstyle="arc3"))

ax.annotate('Upper Quartile', xy=(2, bp['boxes'][1].get_ydata()[2]),
            xytext=(1.5, 4), textcoords='data',
            arrowprops=dict(arrowstyle="->", connectionstyle="arc3"))

plt.title('How to display text on boxplot in Matplotlib - Annotations with Arrows')
plt.xlabel('Groups')
plt.ylabel('Values')

plt.savefig('how2matplotlib.com_boxplot_text_annotations.png')
plt.show()
Output:
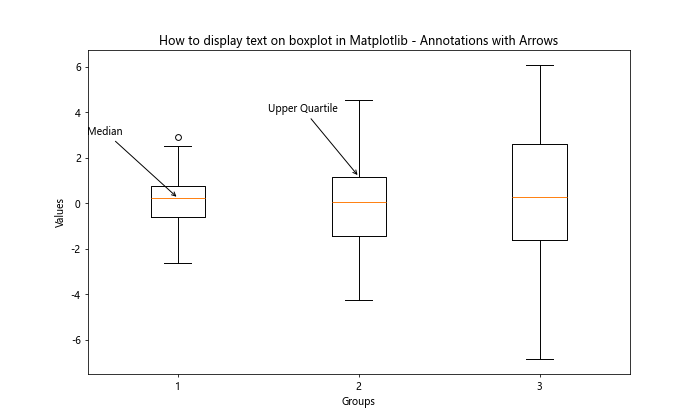
This example shows how to display text on boxplot in Matplotlib using annotations with arrows. We use the annotate() function to create text with arrows pointing to specific parts of the boxplot.
Adding Text to Multiple Boxplots
When working with multiple boxplots, you might want to add text to each of them. Here’s how to display text on boxplot in Matplotlib for multiple plots:
import matplotlib.pyplot as plt
import numpy as np

# Generate sample data
data1 = [np.random.normal(0, std, 100) for std in range(1, 4)]
data2 = [np.random.normal(0, std, 100) for std in range(2, 5)]

# Create subplots
fig, (ax1, ax2) = plt.subplots(1, 2, figsize=(15, 6))

# First boxplot
bp1 = ax1.boxplot(data1)
ax1.text(0.5, 4, 'Dataset 1', ha='center', va='bottom')

# Second boxplot
bp2 = ax2.boxplot(data2)
ax2.text(0.5, 6, 'Dataset 2', ha='center', va='bottom')

plt.suptitle('How to display text on boxplot in Matplotlib - Multiple Boxplots')

plt.savefig('how2matplotlib.com_boxplot_text_multiple.png')
plt.show()
Output:
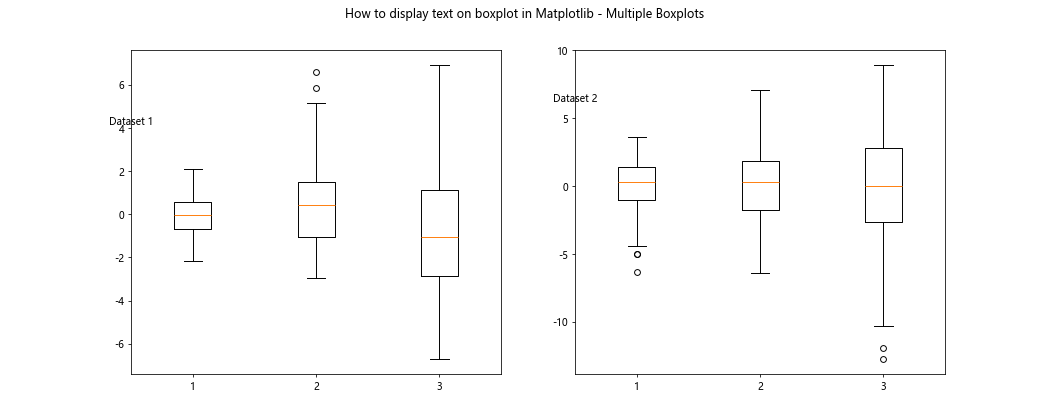
This example demonstrates how to display text on boxplot in Matplotlib when you have multiple boxplots. We create two subplots and add text to each of them independently.
Adding Text Inside Boxplot Boxes
Sometimes, you might want to add text inside the boxes of your boxplot. Here’s how to display text on boxplot in Matplotlib within the boxes:
import matplotlib.pyplot as plt
import numpy as np

# Generate sample data
data = [np.random.normal(0, std, 100) for std in range(1, 4)]

# Create boxplot
fig, ax = plt.subplots(figsize=(10, 6))
bp = ax.boxplot(data)

# Add text inside boxes
for i, box in enumerate(bp['boxes']):
    box_coords = box.get_path().vertices
    y_mean = np.mean([box_coords[0][1], box_coords[2][1]])
    ax.text(i+1, y_mean, f'Box {i+1}', ha='center', va='center')

plt.title('How to display text on boxplot in Matplotlib - Text Inside Boxes')
plt.xlabel('Groups')
plt.ylabel('Values')

plt.savefig('how2matplotlib.com_boxplot_text_inside.png')
plt.show()
Output:
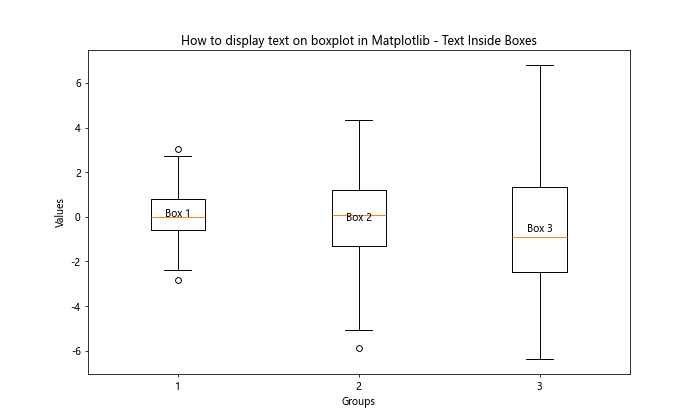
This example shows how to display text on boxplot in Matplotlib by adding text inside the boxes. We calculate the vertical center of each box and place the text there.
Adding Text to Violin Plots
Violin plots are a variation of boxplots that show the probability density of the data. Let’s see how to display text on boxplot in Matplotlib when using violin plots:
import matplotlib.pyplot as plt
import numpy as np

# Generate sample data
data = [np.random.normal(0, std, 1000) for std in range(1, 4)]

# Create violin plot
fig, ax = plt.subplots(figsize=(10, 6))
vp = ax.violinplot(data)

# Add text to violin plots
for i, body in enumerate(vp['bodies']):
    x, y = body.get_paths()[0].vertices.mean(axis=0)
    ax.text(i+1, y, f'Violin {i+1}', ha='center', va='center')

plt.title('How to display text on boxplot in Matplotlib - Violin Plots')
plt.xlabel('Groups')
plt.ylabel('Values')

plt.savefig('how2matplotlib.com_boxplot_text_violin.png')
plt.show()
Output:
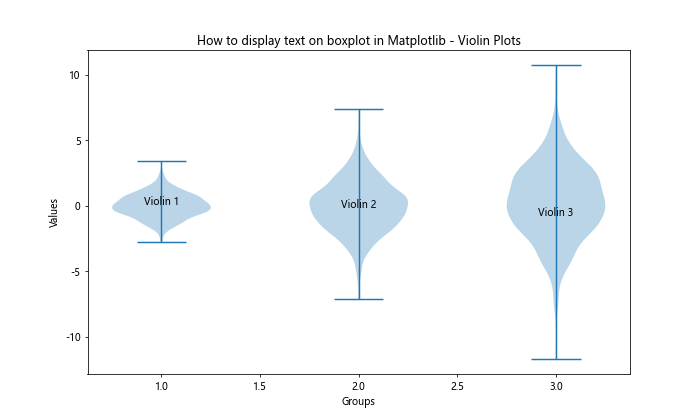
This example demonstrates how to display text on boxplot in Matplotlib when using violin plots. We calculate the center of each violin and place the text there.
Adding Rotated Text to Boxplots
Sometimes, you might need to rotate text to fit it better on your plot. Here’s how to display text on boxplot in Matplotlib with rotated text:
import matplotlib.pyplot as plt
import numpy as np

# Generate sample data
data = [np.random.normal(0, std, 100) for std in range(1, 4)]

# Create boxplot
fig, ax = plt.subplots(figsize=(10, 6))
bp = ax.boxplot(data)

# Add rotated text
for i, median in enumerate(bp['medians']):
    median_val = median.get_ydata()[0]
    ax.text(i+1, median_val, f'Median: {median_val:.2f}',
            ha='right', va='bottom', rotation=45)

plt.title('How to display text on boxplot in Matplotlib - Rotated Text')
plt.xlabel('Groups')
plt.ylabel('Values')

plt.savefig('how2matplotlib.com_boxplot_text_rotated.png')
plt.show()
Output:
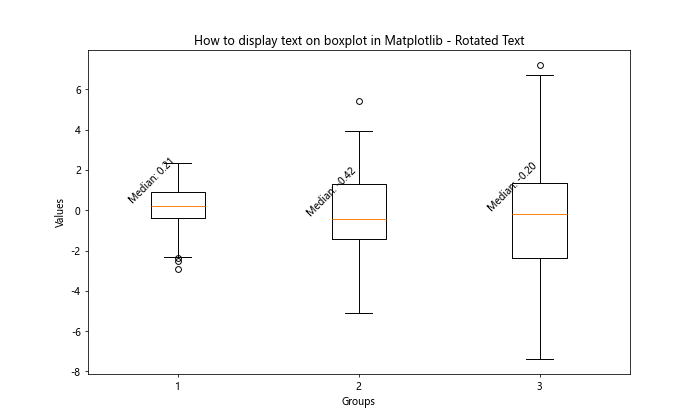
This example shows how to display text on boxplot in Matplotlib using rotated text. We add the median values as before, but this time we rotate the text by 45 degrees.
Adding Text with Background Color
To make your text stand out more, you can add a background color. Here’s how to display text on boxplot in Matplotlib with a colored background:
import matplotlib.pyplot as plt
import numpy as np

# Generate sample data
data = [np.random.normal(0, std, 100) for std in range(1, 4)]

# Create boxplot
fig, ax = plt.subplots(figsize=(10, 6))
bp = ax.boxplot(data)

# Add text with background color
for i, median in enumerate(bp['medians']):
    median_val = median.get_ydata()[0]
    ax.text(i+1, median_val, f'Median: {median_val:.2f}',
            ha='center', va='bottom', bbox=dict(facecolor='yellow', alpha=0.5))

plt.title('How to display text on boxplot in Matplotlib - Text with Background')
plt.xlabel('Groups')
plt.ylabel('Values')

plt.savefig('how2matplotlib.com_boxplot_text_background.png')
plt.show()
Output:
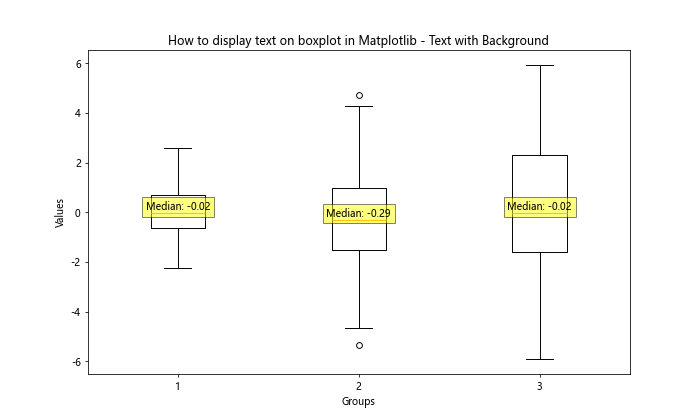
This example demonstrates how to display text on boxplot in Matplotlib with a colored background. We use the bbox parameter to add a yellow background to our text.
Adding Text to Horizontal Boxplots
So far, we’ve been working with vertical boxplots. Let’s see how to display text on boxplot in Matplotlib when using horizontal boxplots:
import matplotlib.pyplot as plt
import numpy as np

# Generate sample data
data = [np.random.normal(0, std, 100) for std in range(1, 4)]

# Create horizontal boxplot
fig, ax = plt.subplots(figsize=(10, 6))
bp = ax.boxplot(data, vert=False)

# Add text to horizontal boxplot
for i, median in enumerate(bp['medians']):
    median_val = median.get_xdata()[0]
    ax.text(median_val, i+1, f'Median: {median_val:.2f}',
            ha='left', va='center')

plt.title('How to display text on boxplot in Matplotlib - Horizontal Boxplot')
plt.ylabel('Groups')
plt.xlabel('Values')

plt.savefig('how2matplotlib.com_boxplot_text_horizontal.png')
plt.show()
Output:
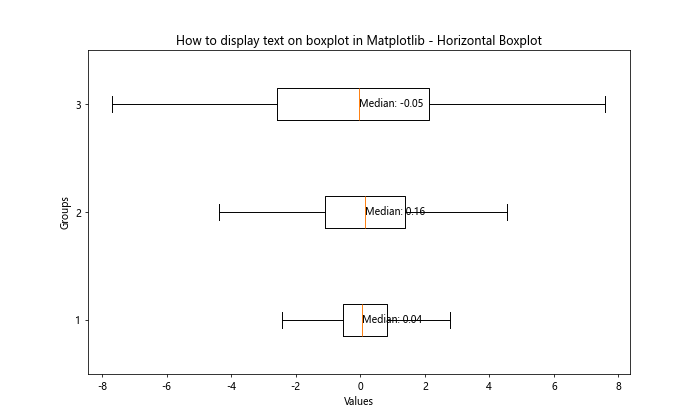
This example shows how to display text on boxplot in Matplotlib when using horizontal boxplots. The main difference is that we use the x-coordinate for positioning the text and adjust the horizontal and vertical alignment accordingly.
Adding Text to Grouped Boxplots
When working with grouped boxplots, you might want to add text to each group. Here’s how to display text on boxplot in Matplotlib for grouped boxplots:
import matplotlib.pyplot as plt
import numpy as np

# Generate sample data
data1 = [np.random.normal(0, std, 100) for std in range(1, 4)]
data2= [np.random.normal(0, std, 100) for std in range(2, 5)]

# Create grouped boxplot
fig, ax = plt.subplots(figsize=(12, 6))
bp = ax.boxplot([data1[i] + data2[i] for i in range(3)], positions=[1, 2, 3], widths=0.6)

# Add text to grouped boxplots
for i in range(3):
    ax.text(i+1, -1, f'Group {i+1}', ha='center', va='top')
    ax.text(i+0.8, 5, 'Data 1', ha='center', va='bottom', color='blue')
    ax.text(i+1.2, 6, 'Data 2', ha='center', va='bottom', color='orange')

plt.title('How to display text on boxplot in Matplotlib - Grouped Boxplots')
plt.xlabel('Groups')
plt.ylabel('Values')

plt.savefig('how2matplotlib.com_boxplot_text_grouped.png')
plt.show()
Output:
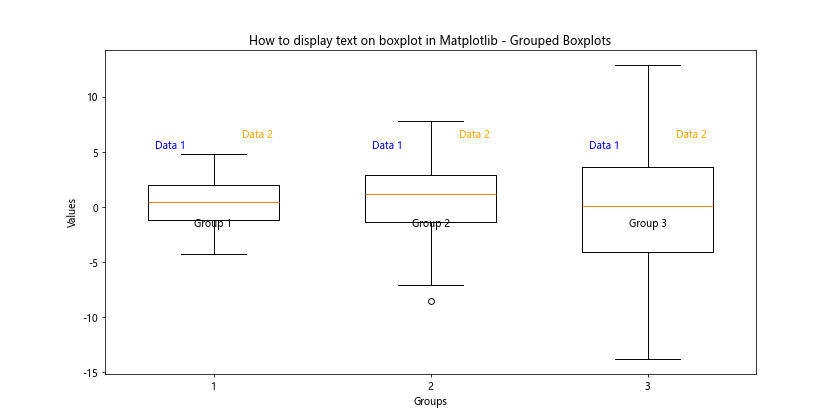
This example demonstrates how to display text on boxplot in Matplotlib for grouped boxplots. We add text below each group to label them, and above each box to identify the dataset.
Adding Text with LaTeX Formatting
For more advanced text formatting, you can use LaTeX in your text. Here’s how to display text on boxplot in Matplotlib using LaTeX:
import matplotlib.pyplot as plt
import numpy as np

# Generate sample data
data = [np.random.normal(0, std, 100) for std in range(1, 4)]

# Create boxplot
fig, ax = plt.subplots(figsize=(10, 6))
bp = ax.boxplot(data)

# Add text with LaTeX formatting
ax.text(1, 4, r'$\bar{x} = \frac{\sum_{i=1}^{n} x_i}{n}$', ha='center', va='bottom')
ax.text(2, 4, r'$\sigma = \sqrt{\frac{\sum_{i=1}^{n} (x_i - \bar{x})^2}{n-1}}$', ha='center', va='bottom')

plt.title('How to display text on boxplot in Matplotlib - LaTeX Formatting')
plt.xlabel('Groups')
plt.ylabel('Values')

plt.savefig('how2matplotlib.com_boxplot_text_latex.png')
plt.show()
Output:
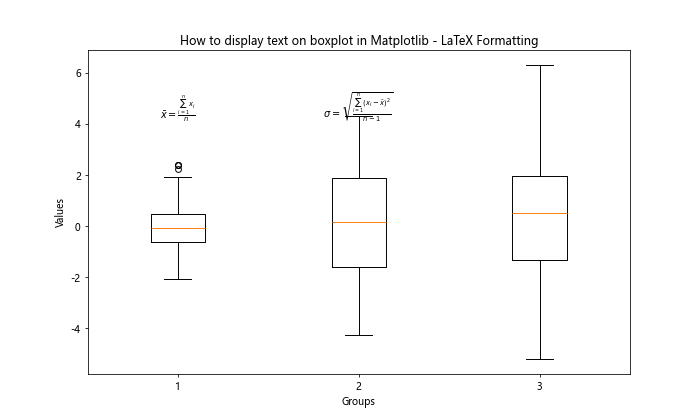
This example shows how to display text on boxplot in Matplotlib using LaTeX formatting. We use the r prefix before the string to treat it as a raw string, and enclose the LaTeX code in dollar signs.
Adding Text with Different Fonts
You can also experiment with different fonts when learning how to display text on boxplot in Matplotlib. Here’s an example:
import matplotlib.pyplot as plt
import numpy as np

# Generate sample data
data = [np.random.normal(0, std, 100) for std in range(1, 4)]

# Create boxplot
fig, ax = plt.subplots(figsize=(10, 6))
bp = ax.boxplot(data)

# Add text with different fonts
ax.text(1, 4, 'Arial Font', fontfamily='sans-serif', fontname='Arial', ha='center', va='bottom')
ax.text(2, 4, 'Times New Roman', fontfamily='serif', fontname='Times New Roman', ha='center', va='bottom')
ax.text(3, 4, 'Courier New', fontfamily='monospace', fontname='Courier New', ha='center', va='bottom')

plt.title('How to display text on boxplot in Matplotlib - Different Fonts')
plt.xlabel('Groups')
plt.ylabel('Values')

plt.savefig('how2matplotlib.com_boxplot_text_fonts.png')
plt.show()
Output:
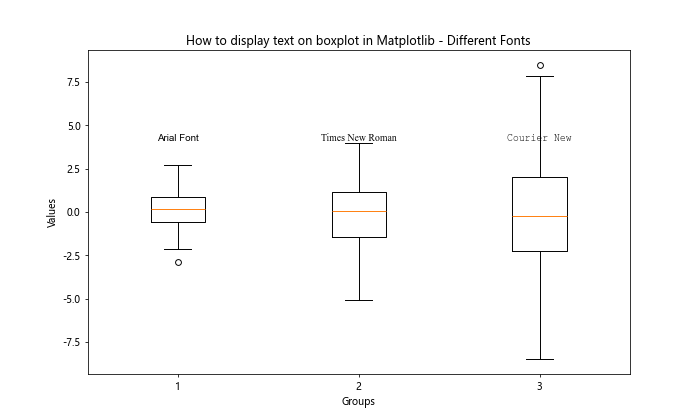
This example demonstrates how to display text on boxplot in Matplotlib using different fonts. We specify the font family and font name for each text element.
Adding Text with Shadows
To make your text stand out even more, you can add shadows. Here’s how to display text on boxplot in Matplotlib with shadowed text:
import matplotlib.pyplot as plt
import numpy as np
from matplotlib.patheffects import withStroke

# Generate sample data
data = [np.random.normal(0, std, 100) for std in range(1, 4)]

# Create boxplot
fig, ax = plt.subplots(figsize=(10, 6))
bp = ax.boxplot(data)

# Add text with shadows
for i, median in enumerate(bp['medians']):
    median_val = median.get_ydata()[0]
    text = ax.text(i+1, median_val, f'Median: {median_val:.2f}',
                   ha='center', va='bottom', fontweight='bold', color='white')
    text.set_path_effects([withStroke(linewidth=3, foreground='black')])

plt.title('How to display text on boxplot in Matplotlib - Shadowed Text')
plt.xlabel('Groups')
plt.ylabel('Values')

plt.savefig('how2matplotlib.com_boxplot_text_shadows.png')
plt.show()
Output:
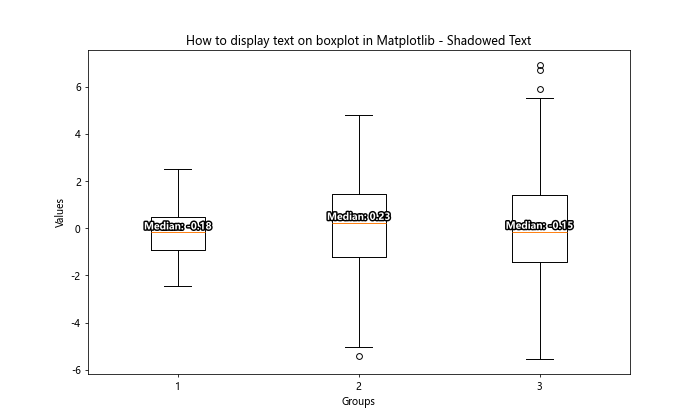
This example shows how to display text on boxplot in Matplotlib with shadowed text. We use the set_path_effects method to add a black stroke around white text, creating a shadow effect.
Conclusion
In this comprehensive guide, we’ve explored numerous ways on how to display text on boxplot in Matplotlib. From basic text placement to advanced techniques like LaTeX formatting and shadowed text, we’ve covered a wide range of options to enhance your boxplots with informative text.
Remember, the key to effective data visualization is not just about adding text, but doing so in a way that enhances understanding without cluttering the plot. As you practice these techniques, you’ll develop a sense for when and how to best use text in your boxplots.
Here are some key takeaways on how to display text on boxplot in Matplotlib:
- Use
ax.text()for basic text placement - Leverage
ax.annotate()for text with arrows - Customize text appearance with parameters like color, font, size, and rotation
- Add background colors or shadows to make text stand out
- Use LaTeX formatting for mathematical expressions
- Experiment with different fonts and styles to match your presentation needs
By mastering these techniques, you’ll be well-equipped to create informative and visually appealing boxplots that effectively communicate your data insights. Remember to always consider your audience and the purpose of your visualization when deciding how to display text on boxplot in Matplotlib.