How to Display the Value of Each Bar in a Bar Chart Using Matplotlib
How to display the value of each bar in a bar chart using Matplotlib is an essential skill for data visualization enthusiasts and professionals alike. This comprehensive guide will walk you through various techniques and best practices to effectively show bar values in Matplotlib charts. We’ll cover everything from basic implementations to advanced customization options, ensuring you have a thorough understanding of how to display the value of each bar in a bar chart using Matplotlib.
Understanding the Basics of Bar Charts in Matplotlib
Before diving into how to display the value of each bar in a bar chart using Matplotlib, it’s crucial to understand the fundamentals of creating bar charts. Matplotlib is a powerful Python library for creating static, animated, and interactive visualizations. Bar charts are one of the most common types of plots used to represent categorical data.
Let’s start with a simple example of how to create a basic bar chart using Matplotlib:
import matplotlib.pyplot as plt

categories = ['Category A', 'Category B', 'Category C', 'Category D']
values = [25, 40, 30, 55]

plt.figure(figsize=(10, 6))
plt.bar(categories, values)
plt.title('Basic Bar Chart - How to display the value of each bar in a bar chart using Matplotlib')
plt.xlabel('Categories')
plt.ylabel('Values')
plt.show()
Output:
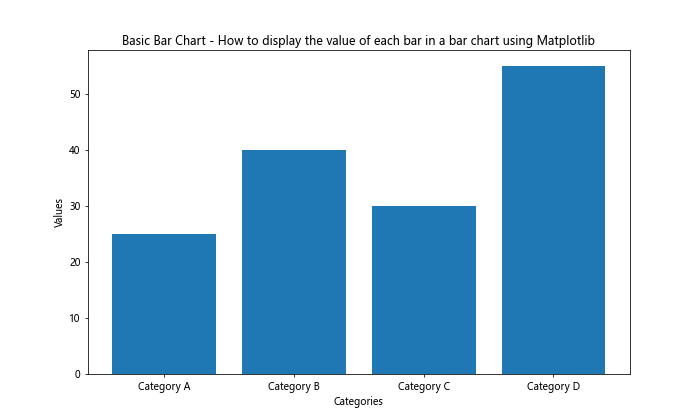
In this example, we create a simple bar chart with four categories and their corresponding values. However, the actual values are not displayed on the bars themselves. Let’s explore how to display the value of each bar in a bar chart using Matplotlib.
Method 1: Using plt.text() to Display Bar Values
One of the simplest ways to display the value of each bar in a bar chart using Matplotlib is by utilizing the plt.text() function. This method allows you to add text annotations to your plot at specific coordinates.
Here’s an example of how to implement this method:
import matplotlib.pyplot as plt

categories = ['Category A', 'Category B', 'Category C', 'Category D']
values = [25, 40, 30, 55]

plt.figure(figsize=(10, 6))
bars = plt.bar(categories, values)

for bar in bars:
    height = bar.get_height()
    plt.text(bar.get_x() + bar.get_width()/2, height, f'{height}',
             ha='center', va='bottom')

plt.title('Bar Chart with Values - How to display the value of each bar in a bar chart using Matplotlib')
plt.xlabel('Categories')
plt.ylabel('Values')
plt.show()
Output:
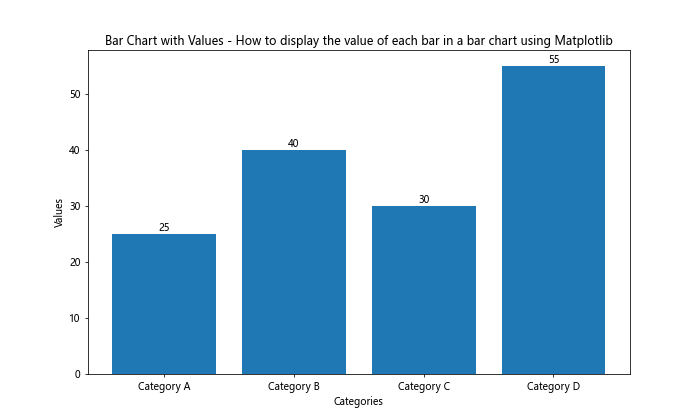
In this example, we iterate through each bar in the chart and use plt.text() to add the value above each bar. The ha='center' and va='bottom' parameters ensure that the text is centered horizontally and aligned to the bottom of the text box.
Method 2: Using ax.bar_label() for Automatic Bar Labeling
Matplotlib version 3.4.0 introduced a new method called bar_label(), which simplifies the process of adding labels to bars. This method is particularly useful when learning how to display the value of each bar in a bar chart using Matplotlib.
Here’s an example of how to use ax.bar_label():
import matplotlib.pyplot as plt

categories = ['Category A', 'Category B', 'Category C', 'Category D']
values = [25, 40, 30, 55]

fig, ax = plt.subplots(figsize=(10, 6))
bars = ax.bar(categories, values)

ax.bar_label(bars)

ax.set_title('Bar Chart with Labels - How to display the value of each bar in a bar chart using Matplotlib')
ax.set_xlabel('Categories')
ax.set_ylabel('Values')
plt.show()
Output:
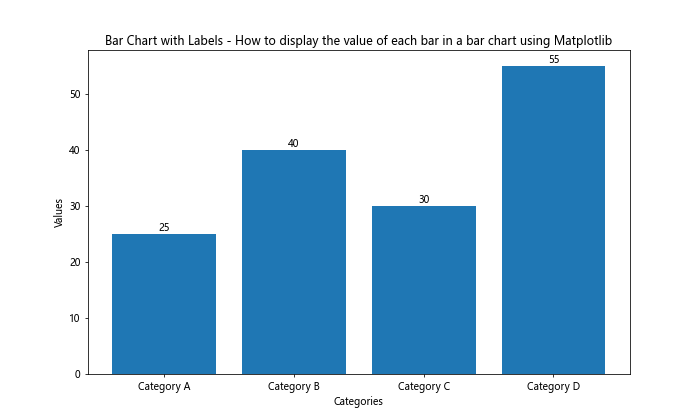
This method automatically adds labels to the bars without the need for manual positioning. It’s a more concise and efficient way to display the value of each bar in a bar chart using Matplotlib.
Customizing Bar Value Display
Now that we’ve covered the basics of how to display the value of each bar in a bar chart using Matplotlib, let’s explore some customization options to enhance the visual appeal and readability of your charts.
Adjusting Label Position
You can adjust the position of the labels to better fit your data and chart layout. Here’s an example of how to display the value of each bar in a bar chart using Matplotlib with custom label positions:
import matplotlib.pyplot as plt

categories = ['Category A', 'Category B', 'Category C', 'Category D']
values = [25, 40, 30, 55]

fig, ax = plt.subplots(figsize=(10, 6))
bars = ax.bar(categories, values)

ax.bar_label(bars, padding=3, label_type='edge')

ax.set_title('Bar Chart with Custom Label Position - How to display the value of each bar in a bar chart using Matplotlib')
ax.set_xlabel('Categories')
ax.set_ylabel('Values')
plt.show()
Output:
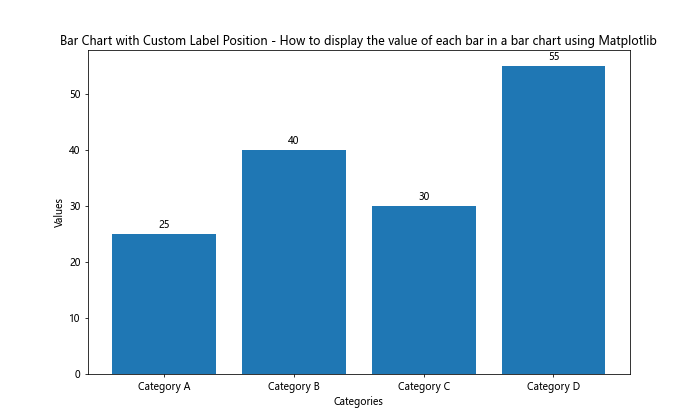
In this example, we use the padding parameter to adjust the distance between the bar and the label, and label_type='edge' to position the labels at the top edge of the bars.
Formatting Label Text
When learning how to display the value of each bar in a bar chart using Matplotlib, it’s important to consider label formatting. You can customize the appearance of the labels to match your chart’s style or to display the values in a specific format.
Here’s an example of how to format the labels:
import matplotlib.pyplot as plt

categories = ['Category A', 'Category B', 'Category C', 'Category D']
values = [25.5, 40.2, 30.7, 55.1]

fig, ax = plt.subplots(figsize=(10, 6))
bars = ax.bar(categories, values)

ax.bar_label(bars, fmt='%.1f', padding=3)

ax.set_title('Bar Chart with Formatted Labels - How to display the value of each bar in a bar chart using Matplotlib')
ax.set_xlabel('Categories')
ax.set_ylabel('Values')
plt.show()
Output:
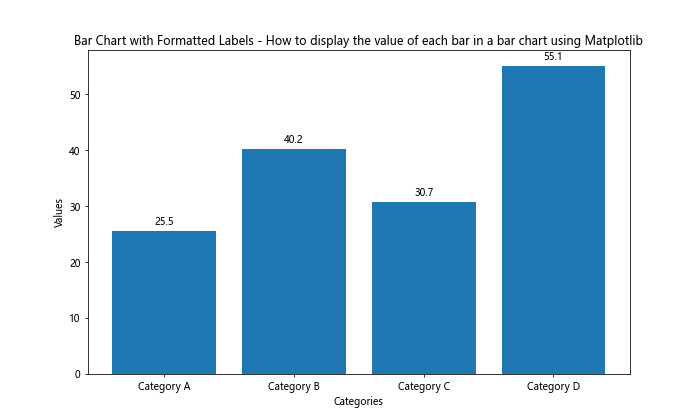
In this example, we use the fmt='%.1f' parameter to display the values with one decimal place.
Handling Negative Values
When learning how to display the value of each bar in a bar chart using Matplotlib, it’s important to consider how to handle negative values. Negative values require special attention to ensure that the labels are positioned correctly and remain readable.
Here’s an example of how to display the value of each bar in a bar chart using Matplotlib when dealing with negative values:
import matplotlib.pyplot as plt

categories = ['Category A', 'Category B', 'Category C', 'Category D']
values = [25, -40, 30, -55]

fig, ax = plt.subplots(figsize=(10, 6))
bars = ax.bar(categories, values)

ax.bar_label(bars, padding=3, label_type='center')

ax.set_title('Bar Chart with Negative Values - How to display the value of each bar in a bar chart using Matplotlib')
ax.set_xlabel('Categories')
ax.set_ylabel('Values')
ax.axhline(y=0, color='k', linestyle='-', linewidth=0.5)
plt.show()
Output:
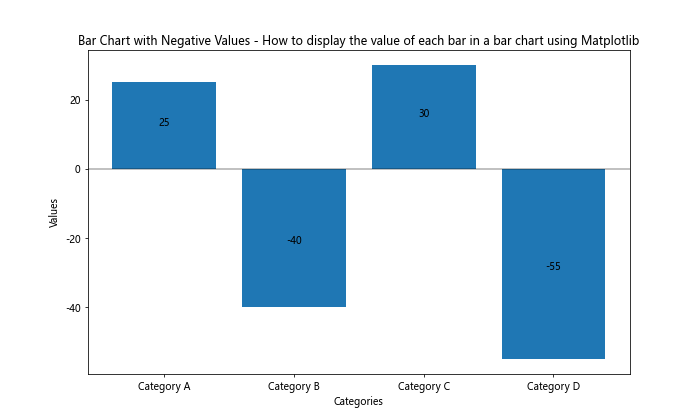
In this example, we use label_type='center' to position the labels at the center of each bar, which works well for both positive and negative values. We also add a horizontal line at y=0 to clearly separate positive and negative values.
Displaying Percentages
Sometimes, you may want to display percentages instead of absolute values when learning how to display the value of each bar in a bar chart using Matplotlib. This can be particularly useful for showing proportions or distributions.
Here’s an example of how to display percentages on a bar chart:
import matplotlib.pyplot as plt

categories = ['Category A', 'Category B', 'Category C', 'Category D']
values = [25, 40, 30, 55]
total = sum(values)
percentages = [value / total * 100 for value in values]

fig, ax = plt.subplots(figsize=(10, 6))
bars = ax.bar(categories, percentages)

ax.bar_label(bars, fmt='%.1f%%', padding=3)

ax.set_title('Bar Chart with Percentages - How to display the value of each bar in a bar chart using Matplotlib')
ax.set_xlabel('Categories')
ax.set_ylabel('Percentage')
ax.set_ylim(0, 100)
plt.show()
Output:
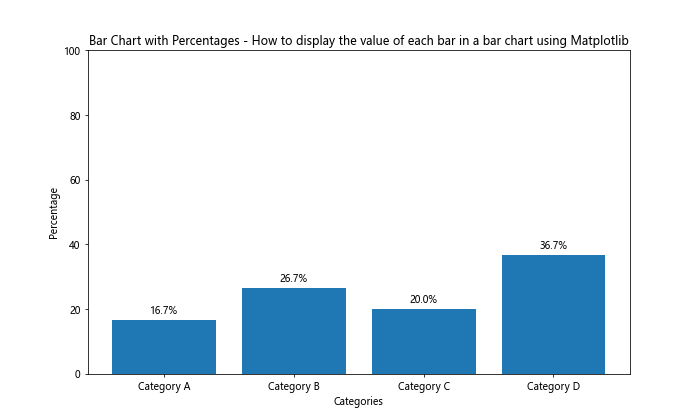
In this example, we convert the values to percentages and use fmt='%.1f%%' to display them with one decimal place and a percentage sign.
Handling Long Labels
When learning how to display the value of each bar in a bar chart using Matplotlib, you may encounter situations where the category labels are too long to fit comfortably on the x-axis. In such cases, you can rotate the labels or use text wrapping to improve readability.
Here’s an example of how to handle long labels:
import matplotlib.pyplot as plt
import textwrap

categories = ['Very Long Category A', 'Extremely Long Category B', 'Incredibly Long Category C', 'Unbelievably Long Category D']
values = [25, 40, 30, 55]

fig, ax = plt.subplots(figsize=(12, 6))
bars = ax.bar(categories, values)

ax.bar_label(bars, padding=3)

ax.set_title('Bar Chart with Long Labels - How to display the value of each bar in a bar chart using Matplotlib')
ax.set_xlabel('Categories')
ax.set_ylabel('Values')

# Wrap long labels
wrapped_labels = [textwrap.fill(label, 15) for label in categories]
ax.set_xticklabels(wrapped_labels, rotation=45, ha='right')

plt.tight_layout()
plt.show()
Output:
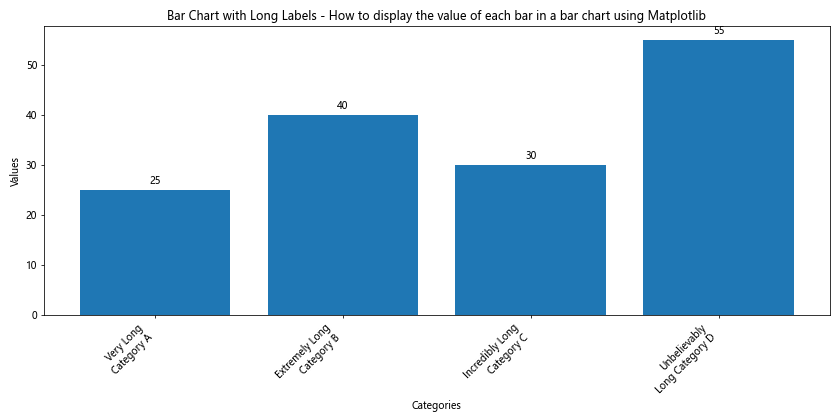
In this example, we use the textwrap module to wrap long labels and rotate them 45 degrees for better readability.
Stacked Bar Charts
Stacked bar charts present a unique challenge when learning how to display the value of each bar in a bar chart using Matplotlib. In these charts, you may want to display values for each segment of the stacked bar.
Here’s an example of how to display values in a stacked bar chart:
import matplotlib.pyplot as plt
import numpy as np

categories = ['Category A', 'Category B', 'Category C', 'Category D']
values1 = [25, 40, 30, 55]
values2 = [15, 25, 20, 30]
values3 = [10, 15, 25, 20]

fig, ax = plt.subplots(figsize=(10, 6))
bars1 = ax.bar(categories, values1, label='Group 1')
bars2 = ax.bar(categories, values2, bottom=values1, label='Group 2')
bars3 = ax.bar(categories, values3, bottom=np.array(values1) + np.array(values2), label='Group 3')

ax.bar_label(bars1, label_type='center')
ax.bar_label(bars2, label_type='center')
ax.bar_label(bars3, label_type='center')

ax.set_title('Stacked Bar Chart with Values - How to display the value of each bar in a bar chart using Matplotlib')
ax.set_xlabel('Categories')
ax.set_ylabel('Values')
ax.legend()

plt.tight_layout()
plt.show()
Output:
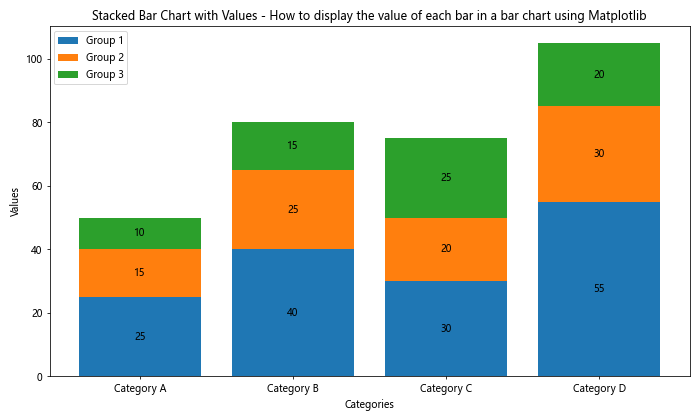
In this example, we create a stacked bar chart and use ax.bar_label() with label_type='center' to display the value of each segment in the center of its respective bar.
Horizontal Bar Charts
Horizontal bar charts can be a great alternative to vertical bar charts, especially when dealing with long category names. When learning how to display the value of each bar in a bar chart using Matplotlib, it’s important to know how to handle horizontal bar charts as well.
Here’s an example of how to create a horizontal bar chart with displayed values:
import matplotlib.pyplot as plt

categories = ['Very Long Category A', 'Extremely Long Category B', 'Incredibly Long Category C', 'Unbelievably Long Category D']
values = [25, 40, 30, 55]

fig, ax = plt.subplots(figsize=(10, 6))
bars = ax.barh(categories, values)

ax.bar_label(bars, padding=3)

ax.set_title('Horizontal Bar Chart with Values - How to display the value of each bar in a bar chart using Matplotlib')
ax.set_ylabel('Categories')
ax.set_xlabel('Values')

plt.tight_layout()
plt.show()
Output:
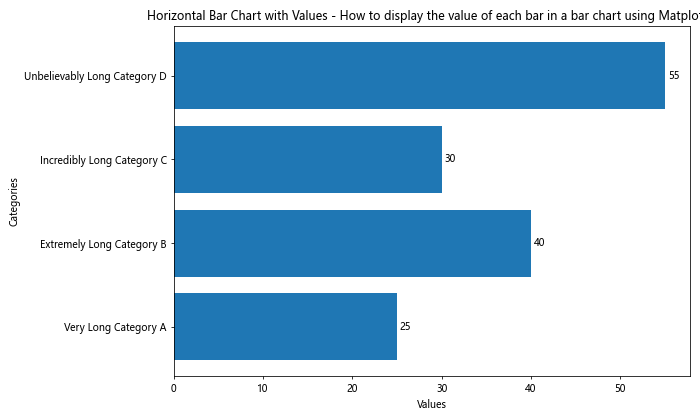
In this example, we use ax.barh() to create horizontal bars and ax.bar_label() to display the values at the end of each bar.
Customizing Label Appearance
When learning how to display the value of each bar in a bar chart using Matplotlib, you may want to customize the appearance of the labels to match your chart’s style or to emphasize certain values.
Here’s an example of how to customize label appearance:
import matplotlib.pyplot as plt

categories = ['Category A', 'Category B', 'Category C', 'Category D']
values = [25, 40, 30, 55]

fig, ax = plt.subplots(figsize=(10, 6))
bars = ax.bar(categories, values)

ax.bar_label(bars, padding=3, fontweight='bold', fontsize=12, color='red')

ax.set_title('Bar Chart with Custom Labels - How to display the value of each bar in a bar chart using Matplotlib')
ax.set_xlabel('Categories')
ax.set_ylabel('Values')

plt.show()
Output:
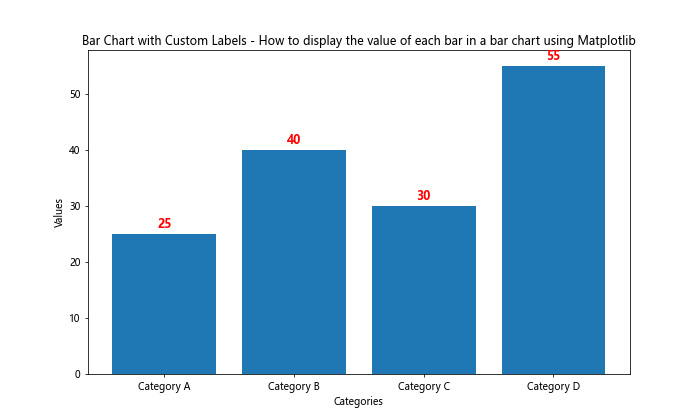
In this example, we customize the labels by changing their font weight, size, and color.
Displaying Multiple Values
Sometimes, you may want to display multiple values for each bar when learning how to display the value of each bar in a bar chart using Matplotlib. This can be useful for showing additional information or context for each category.
Here’s an example of how to display multiple values for each bar:
import matplotlib.pyplot as plt

categories = ['Category A', 'Category B', 'Category C', 'Category D']
values1 = [25, 40, 30, 55]
values2 = [20, 35, 25, 50]

fig, ax = plt.subplots(figsize=(10, 6))
bars = ax.bar(categories, values1)

for i, (v1, v2) in enumerate(zip(values1, values2)):
    ax.text(i, v1, f'{v1}\n({v2})', ha='center', va='bottom')

ax.set_title('Bar Chart with Multiple Values - How to display the value of each bar in a bar chart using Matplotlib')
ax.set_xlabel('Categories')
ax.set_ylabel('Values')

plt.show()
Output:
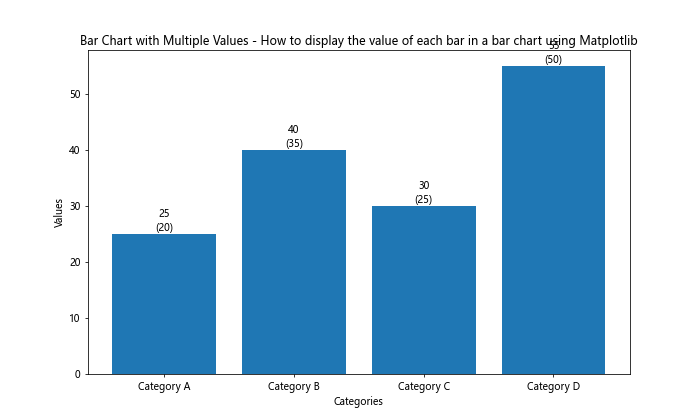
In this example, we display two values for each bar: the main value and a secondary value in parentheses.
Handling Large Datasets
When dealing with large datasets, displaying the value of each bar in abar chart using Matplotlib can become challenging due to space constraints and potential visual clutter. Here are some strategies to handle large datasets effectively:
Using a Threshold for Label Display
When learning how to display the value of each bar in a bar chart using Matplotlib for large datasets, you can set a threshold to only display labels for bars that meet certain criteria. This helps reduce clutter while still highlighting important values.
Here’s an example:
import matplotlib.pyplot as plt
import numpy as np

categories = [f'Category {i}' for i in range(20)]
values = np.random.randint(10, 100, 20)

fig, ax = plt.subplots(figsize=(12, 6))
bars = ax.bar(categories, values)

threshold = np.mean(values)
for bar in bars:
    height = bar.get_height()
    if height >= threshold:
        ax.text(bar.get_x() + bar.get_width()/2, height, f'{height}',
                ha='center', va='bottom')

ax.set_title('Bar Chart with Threshold Labels - How to display the value of each bar in a bar chart using Matplotlib')
ax.set_xlabel('Categories')
ax.set_ylabel('Values')
plt.xticks(rotation=45, ha='right')
plt.tight_layout()
plt.show()
Output:
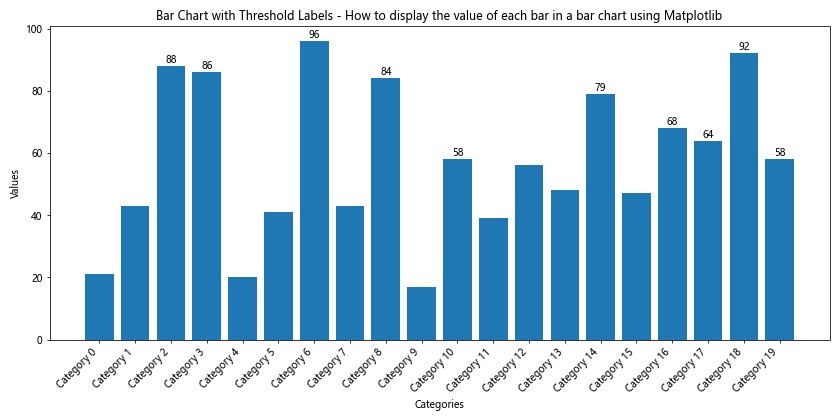
In this example, we only display labels for bars that have values greater than or equal to the mean of all values.
Using Annotations for Selected Bars
Another approach when learning how to display the value of each bar in a bar chart using Matplotlib for large datasets is to use annotations for selected bars of interest. This allows you to highlight specific data points without overwhelming the chart.
Here’s an example:
import matplotlib.pyplot as plt
import numpy as np

categories = [f'Category {i}' for i in range(30)]
values = np.random.randint(10, 100, 30)

fig, ax = plt.subplots(figsize=(15, 6))
bars = ax.bar(categories, values)

# Highlight top 3 values
top_indices = np.argsort(values)[-3:]
for idx in top_indices:
    height = values[idx]
    ax.annotate(f'{height}',
                xy=(idx, height),
                xytext=(0, 5),
                textcoords="offset points",
                ha='center', va='bottom',
                bbox=dict(boxstyle="round,pad=0.3", fc="yellow", ec="b", lw=1, alpha=0.8))

ax.set_title('Bar Chart with Annotated Top Values - How to display the value of each bar in a bar chart using Matplotlib')
ax.set_xlabel('Categories')
ax.set_ylabel('Values')
plt.xticks(rotation=90)
plt.tight_layout()
plt.show()
Output:
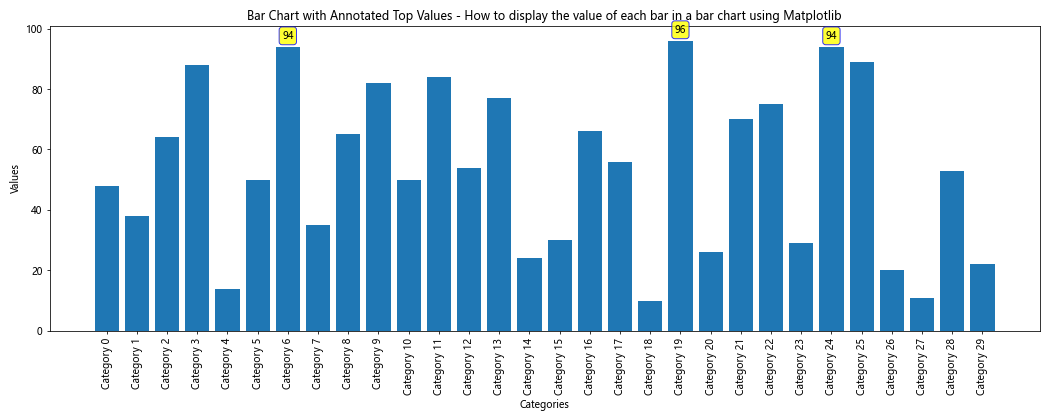
In this example, we annotate only the top 3 values in the dataset, making them stand out from the rest.
Interactive Bar Charts with Hover Labels
When learning how to display the value of each bar in a bar chart using Matplotlib, you might want to create interactive charts where values are displayed when hovering over the bars. While Matplotlib itself doesn’t support interactivity, you can use libraries like Plotly or Bokeh that build on top of Matplotlib to achieve this.
Here’s an example using Plotly:
import plotly.graph_objects as go

categories = ['Category A', 'Category B', 'Category C', 'Category D']
values = [25, 40, 30, 55]

fig = go.Figure(data=[go.Bar(
    x=categories,
    y=values,
    text=values,
    hoverinfo='text',
    hovertext=[f'Value: {v}
Category: {c}' for v, c in zip(values, categories)]
)])

fig.update_layout(
    title='Interactive Bar Chart - How to display the value of each bar in a bar chart using Matplotlib',
    xaxis_title='Categories',
    yaxis_title='Values'
)

fig.write_html('how2matplotlib.com_interactive_bar_chart.html')
This example creates an interactive HTML file where the values are displayed when hovering over the bars.
Combining Bar Charts with Other Plot Types
When learning how to display the value of each bar in a bar chart using Matplotlib, you might want to combine bar charts with other plot types to create more complex visualizations. This can provide additional context or highlight trends in your data.
Here’s an example that combines a bar chart with a line plot:
import matplotlib.pyplot as plt

categories = ['Category A', 'Category B', 'Category C', 'Category D']
bar_values = [25, 40, 30, 55]
line_values = [20, 35, 45, 50]

fig, ax1 = plt.subplots(figsize=(10, 6))

# Bar chart
bars = ax1.bar(categories, bar_values, alpha=0.7)
ax1.set_xlabel('Categories')
ax1.set_ylabel('Bar Values', color='b')
ax1.tick_params(axis='y', labelcolor='b')

# Display bar values
ax1.bar_label(bars, padding=3)

# Line plot
ax2 = ax1.twinx()
ax2.plot(categories, line_values, color='r', marker='o')
ax2.set_ylabel('Line Values', color='r')
ax2.tick_params(axis='y', labelcolor='r')

# Display line values
for i, v in enumerate(line_values):
    ax2.text(i, v, f'{v}', ha='center', va='bottom', color='r')

plt.title('Combined Bar and Line Chart - How to display the value of each bar in a bar chart using Matplotlib')
plt.tight_layout()
plt.show()
Output:
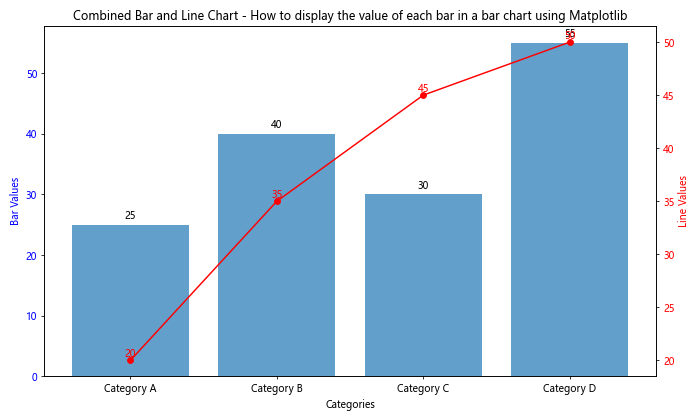
This example shows how to display values for both the bar chart and the line plot in a combined visualization.
Best Practices for Displaying Bar Values
When learning how to display the value of each bar in a bar chart using Matplotlib, it’s important to follow some best practices to ensure your visualizations are clear, informative, and visually appealing. Here are some tips to keep in mind:
- Avoid Overcrowding: If you have many bars, consider displaying values only for the most important ones or using interactive techniques.
Use Consistent Formatting: Keep the format of your labels consistent throughout the chart.
Consider Color Contrast: Ensure that the label color contrasts well with the bar color and background for readability.
Adjust Font Size: Use an appropriate font size that’s readable but doesn’t overpower the chart.
Position Labels Carefully: Place labels where they don’t overlap with other elements of the chart.
Use Abbreviations: For large numbers, consider using abbreviations (e.g., 1M instead of 1,000,000) to save space.
Provide Context: If necessary, include units or additional information in your labels.
Be Consistent with Decimal Places: Use the same number of decimal places for all values to maintain consistency.
Troubleshooting Common Issues
When learning how to display the value of each bar in a bar chart using Matplotlib, you might encounter some common issues. Here are a few problems and their solutions: