How to Display Multiple Images in One Figure Correctly in Matplotlib
How to display multiple images in one figure correctly in Matplotlib is an essential skill for data visualization and image processing tasks. This comprehensive guide will walk you through various techniques and best practices for creating multi-image figures using Matplotlib. We’ll cover everything from basic concepts to advanced techniques, providing you with the knowledge and tools to effectively display multiple images in a single figure.
Understanding the Basics of Displaying Multiple Images in Matplotlib
Before diving into the specifics of how to display multiple images in one figure correctly in Matplotlib, it’s important to understand the fundamental concepts. Matplotlib is a powerful plotting library for Python that allows you to create a wide range of visualizations, including multi-image figures.
When working with multiple images in Matplotlib, you’ll typically use the subplot function or the add_subplot method of a figure object. These tools allow you to create a grid of subplots within a single figure, where each subplot can contain an individual image.
Let’s start with a simple example of how to display multiple images in one figure correctly in Matplotlib:
import matplotlib.pyplot as plt
import numpy as np

# Create sample images
image1 = np.random.rand(10, 10)
image2 = np.random.rand(10, 10)

# Create a figure with two subplots
fig, (ax1, ax2) = plt.subplots(1, 2, figsize=(10, 5))

# Display images in subplots
ax1.imshow(image1, cmap='viridis')
ax1.set_title('Image 1 - how2matplotlib.com')
ax2.imshow(image2, cmap='plasma')
ax2.set_title('Image 2 - how2matplotlib.com')

plt.tight_layout()
plt.show()
Output:
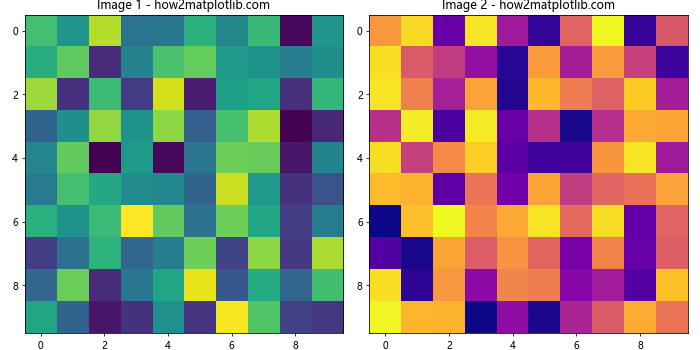
In this example, we create two random images using NumPy and display them side by side in a single figure. The subplots function creates a figure with two axes, and we use the imshow function to display each image in its respective subplot.
Creating a Grid of Images in Matplotlib
When learning how to display multiple images in one figure correctly in Matplotlib, you’ll often need to create a grid of images. This is particularly useful when you want to compare multiple images or display a series of related visualizations.
Here’s an example of how to create a 2×2 grid of images:
import matplotlib.pyplot as plt
import numpy as np

# Create sample images
images = [np.random.rand(10, 10) for _ in range(4)]

# Create a 2x2 grid of subplots
fig, axes = plt.subplots(2, 2, figsize=(10, 10))

# Flatten the axes array for easier iteration
axes_flat = axes.flatten()

# Display images in subplots
for i, ax in enumerate(axes_flat):
    ax.imshow(images[i], cmap='viridis')
    ax.set_title(f'Image {i+1} - how2matplotlib.com')

plt.tight_layout()
plt.show()
Output:
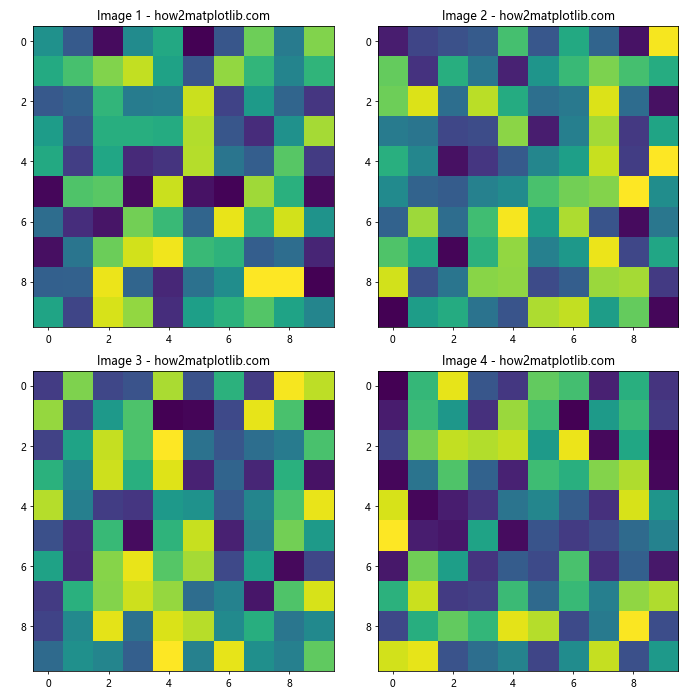
In this example, we create four random images and display them in a 2×2 grid. The subplots function creates a figure with a 2×2 grid of axes, and we use a loop to display each image in its respective subplot.
Adjusting Subplot Sizes and Spacing
When displaying multiple images in one figure correctly in Matplotlib, you may need to adjust the size and spacing of subplots to achieve the desired layout. Matplotlib provides several parameters and functions to help you fine-tune your multi-image figures.
Here’s an example demonstrating how to adjust subplot sizes and spacing:
import matplotlib.pyplot as plt
import numpy as np

# Create sample images
images = [np.random.rand(10, 10) for _ in range(4)]

# Create a figure with custom subplot sizes and spacing
fig = plt.figure(figsize=(12, 8))
gs = fig.add_gridspec(2, 2, width_ratios=[1, 1.5], height_ratios=[1, 1.5], hspace=0.3, wspace=0.3)

# Display images in subplots
for i, (row, col) in enumerate([(0, 0), (0, 1), (1, 0), (1, 1)]):
    ax = fig.add_subplot(gs[row, col])
    ax.imshow(images[i], cmap='viridis')
    ax.set_title(f'Image {i+1} - how2matplotlib.com')

plt.show()
Output:
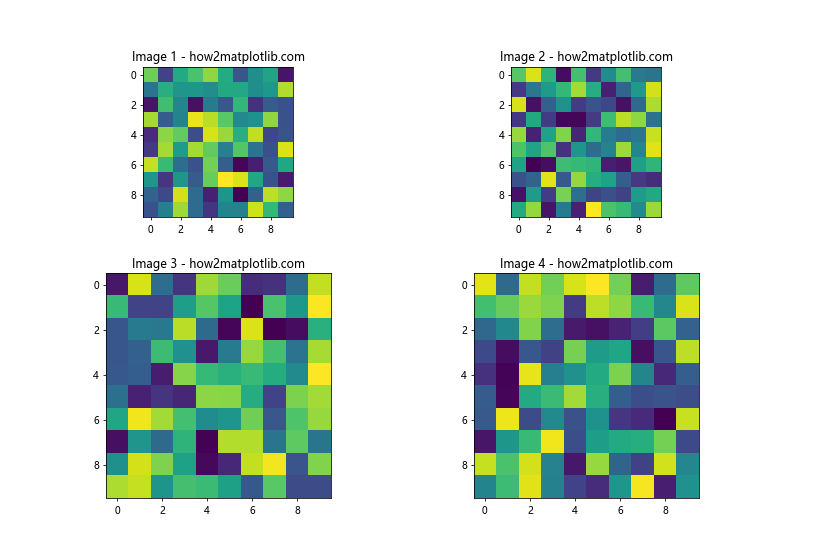
In this example, we use GridSpec to create a custom grid with different width and height ratios for the subplots. We also adjust the horizontal and vertical spacing between subplots using the hspace and wspace parameters.
Adding Colorbars to Multiple Images
When displaying multiple images in one figure correctly in Matplotlib, you may want to include colorbars to show the range of values in each image. Here’s an example of how to add colorbars to multiple images:
import matplotlib.pyplot as plt
import numpy as np

# Create sample images
images = [np.random.rand(10, 10) for _ in range(4)]

# Create a 2x2 grid of subplots
fig, axes = plt.subplots(2, 2, figsize=(12, 10))

# Flatten the axes array for easier iteration
axes_flat = axes.flatten()

# Display images in subplots with colorbars
for i, ax in enumerate(axes_flat):
    im = ax.imshow(images[i], cmap='viridis')
    ax.set_title(f'Image {i+1} - how2matplotlib.com')
    fig.colorbar(im, ax=ax, orientation='vertical', fraction=0.046, pad=0.04)

plt.tight_layout()
plt.show()
Output:
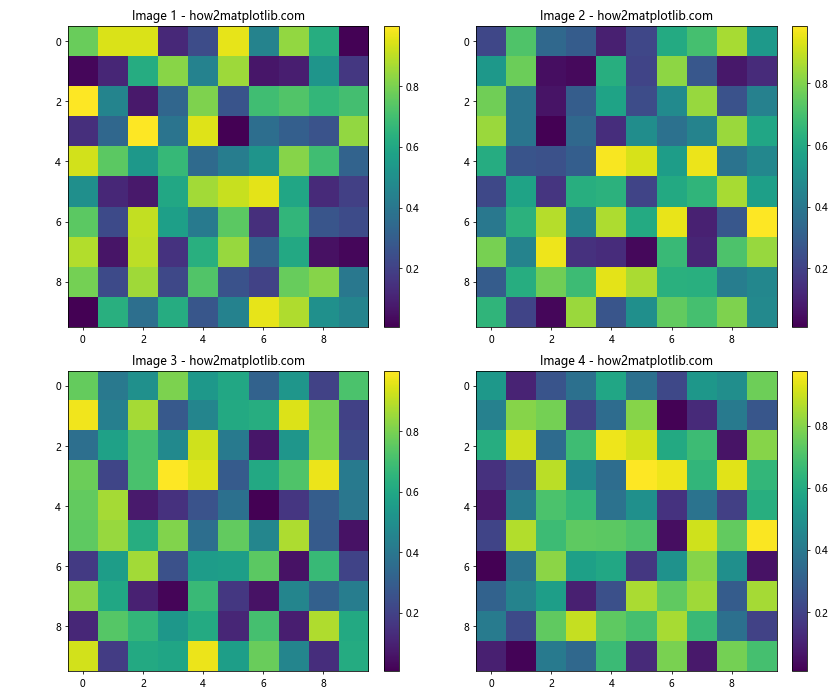
In this example, we add a colorbar to each subplot using the colorbar function. The fraction and pad parameters control the size and position of the colorbar relative to the subplot.
Displaying Images with Different Sizes
When learning how to display multiple images in one figure correctly in Matplotlib, you may encounter situations where you need to display images with different sizes. Here’s an example of how to handle this scenario:
import matplotlib.pyplot as plt
import numpy as np

# Create sample images with different sizes
image1 = np.random.rand(10, 10)
image2 = np.random.rand(15, 20)
image3 = np.random.rand(8, 12)

# Create a figure with subplots
fig, (ax1, ax2, ax3) = plt.subplots(1, 3, figsize=(15, 5))

# Display images in subplots
ax1.imshow(image1, cmap='viridis')
ax1.set_title('Image 1 (10x10) - how2matplotlib.com')
ax2.imshow(image2, cmap='plasma')
ax2.set_title('Image 2 (15x20) - how2matplotlib.com')
ax3.imshow(image3, cmap='inferno')
ax3.set_title('Image 3 (8x12) - how2matplotlib.com')

# Remove axis ticks
for ax in (ax1, ax2, ax3):
    ax.set_xticks([])
    ax.set_yticks([])

plt.tight_layout()
plt.show()
Output:

In this example, we create three images with different sizes and display them in separate subplots. Matplotlib automatically adjusts the display of each image to fit within its subplot while maintaining the correct aspect ratio.
Adding Annotations to Multiple Images
When displaying multiple images in one figure correctly in Matplotlib, you may want to add annotations to highlight specific features or provide additional information. Here’s an example of how to add annotations to multiple images:
import matplotlib.pyplot as plt
import numpy as np

# Create sample images
images = [np.random.rand(10, 10) for _ in range(4)]

# Create a 2x2 grid of subplots
fig, axes = plt.subplots(2, 2, figsize=(12, 10))

# Flatten the axes array for easier iteration
axes_flat = axes.flatten()

# Display images in subplots with annotations
for i, ax in enumerate(axes_flat):
    im = ax.imshow(images[i], cmap='viridis')
    ax.set_title(f'Image {i+1} - how2matplotlib.com')

    # Add annotation
    ax.annotate(f'Peak: {images[i].max():.2f}', xy=(0.05, 0.95), xycoords='axes fraction',
                color='white', fontweight='bold', va='top')

plt.tight_layout()
plt.show()
Output:
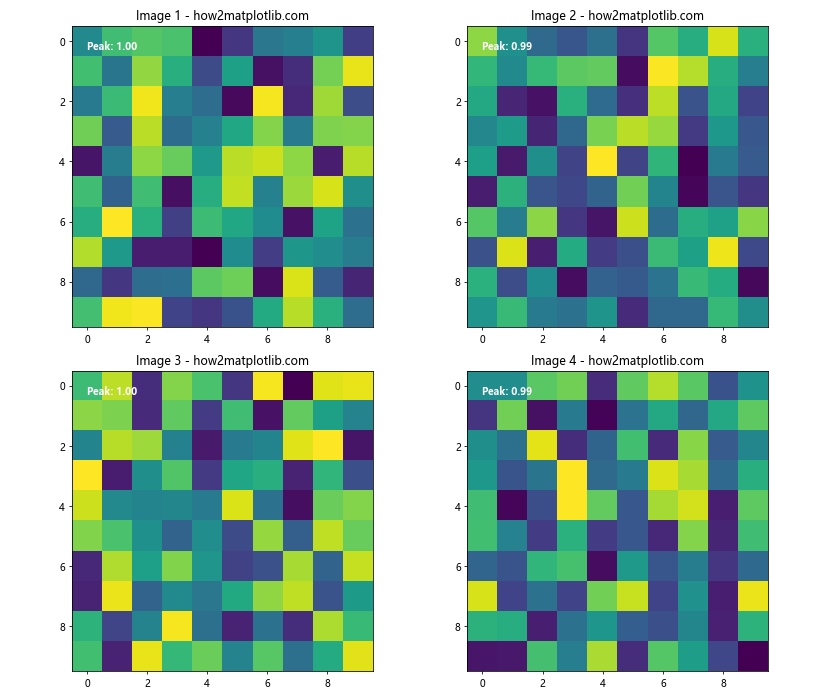
In this example, we add an annotation to each subplot showing the peak value of the corresponding image. The annotate function is used to place text at a specific position within each subplot.
Customizing Axes and Titles for Multiple Images
When learning how to display multiple images in one figure correctly in Matplotlib, it’s important to know how to customize axes and titles to enhance the presentation of your multi-image figures. Here’s an example demonstrating various customization options:
import matplotlib.pyplot as plt
import numpy as np

# Create sample images
images = [np.random.rand(10, 10) for _ in range(4)]

# Create a 2x2 grid of subplots
fig, axes = plt.subplots(2, 2, figsize=(12, 10))

# Flatten the axes array for easier iteration
axes_flat = axes.flatten()

# Display images in subplots with customized axes and titles
for i, ax in enumerate(axes_flat):
    im = ax.imshow(images[i], cmap='viridis')
    ax.set_title(f'Image {i+1} - how2matplotlib.com', fontsize=14, fontweight='bold')

    # Customize axes
    ax.set_xlabel('X-axis', fontsize=12)
    ax.set_ylabel('Y-axis', fontsize=12)
    ax.tick_params(axis='both', which='major', labelsize=10)

    # Add a colorbar
    cbar = fig.colorbar(im, ax=ax, orientation='vertical', fraction=0.046, pad=0.04)
    cbar.set_label('Intensity', fontsize=12)

plt.tight_layout()
plt.show()
Output:
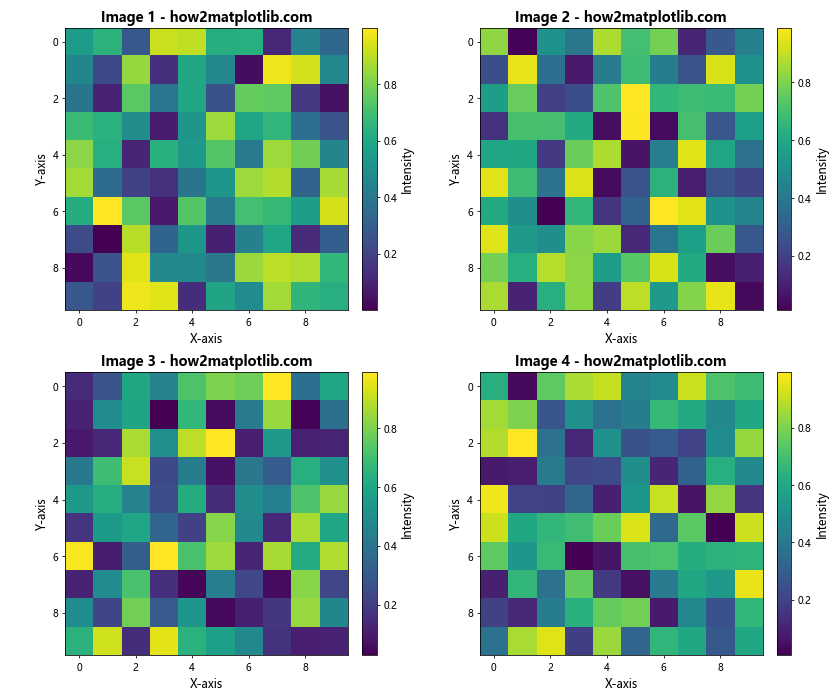
In this example, we customize the title, axis labels, and tick labels for each subplot. We also add a colorbar with a label to provide context for the image values.
Handling Different Color Maps for Multiple Images
When displaying multiple images in one figure correctly in Matplotlib, you may want to use different color maps for each image to highlight specific features or create visual contrast. Here’s an example of how to apply different color maps to multiple images:
import matplotlib.pyplot as plt
import numpy as np

# Create sample images
images = [np.random.rand(10, 10) for _ in range(4)]
cmaps = ['viridis', 'plasma', 'inferno', 'magma']

# Create a 2x2 grid of subplots
fig, axes = plt.subplots(2, 2, figsize=(12, 10))

# Flatten the axes array for easier iteration
axes_flat = axes.flatten()

# Display images in subplots with different color maps
for i, ax in enumerate(axes_flat):
    im = ax.imshow(images[i], cmap=cmaps[i])
    ax.set_title(f'Image {i+1} - {cmaps[i]} - how2matplotlib.com')
    fig.colorbar(im, ax=ax, orientation='vertical', fraction=0.046, pad=0.04)

plt.tight_layout()
plt.show()
Output:
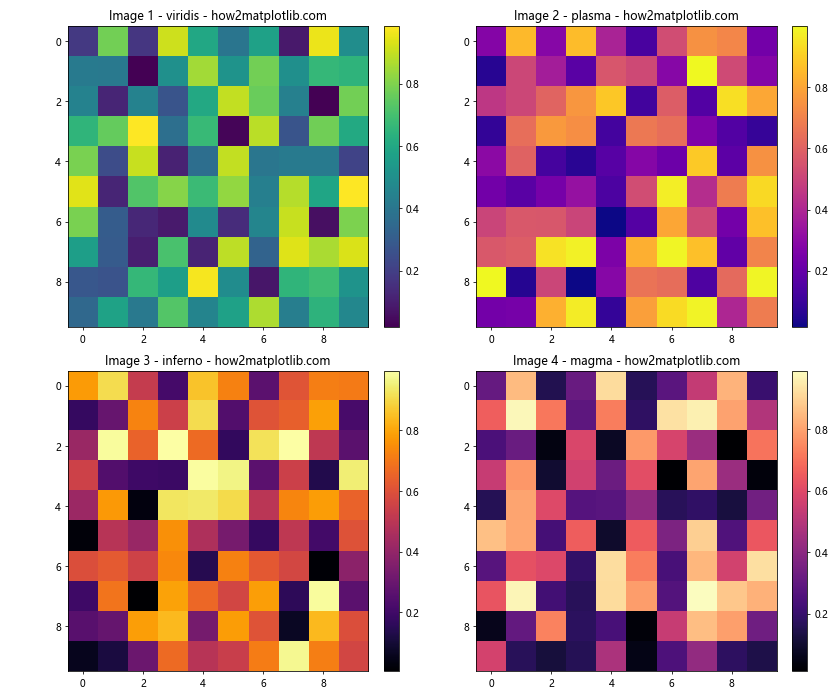
In this example, we use a different color map for each image, demonstrating how to create visual variety in your multi-image figures.
Creating a Composite Image from Multiple Images
Another interesting technique when learning how to display multiple images in one figure correctly in Matplotlib is creating a composite image from multiple source images. Here’s an example of how to achieve this:
import matplotlib.pyplot as plt
import numpy as np

# Create sample images
image1 = np.random.rand(10, 10)
image2 = np.random.rand(10, 10)
image3 = np.random.rand(10, 10)

# Create a composite image
composite = np.zeros((10, 10, 3))
composite[:,:,0] = image1  # Red channel
composite[:,:,1] = image2  # Green channel
composite[:,:,2] = image3  # Blue channel

# Create a figure with subplots
fig, (ax1, ax2, ax3, ax4) = plt.subplots(1, 4, figsize=(20, 5))

# Display individual images
ax1.imshow(image1, cmap='Reds')
ax1.set_title('Image 1 (Red) - how2matplotlib.com')
ax2.imshow(image2, cmap='Greens')
ax2.set_title('Image 2 (Green) - how2matplotlib.com')
ax3.imshow(image3, cmap='Blues')
ax3.set_title('Image 3 (Blue) - how2matplotlib.com')

# Display composite image
ax4.imshow(composite)
ax4.set_title('Composite Image - how2matplotlib.com')

# Remove axis ticks
for ax in (ax1, ax2, ax3, ax4):
    ax.set_xticks([])
    ax.set_yticks([])

plt.tight_layout()
plt.show()
Output:

In this example, we create a composite image by combining three separate images into the red, green, and blue channels of a single RGB image. We then display the individual source images alongside the composite image.
Displaying Images with Shared Axes
When displaying multiple images in one figure correctly in Matplotlib, you may want to create subplots with shared axes to facilitate comparison between images. Here’s an example of how to create subplots with shared axes:
import matplotlib.pyplot as plt
import numpy as np

# Create sample images
image1 = np.random.rand(10, 10)
image2 = np.random.rand(10, 10)

# Create a figure with shared axes
fig, (ax1, ax2) = plt.subplots(1, 2, figsize=(12, 5), sharex=True, sharey=True)

# Display images in subplots
im1 = ax1.imshow(image1, cmap='viridis', extent=[0, 10, 0, 10])
ax1.set_title('Image 1 - how2matplotlib.com')
im2 = ax2.imshow(image2, cmap='plasma', extent=[0, 10, 0, 10])
ax2.set_title('Image 2 - how2matplotlib.com')

# Add colorbars
fig.colorbar(im1, ax=ax1, orientation='vertical', fraction=0.046, pad=0.04)
fig.colorbar(im2, ax=ax2, orientation='vertical', fraction=0.046, pad=0.04)

# Set common labels
fig.text(0.5, 0.04, 'X-axis', ha='center', va='center')
fig.text(0.06, 0.5, 'Y-axis', ha='center', va='center', rotation='vertical')

plt.tight_layout()
plt.show()
Output:
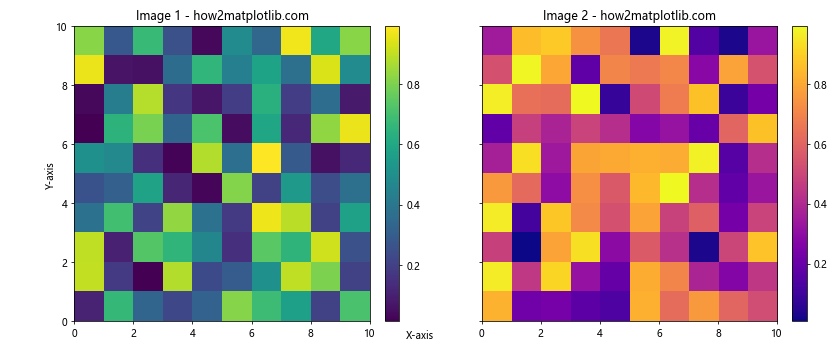
In this example, we create two subplots with shared x and y axes using the sharex and sharey parameters. We also add common axis labels using the fig.text function.
Displaying Images with Different Aspect Ratios
When learning how to display multiple images in one figure correctly in Matplotlib, you may encounter images with different aspect ratios. Here’s an example of how to handle this situation:
import matplotlib.pyplot as plt
import numpy as np

# Create sample images with different aspect ratios
image1 = np.random.rand(10, 20)
image2 = np.random.rand(15, 10)
image3 = np.random.rand(8, 8)

# Create a figure with subplots
fig, (ax1, ax2, ax3) = plt.subplots(1, 3, figsize=(15, 5))

# Display images in subplots
ax1.imshow(image1, cmap='viridis', aspect='auto')
ax1.set_title('Image 1 (10x20) - how2matplotlib.com')
ax2.imshow(image2, cmap='plasma', aspect='auto')
ax2.set_title('Image 2 (15x10) - how2matplotlib.com')
ax3.imshow(image3, cmap='inferno', aspect='auto')
ax3.set_title('Image 3 (8x8) - how2matplotlib.com')

# Remove axis ticks
for ax in (ax1, ax2, ax3):
    ax.set_xticks([])
    ax.set_yticks([])

plt.tight_layout()
plt.show()
Output:
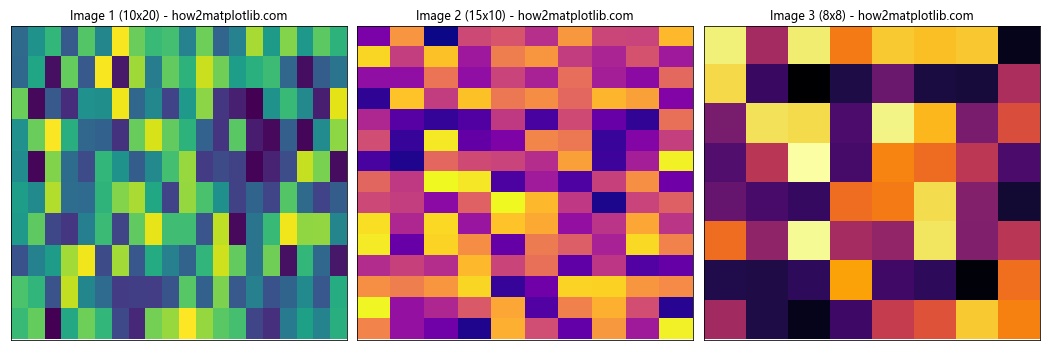
In this example, we use the aspect='auto' parameter in the imshow function to allow Matplotlib to adjust the aspect ratio of each image to fit within its subplot.
Creating an Image Montage
Another useful technique when displaying multiple images in one figure correctly in Matplotlib is creating an image montage. This is particularly helpful when you have a large number of images to display. Here’s an example of how to create an image montage:
import matplotlib.pyplot as plt
import numpy as np

# Create sample images
num_images = 16
images = [np.random.rand(5, 5) for _ in range(num_images)]

# Calculate grid dimensions
grid_size = int(np.ceil(np.sqrt(num_images)))

# Create a figure for the montage
fig, axes = plt.subplots(grid_size, grid_size, figsize=(12, 12))

# Flatten the axes array for easier iteration
axes_flat = axes.flatten()

# Display images in the montage
for i, ax in enumerate(axes_flat):
    if i < num_images:
        ax.imshow(images[i], cmap='viridis')
        ax.set_title(f'Image {i+1}', fontsize=8)
    ax.axis('off')

# Add a global title
fig.suptitle('Image Montage - how2matplotlib.com', fontsize=16, fontweight='bold')

plt.tight_layout()
plt.subplots_adjust(top=0.95)  # Adjust to make room for the global title
plt.show()
Output:
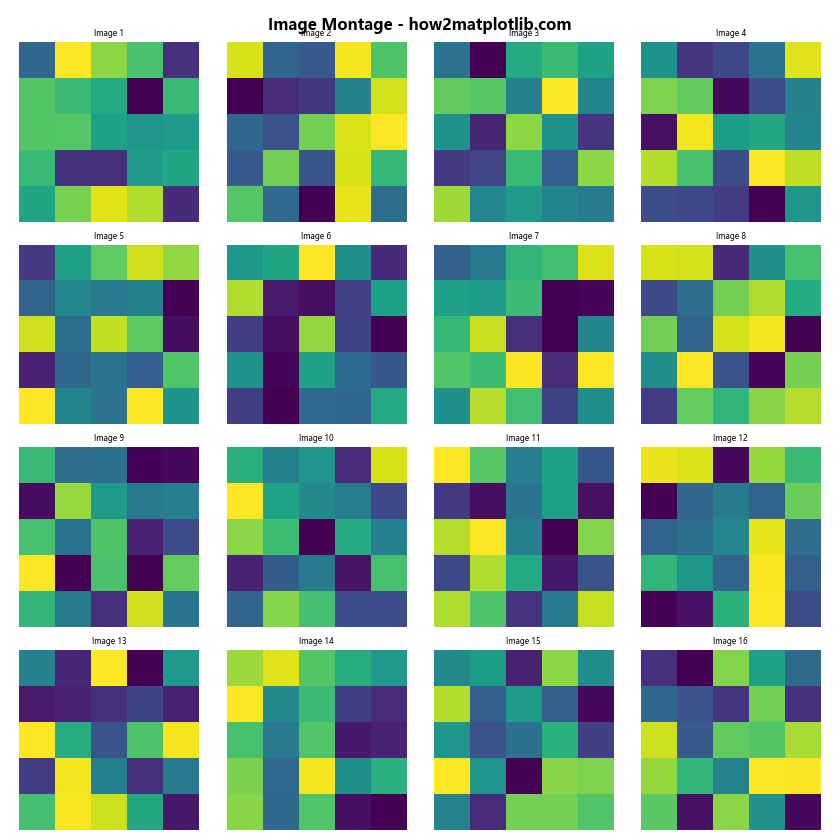
In this example, we create a grid of subplots based on the number of images and display each image in its own subplot. This technique is useful for quickly visualizing a large collection of images.
Displaying Images with Zoom Insets
When displaying multiple images in one figure correctly in Matplotlib, you may want to show a zoomed-in view of a specific region of an image. Here's an example of how to create a figure with a main image and a zoomed inset:
import matplotlib.pyplot as plt
import numpy as np
from mpl_toolkits.axes_grid1.inset_locator import zoomed_inset_axes, mark_inset

# Create a sample image
image = np.random.rand(20, 20)

# Create a figure with a main subplot and an inset
fig, ax = plt.subplots(figsize=(10, 8))

# Display the main image
im = ax.imshow(image, cmap='viridis')
ax.set_title('Main Image - how2matplotlib.com')

# Create a zoomed inset
axins = zoomed_inset_axes(ax, zoom=4, loc=2)  # zoom factor: 4, location: upper left
axins.imshow(image, cmap='viridis')

# Specify the limits of the inset
x1, x2, y1, y2 = 5, 10, 5, 10
axins.set_xlim(x1, x2)
axins.set_ylim(y1, y2)
axins.set_xticks([])
axins.set_yticks([])

# Draw a box around the region of the inset
mark_inset(ax, axins, loc1=2, loc2=4, fc="none", ec="red")

plt.colorbar(im, ax=ax, orientation='vertical', fraction=0.046, pad=0.04)
plt.show()
Output:
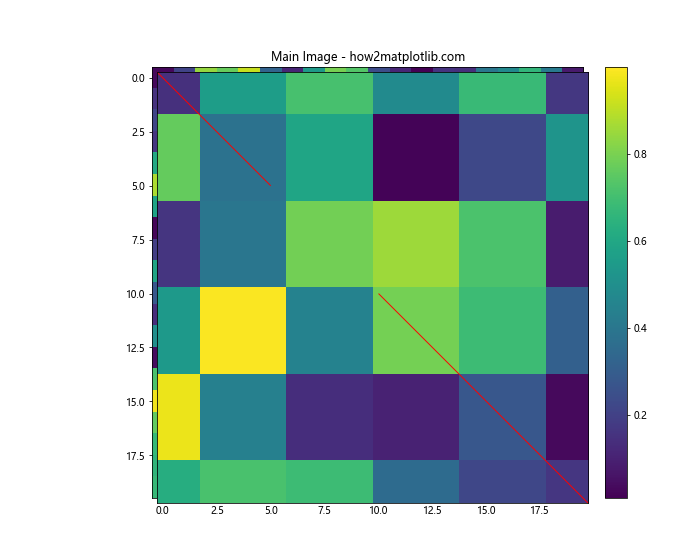
In this example, we use the zoomed_inset_axes function from mpl_toolkits.axes_grid1.inset_locator to create a zoomed-in view of a specific region of the main image. We also use mark_inset to draw a box around the zoomed region in the main image.
Displaying Images with Histograms
When learning how to display multiple images in one figure correctly in Matplotlib, you may want to include histograms alongside your images to show the distribution of pixel values. Here's an example of how to create a figure with images and their corresponding histograms:
import matplotlib.pyplot as plt
import numpy as np

# Create sample images
image1 = np.random.normal(0, 1, (10, 10))
image2 = np.random.gamma(2, 2, (10, 10))

# Create a figure with subplots
fig, ((ax1, ax2), (ax3, ax4)) = plt.subplots(2, 2, figsize=(12, 10))

# Display images
im1 = ax1.imshow(image1, cmap='viridis')
ax1.set_title('Image 1 - how2matplotlib.com')
im2 = ax2.imshow(image2, cmap='plasma')
ax2.set_title('Image 2 - how2matplotlib.com')

# Add colorbars
fig.colorbar(im1, ax=ax1, orientation='vertical', fraction=0.046, pad=0.04)
fig.colorbar(im2, ax=ax2, orientation='vertical', fraction=0.046, pad=0.04)

# Plot histograms
ax3.hist(image1.flatten(), bins=20, color='blue', alpha=0.7)
ax3.set_title('Histogram of Image 1')
ax3.set_xlabel('Pixel Value')
ax3.set_ylabel('Frequency')

ax4.hist(image2.flatten(), bins=20, color='red', alpha=0.7)
ax4.set_title('Histogram of Image 2')
ax4.set_xlabel('Pixel Value')
ax4.set_ylabel('Frequency')

plt.tight_layout()
plt.show()
Output:
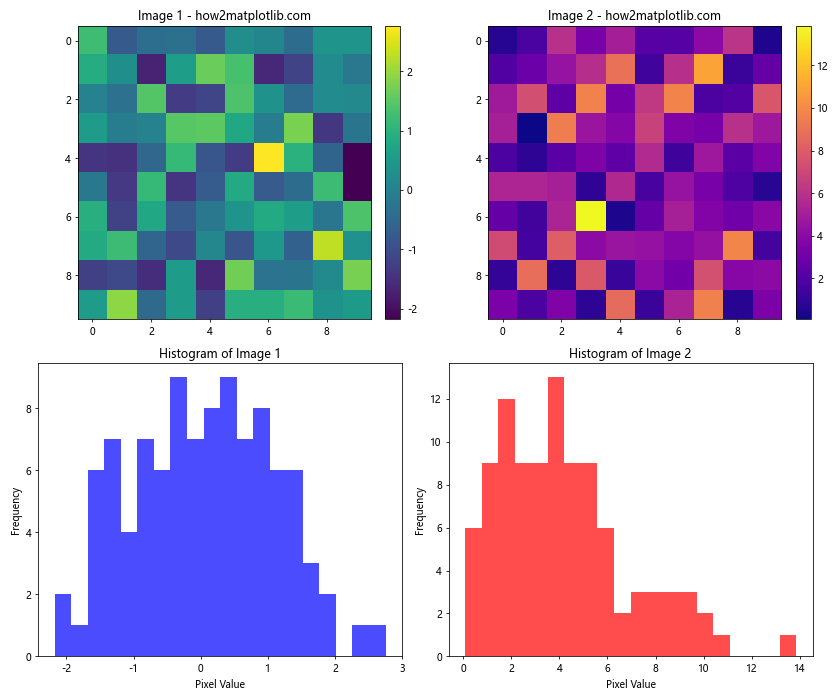
In this example, we create a 2x2 grid of subplots, with images in the top row and their corresponding histograms in the bottom row. This allows for easy comparison of the images and their pixel value distributions.
Conclusion
In this comprehensive guide, we've explored various techniques for displaying multiple images in one figure correctly in Matplotlib. We've covered a wide range of topics, including:
- Creating basic multi-image figures
- Arranging images in grids
- Adjusting subplot sizes and spacing
- Adding colorbars and annotations
- Customizing axes and titles
- Handling images with different sizes and aspect ratios
- Creating composite images
- Using shared axes for easier comparison
- Adding global titles to multi-image figures
- Creating image montages
- Displaying images with zoom insets
- Combining images with histograms
By mastering these techniques, you'll be well-equipped to create informative and visually appealing multi-image figures using Matplotlib. Remember to experiment with different layouts and customization options to find the best way to present your data and images.
When working on how to display multiple images in one figure correctly in Matplotlib, always consider the following best practices:
- Choose an appropriate layout for your images based on their number and importance
- Use consistent color maps and scales when comparing multiple images
- Add informative titles, labels, and annotations to provide context
- Adjust subplot sizes and spacing to create a balanced composition
- Use colorbars and other visual aids to help interpret the image data
- Consider the aspect ratios of your images and adjust them as needed
- Experiment with different visualization techniques to highlight specific features or relationships between images
By following these guidelines and leveraging the powerful features of Matplotlib, you'll be able to create effective and professional-looking multi-image figures for your data visualization and image processing projects.