How to Master Matplotlib Axvline with Datetime: A Comprehensive Guide
Matplotlib axvline datetime is a powerful combination for visualizing time-based data in Python. This article will explore the intricacies of using matplotlib axvline with datetime objects, providing a comprehensive guide to help you master this essential data visualization technique.
Understanding Matplotlib Axvline and Datetime
Matplotlib is a widely-used plotting library in Python, and the axvline function is a versatile tool for adding vertical lines to plots. When combined with datetime objects, axvline becomes particularly useful for highlighting specific time points or intervals in time series data.
What is Matplotlib Axvline?
Matplotlib axvline is a function that adds a vertical line to a plot at a specified x-coordinate. It’s part of the matplotlib.pyplot module and is commonly used to mark important points or thresholds in data visualizations.
Let’s start with a simple example of using matplotlib axvline:
import matplotlib.pyplot as plt
import numpy as np

x = np.linspace(0, 10, 100)
y = np.sin(x)

plt.plot(x, y)
plt.axvline(x=5, color='r', linestyle='--', label='Vertical Line')
plt.title('Simple Matplotlib Axvline Example - how2matplotlib.com')
plt.legend()
plt.show()
Output:
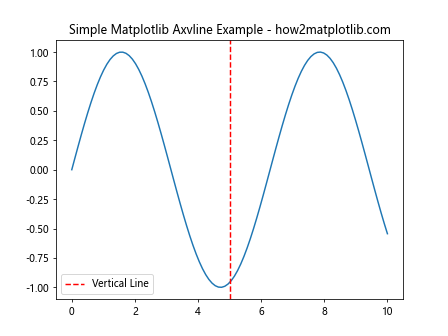
In this example, we create a simple sine wave plot and add a vertical red dashed line at x=5 using matplotlib axvline. The line is labeled and included in the legend.
Introduction to Datetime in Python
Datetime is a Python module that provides classes for working with dates and times. When using matplotlib axvline with datetime, we can precisely mark specific time points on our plots.
Here’s a basic example of working with datetime objects:
from datetime import datetime, timedelta

start_date = datetime(2023, 1, 1)
end_date = start_date + timedelta(days=7)

print(f"Start date: {start_date}")
print(f"End date: {end_date}")
Output:
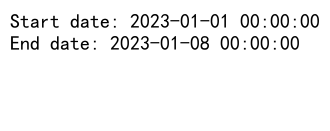
This code creates a start date and calculates an end date 7 days later using timedelta.
Combining Matplotlib Axvline with Datetime
Now that we understand the basics of matplotlib axvline and datetime separately, let’s explore how to use them together effectively.
Creating a Time Series Plot
First, let’s create a simple time series plot using matplotlib and datetime:
import matplotlib.pyplot as plt
import numpy as np
from datetime import datetime, timedelta

# Generate sample data
start_date = datetime(2023, 1, 1)
dates = [start_date + timedelta(days=i) for i in range(30)]
values = np.random.randn(30).cumsum()

plt.figure(figsize=(12, 6))
plt.plot(dates, values)
plt.title('Time Series Plot - how2matplotlib.com')
plt.xlabel('Date')
plt.ylabel('Value')
plt.grid(True)
plt.show()
Output:
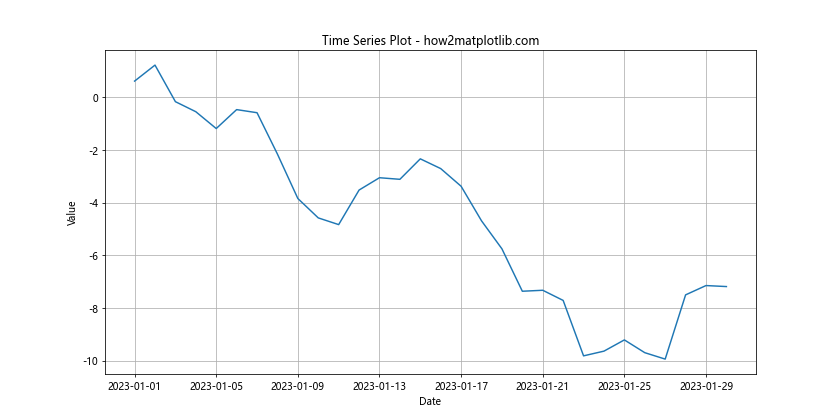
This example creates a 30-day time series with random cumulative values.
Adding Vertical Lines with Matplotlib Axvline and Datetime
Now, let’s add vertical lines to our time series plot using matplotlib axvline and datetime:
import matplotlib.pyplot as plt
import numpy as np
from datetime import datetime, timedelta

# Generate sample data
start_date = datetime(2023, 1, 1)
dates = [start_date + timedelta(days=i) for i in range(30)]
values = np.random.randn(30).cumsum()

plt.figure(figsize=(12, 6))
plt.plot(dates, values)

# Add vertical lines
plt.axvline(x=datetime(2023, 1, 15), color='r', linestyle='--', label='Mid-month')
plt.axvline(x=datetime(2023, 1, 30), color='g', linestyle=':', label='Month-end')

plt.title('Time Series with Matplotlib Axvline Datetime - how2matplotlib.com')
plt.xlabel('Date')
plt.ylabel('Value')
plt.legend()
plt.grid(True)
plt.show()
Output:
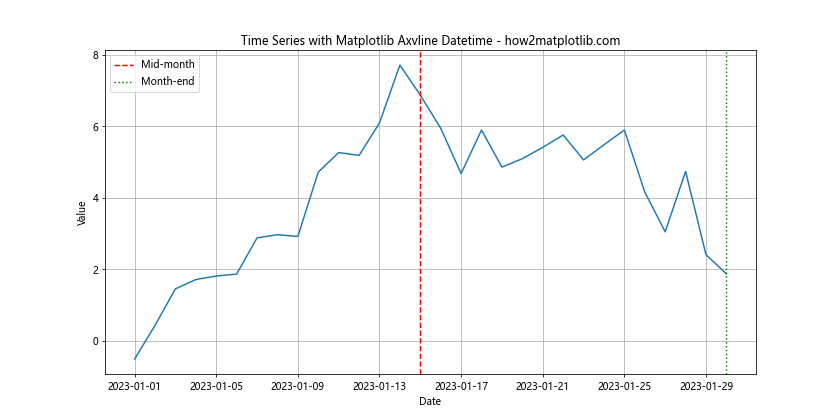
In this example, we add two vertical lines using matplotlib axvline: one at January 15th (mid-month) and another at January 30th (month-end). Each line has a different color and style for easy distinction.
Advanced Techniques with Matplotlib Axvline and Datetime
Let’s explore some more advanced techniques for using matplotlib axvline with datetime objects.
Highlighting Time Ranges
We can use multiple matplotlib axvline calls to highlight specific time ranges:
import matplotlib.pyplot as plt
import numpy as np
from datetime import datetime, timedelta

# Generate sample data
start_date = datetime(2023, 1, 1)
dates = [start_date + timedelta(days=i) for i in range(30)]
values = np.random.randn(30).cumsum()

plt.figure(figsize=(12, 6))
plt.plot(dates, values)

# Highlight a time range
range_start = datetime(2023, 1, 10)
range_end = datetime(2023, 1, 20)
plt.axvline(x=range_start, color='r', linestyle='--', label='Range Start')
plt.axvline(x=range_end, color='r', linestyle='--', label='Range End')
plt.axvspan(range_start, range_end, alpha=0.2, color='r')

plt.title('Time Series with Highlighted Range - how2matplotlib.com')
plt.xlabel('Date')
plt.ylabel('Value')
plt.legend()
plt.grid(True)
plt.show()
Output:
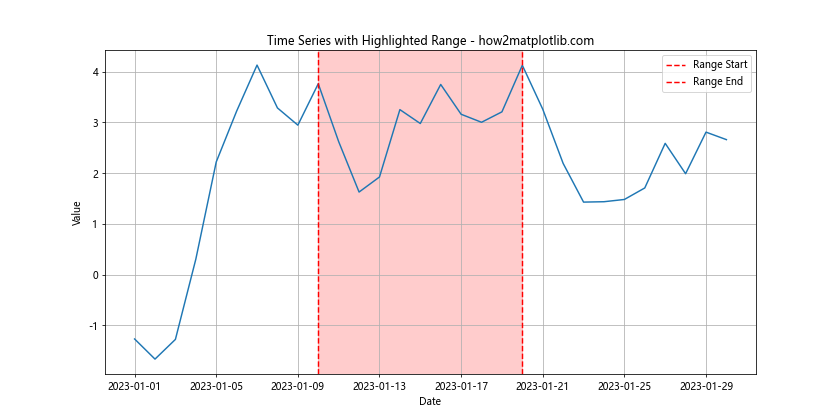
This example highlights a 10-day range using two vertical lines and a shaded area between them.
Using Matplotlib Axvline with Different Time Units
Matplotlib axvline can be used with various time units. Here’s an example using hours:
import matplotlib.pyplot as plt
import numpy as np
from datetime import datetime, timedelta

# Generate sample data
start_time = datetime(2023, 1, 1, 0, 0)
times = [start_time + timedelta(hours=i) for i in range(24)]
values = np.random.randn(24).cumsum()

plt.figure(figsize=(12, 6))
plt.plot(times, values)

# Add vertical lines at specific hours
plt.axvline(x=datetime(2023, 1, 1, 6, 0), color='r', linestyle='--', label='6 AM')
plt.axvline(x=datetime(2023, 1, 1, 18, 0), color='g', linestyle=':', label='6 PM')

plt.title('24-Hour Time Series with Matplotlib Axvline - how2matplotlib.com')
plt.xlabel('Time')
plt.ylabel('Value')
plt.legend()
plt.grid(True)
plt.show()
Output:
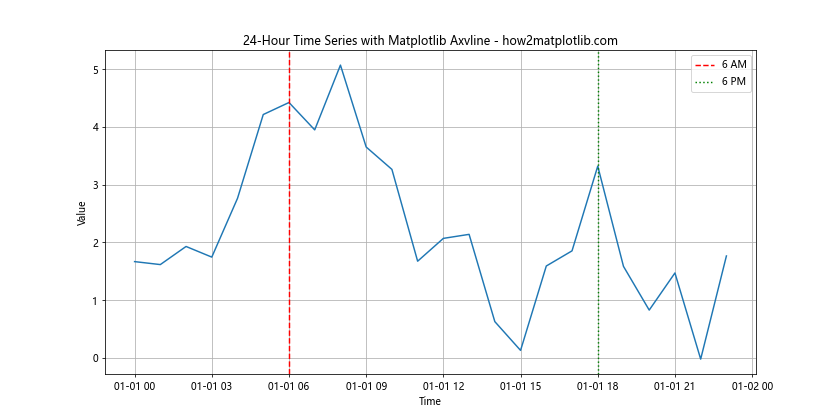
This example creates a 24-hour time series and adds vertical lines at 6 AM and 6 PM.
Customizing Matplotlib Axvline Appearance
Matplotlib axvline offers various customization options to enhance the appearance of vertical lines.
Line Styles and Colors
You can customize the line style and color of matplotlib axvline:
import matplotlib.pyplot as plt
import numpy as np
from datetime import datetime, timedelta

# Generate sample data
start_date = datetime(2023, 1, 1)
dates = [start_date + timedelta(days=i) for i in range(30)]
values = np.random.randn(30).cumsum()

plt.figure(figsize=(12, 6))
plt.plot(dates, values)

# Add customized vertical lines
plt.axvline(x=datetime(2023, 1, 10), color='r', linestyle='--', linewidth=2, label='Dashed Red')
plt.axvline(x=datetime(2023, 1, 20), color='g', linestyle=':', linewidth=3, label='Dotted Green')
plt.axvline(x=datetime(2023, 1, 30), color='b', linestyle='-', linewidth=1, label='Solid Blue')

plt.title('Customized Matplotlib Axvline Styles - how2matplotlib.com')
plt.xlabel('Date')
plt.ylabel('Value')
plt.legend()
plt.grid(True)
plt.show()
Output:
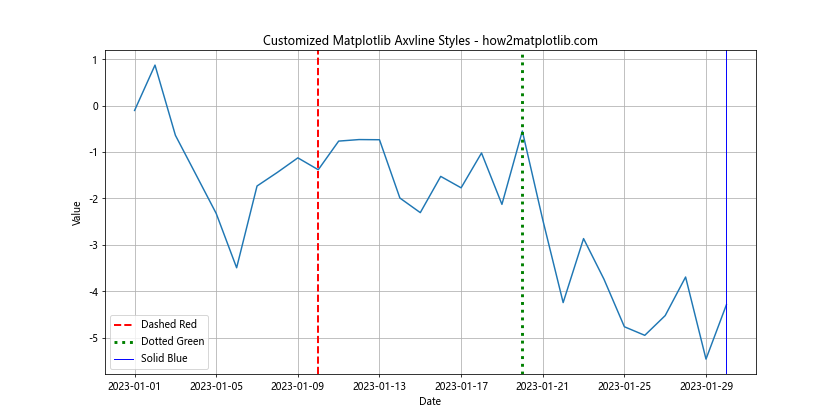
This example demonstrates different line styles, colors, and widths for matplotlib axvline.
Adding Text Annotations
You can add text annotations to your matplotlib axvline datetime plots:
import matplotlib.pyplot as plt
import numpy as np
from datetime import datetime, timedelta

# Generate sample data
start_date = datetime(2023, 1, 1)
dates = [start_date + timedelta(days=i) for i in range(30)]
values = np.random.randn(30).cumsum()

plt.figure(figsize=(12, 6))
plt.plot(dates, values)

# Add vertical line with text annotation
event_date = datetime(2023, 1, 15)
plt.axvline(x=event_date, color='r', linestyle='--', label='Important Event')
plt.text(event_date, plt.ylim()[1], 'Important Event', rotation=90, va='bottom', ha='right')

plt.title('Matplotlib Axvline with Text Annotation - how2matplotlib.com')
plt.xlabel('Date')
plt.ylabel('Value')
plt.legend()
plt.grid(True)
plt.show()
Output:
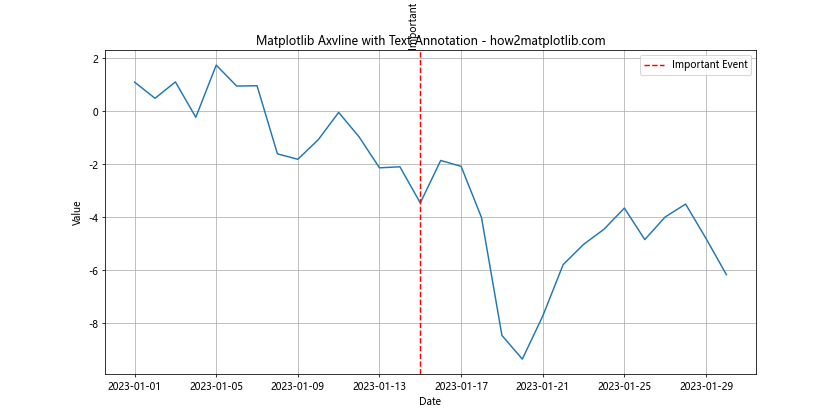
This example adds a text annotation to the vertical line, rotated 90 degrees for better readability.
Handling Multiple Time Series with Matplotlib Axvline Datetime
When working with multiple time series, matplotlib axvline datetime can be used to highlight important points across all series.
Comparing Multiple Time Series
Here’s an example of using matplotlib axvline with multiple time series:
import matplotlib.pyplot as plt
import numpy as np
from datetime import datetime, timedelta

# Generate sample data for two time series
start_date = datetime(2023, 1, 1)
dates = [start_date + timedelta(days=i) for i in range(30)]
values1 = np.random.randn(30).cumsum()
values2 = np.random.randn(30).cumsum()

plt.figure(figsize=(12, 6))
plt.plot(dates, values1, label='Series 1')
plt.plot(dates, values2, label='Series 2')

# Add vertical lines
plt.axvline(x=datetime(2023, 1, 10), color='r', linestyle='--', label='Event A')
plt.axvline(x=datetime(2023, 1, 20), color='g', linestyle=':', label='Event B')

plt.title('Multiple Time Series with Matplotlib Axvline - how2matplotlib.com')
plt.xlabel('Date')
plt.ylabel('Value')
plt.legend()
plt.grid(True)
plt.show()
Output:
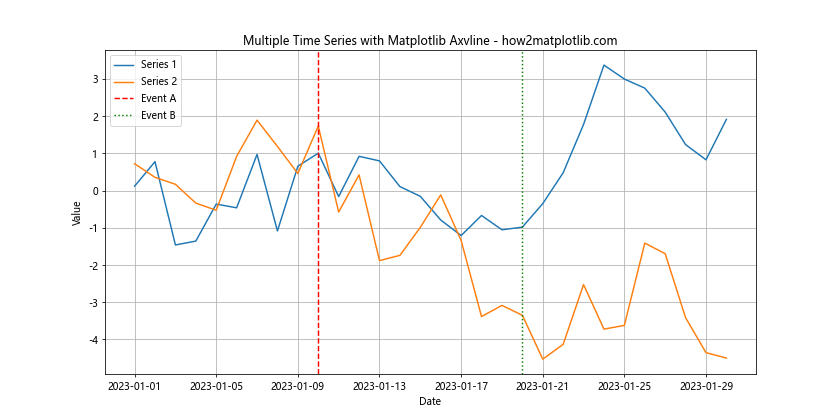
This example plots two time series and uses matplotlib axvline to mark two important events that affect both series.
Subplots with Shared Axvline
You can also use matplotlib axvline across multiple subplots:
import matplotlib.pyplot as plt
import numpy as np
from datetime import datetime, timedelta

# Generate sample data for two time series
start_date = datetime(2023, 1, 1)
dates = [start_date + timedelta(days=i) for i in range(30)]
values1 = np.random.randn(30).cumsum()
values2 = np.random.randn(30).cumsum()

fig, (ax1, ax2) = plt.subplots(2, 1, figsize=(12, 8), sharex=True)

ax1.plot(dates, values1)
ax1.set_title('Series 1 - how2matplotlib.com')
ax1.set_ylabel('Value')

ax2.plot(dates, values2)
ax2.set_title('Series 2 - how2matplotlib.com')
ax2.set_xlabel('Date')
ax2.set_ylabel('Value')

# Add vertical line to both subplots
event_date = datetime(2023, 1, 15)
ax1.axvline(x=event_date, color='r', linestyle='--', label='Important Event')
ax2.axvline(x=event_date, color='r', linestyle='--', label='Important Event')

plt.tight_layout()
plt.show()
Output:
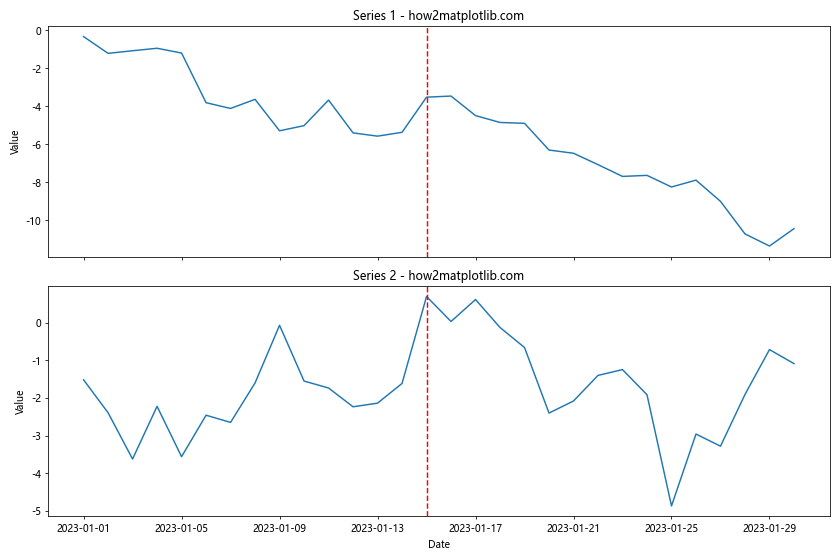
This example creates two subplots with a shared x-axis and adds a vertical line to both using matplotlib axvline.
Handling Time Zones with Matplotlib Axvline Datetime
When working with time series data from different time zones, it’s important to handle time zones correctly in your matplotlib axvline datetime plots.
Converting Time Zones
Here’s an example of handling different time zones:
import matplotlib.pyplot as plt
import numpy as np
from datetime import datetime, timedelta
import pytz

# Generate sample data
start_date = datetime(2023, 1, 1, tzinfo=pytz.UTC)
dates = [start_date + timedelta(hours=i) for i in range(24)]
values = np.random.randn(24).cumsum()

plt.figure(figsize=(12, 6))
plt.plot(dates, values)

# Add vertical lines for different time zones
nyc_time = datetime(2023, 1, 1, 12, 0, tzinfo=pytz.timezone('America/New_York'))
tokyo_time = datetime(2023, 1, 1, 12, 0, tzinfo=pytz.timezone('Asia/Tokyo'))

plt.axvline(x=nyc_time.astimezone(pytz.UTC), color='r', linestyle='--', label='Noon in NYC')
plt.axvline(x=tokyo_time.astimezone(pytz.UTC), color='g', linestyle=':', label='Noon in Tokyo')

plt.title('Time Zones with Matplotlib Axvline Datetime - how2matplotlib.com')
plt.xlabel('UTC Time')
plt.ylabel('Value')
plt.legend()
plt.grid(True)
plt.show()
Output:
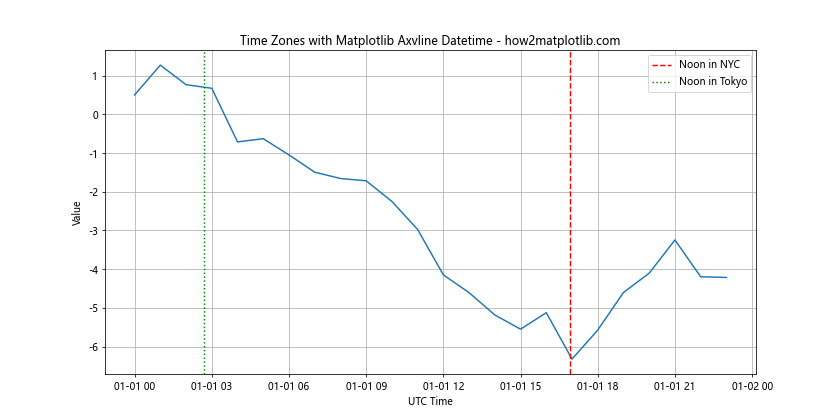
This example creates a 24-hour UTC time series and adds vertical lines to mark noon in New York and Tokyo.
Matplotlib Axvline Datetime in Real-world Applications
Let’s explore some real-world applications of matplotlib axvline datetime.
Stock Market Analysis
Here’s an example of using matplotlib axvline datetime for stock market analysis:
import matplotlib.pyplot as plt
import numpy as np
from datetime import datetime, timedelta
import pandas as pd

# Generate sample stock data
start_date = datetime(2023, 1, 1)
dates = [start_date + timedelta(days=i) for i in range(30)]
prices = np.random.randn(30).cumsum() + 100

df = pd.DataFrame({'Date': dates, 'Price': prices})
df.set_index('Date', inplace=True)

plt.figure(figsize=(12, 6))
plt.plot(df.index, df['Price'])

# Add vertical lines for important events
plt.axvline(x=datetime(2023, 1, 10), color='r', linestyle='--', label='Earnings Report')
plt.axvline(x=datetime(2023, 1, 20), color='g', linestyle=':', label='Product Launch')

plt.title('Stock Price Analysis with Matplotlib Axvline - how2matplotlib.com')
plt.xlabel('Date')
plt.ylabel('Price')
plt.legend()
plt.grid(True)
plt.show()
Output:
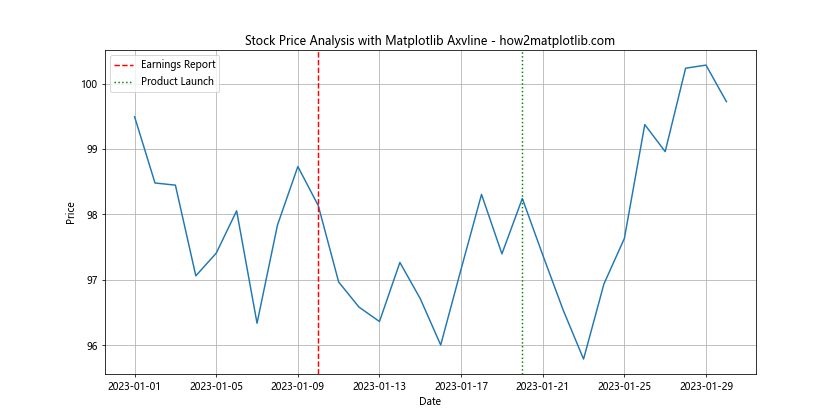
This example simulates a stock price chart and uses matplotlib axvline to mark important events like earnings reports and product launches.
Weather Data Visualization
Here’s an example of using matplotlib axvline datetime for weather data visualization:
import matplotlib.pyplot as plt
import numpy as np
from datetime import datetime, timedelta

# Generate sample weather data
start_date = datetime(2023, 1, 1)
dates = [start_date + timedelta(days=i) for i in range(30)]
temperatures = np.random.normal(20,5, 30)

plt.figure(figsize=(12, 6))
plt.plot(dates, temperatures)

# Add vertical lines for season changes
plt.axvline(x=datetime(2023, 1, 15), color='r', linestyle='--', label='Mid-Winter')
plt.axvline(x=datetime(2023, 1, 31), color='g', linestyle=':', label='Start of Spring')

plt.title('Temperature Trends with Matplotlib Axvline Datetime - how2matplotlib.com')
plt.xlabel('Date')
plt.ylabel('Temperature (°C)')
plt.legend()
plt.grid(True)
plt.show()
Output:
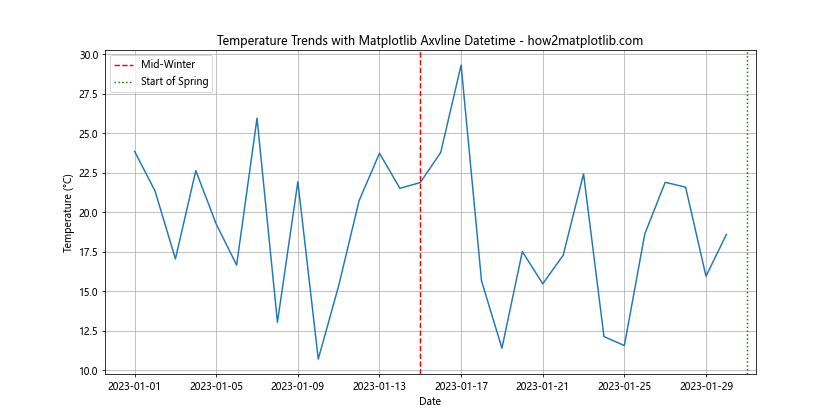
This example visualizes temperature trends over a month and uses matplotlib axvline to mark important seasonal changes.
Best Practices for Using Matplotlib Axvline with Datetime
To make the most of matplotlib axvline datetime, consider the following best practices:
- Use clear and consistent color coding for your vertical lines.
- Add labels to your vertical lines to explain their significance.
- Consider using different line styles (solid, dashed, dotted) to differentiate between types of events.
- When working with multiple time series, ensure that your vertical lines are visible across all plots.
- Use appropriate date formatting on your x-axis to make the plot easy to read.
Here’s an example incorporating these best practices:
import matplotlib.pyplot as plt
import matplotlib.dates as mdates
import numpy as np
from datetime import datetime, timedelta

# Generate sample data
start_date = datetime(2023, 1, 1)
dates = [start_date + timedelta(days=i) for i in range(30)]
values = np.random.randn(30).cumsum()

plt.figure(figsize=(12, 6))
plt.plot(dates, values)

# Add vertical lines with best practices
plt.axvline(x=datetime(2023, 1, 10), color='r', linestyle='--', linewidth=2, label='Important Event')
plt.axvline(x=datetime(2023, 1, 20), color='g', linestyle=':', linewidth=2, label='Milestone')

plt.title('Best Practices for Matplotlib Axvline Datetime - how2matplotlib.com')
plt.xlabel('Date')
plt.ylabel('Value')
plt.legend()
plt.grid(True)

# Format x-axis dates
plt.gca().xaxis.set_major_formatter(mdates.DateFormatter('%Y-%m-%d'))
plt.gcf().autofmt_xdate()  # Rotate and align the tick labels

plt.show()
Output:
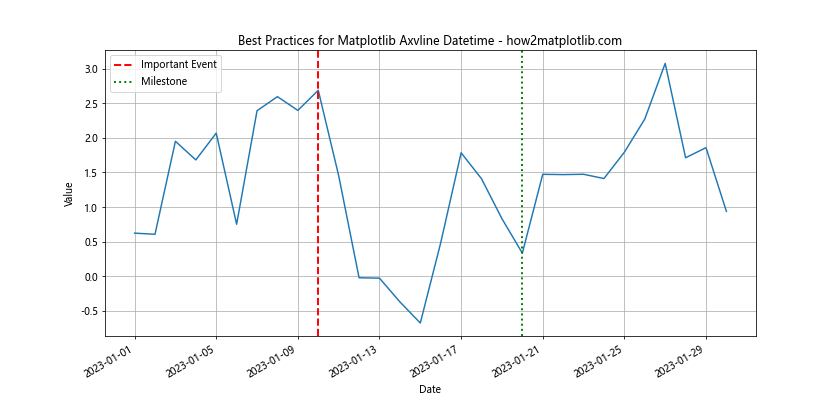
This example demonstrates clear color coding, labeled vertical lines, different line styles, and proper date formatting on the x-axis.
Troubleshooting Common Issues with Matplotlib Axvline Datetime
When working with matplotlib axvline and datetime, you might encounter some common issues. Here are some problems and their solutions:
Issue 1: Vertical Lines Not Appearing
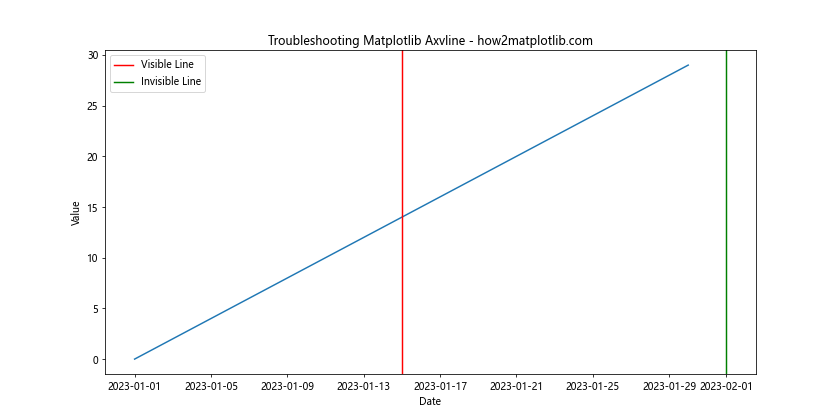
If your vertical lines are not appearing, ensure that the datetime values for your axvline calls fall within the range of your x-axis data.
import matplotlib.pyplot as plt
from datetime import datetime, timedelta

# Generate sample data
start_date = datetime(2023, 1, 1)
dates = [start_date + timedelta(days=i) for i in range(30)]
values = list(range(30))

plt.figure(figsize=(12, 6))
plt.plot(dates, values)

# Correct: This line will appear
plt.axvline(x=datetime(2023, 1, 15), color='r', label='Visible Line')

# Incorrect: This line won't appear (out of range)
plt.axvline(x=datetime(2023, 2, 1), color='g', label='Invisible Line')

plt.title('Troubleshooting Matplotlib Axvline - how2matplotlib.com')
plt.xlabel('Date')
plt.ylabel('Value')
plt.legend()
plt.show()
Output:
Issue 2: Incorrect Date Formatting
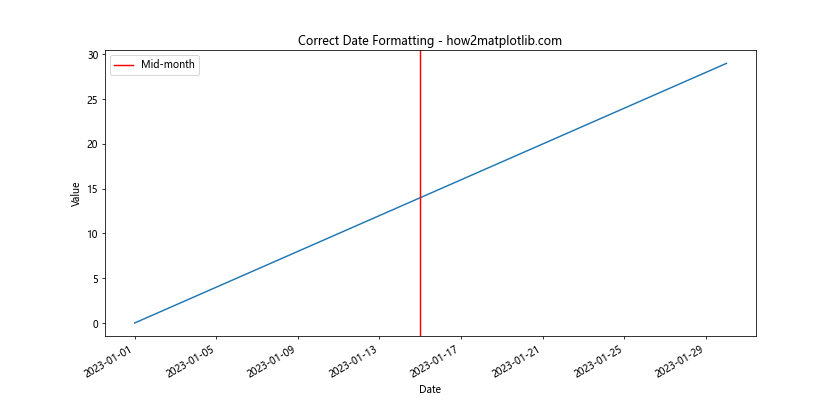
If your dates are not displaying correctly, make sure you’re using the correct date formatter:
import matplotlib.pyplot as plt
import matplotlib.dates as mdates
from datetime import datetime, timedelta

# Generate sample data
start_date = datetime(2023, 1, 1)
dates = [start_date + timedelta(days=i) for i in range(30)]
values = list(range(30))

plt.figure(figsize=(12, 6))
plt.plot(dates, values)

plt.axvline(x=datetime(2023, 1, 15), color='r', label='Mid-month')

plt.title('Correct Date Formatting - how2matplotlib.com')
plt.xlabel('Date')
plt.ylabel('Value')
plt.legend()

# Use correct date formatter
plt.gca().xaxis.set_major_formatter(mdates.DateFormatter('%Y-%m-%d'))
plt.gcf().autofmt_xdate()  # Rotate and align the tick labels

plt.show()
Output:
Issue 3: Timezone Mismatches
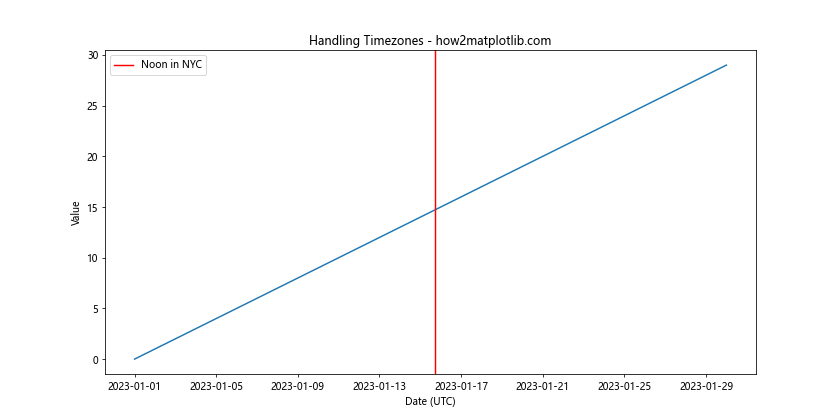
When working with data from different timezones, ensure all datetime objects are in the same timezone:
import matplotlib.pyplot as plt
import pytz
from datetime import datetime, timedelta

# Generate sample data in UTC
start_date = datetime(2023, 1, 1, tzinfo=pytz.UTC)
dates = [start_date + timedelta(days=i) for i in range(30)]
values = list(range(30))

plt.figure(figsize=(12, 6))
plt.plot(dates, values)

# Correct: Convert to UTC before plotting
nyc_time = datetime(2023, 1, 15, 12, 0, tzinfo=pytz.timezone('America/New_York'))
plt.axvline(x=nyc_time.astimezone(pytz.UTC), color='r', label='Noon in NYC')

plt.title('Handling Timezones - how2matplotlib.com')
plt.xlabel('Date (UTC)')
plt.ylabel('Value')
plt.legend()
plt.show()
Output:
Advanced Applications of Matplotlib Axvline Datetime
Let’s explore some advanced applications of matplotlib axvline with datetime objects.
Creating a Gantt Chart
Matplotlib axvline can be used to create simple Gantt charts:
import matplotlib.pyplot as plt
from datetime import datetime, timedelta

# Define tasks
tasks = [
    ("Task 1", datetime(2023, 1, 1), datetime(2023, 1, 10)),
    ("Task 2", datetime(2023, 1, 5), datetime(2023, 1, 15)),
    ("Task 3", datetime(2023, 1, 10), datetime(2023, 1, 20)),
]

fig, ax = plt.subplots(figsize=(12, 6))

for i, (task, start, end) in enumerate(tasks):
    ax.barh(i, (end - start).days, left=start, height=0.5, align='center', color='skyblue', alpha=0.8)
    ax.text(start, i, task, va='center', ha='right', fontweight='bold', fontsize=10, color='navy')

# Add today's date line
today = datetime(2023, 1, 12)
ax.axvline(x=today, color='r', linestyle='--', linewidth=2, label="Today")

ax.set_ylim(-1, len(tasks))
ax.set_yticks(range(len(tasks)))
ax.set_yticklabels([])
ax.set_xlabel('Date')

plt.title('Gantt Chart with Matplotlib Axvline - how2matplotlib.com')
plt.legend()
plt.grid(True)
plt.tight_layout()
plt.show()
Output:
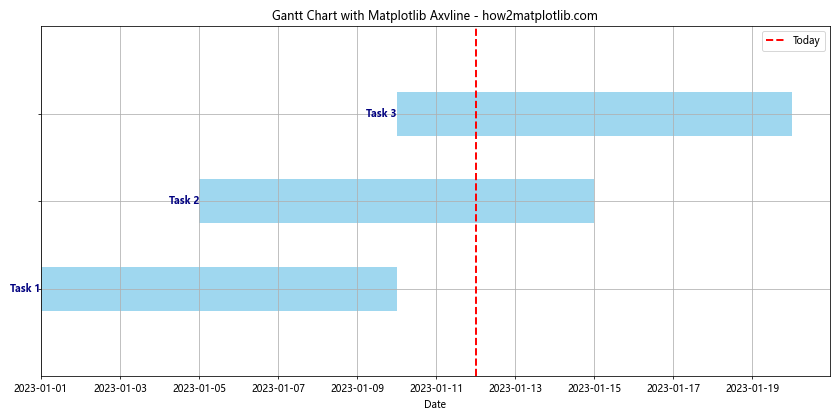
This example creates a simple Gantt chart and uses matplotlib axvline to mark the current date.
Creating a Timeline of Events
Matplotlib axvline can be used to create a timeline of events:
import matplotlib.pyplot as plt
from datetime import datetime, timedelta

# Define events
events = [
    ("Event A", datetime(2023, 1, 5)),
    ("Event B", datetime(2023, 1, 10)),
    ("Event C", datetime(2023, 1, 15)),
    ("Event D", datetime(2023, 1, 20)),
]

fig, ax = plt.subplots(figsize=(12, 6))

for i, (event, date) in enumerate(events):
    ax.axvline(x=date, color='r', linestyle='--', linewidth=2)
    ax.text(date, 0.5, event, rotation=90, va='bottom', ha='right')

ax.set_ylim(0, 1)
ax.set_yticks([])
ax.set_xlabel('Date')

plt.title('Timeline of Events with Matplotlib Axvline - how2matplotlib.com')
plt.grid(True)
plt.tight_layout()
plt.show()
Output:
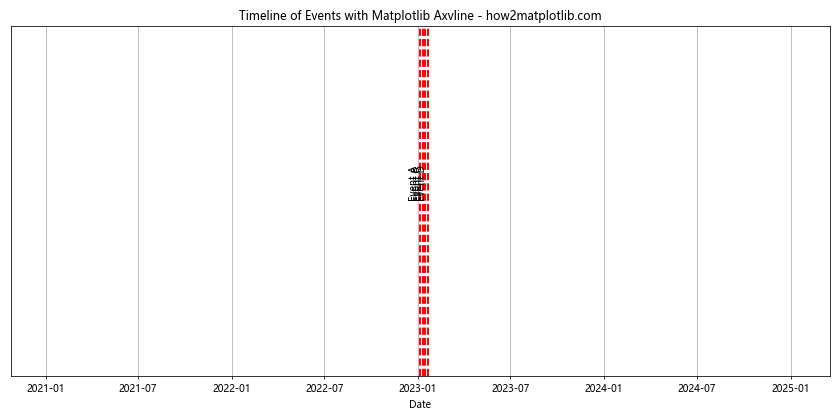
This example creates a timeline of events using matplotlib axvline to mark each event.
Integrating Matplotlib Axvline Datetime with Other Libraries
Matplotlib axvline datetime can be integrated with other popular data analysis and visualization libraries for more advanced applications.
Using Matplotlib Axvline with Pandas
Here’s an example of using matplotlib axvline with pandas time series data:
import matplotlib.pyplot as plt
import pandas as pd
import numpy as np
from datetime import datetime, timedelta

# Create a pandas DataFrame with time series data
start_date = datetime(2023, 1, 1)
dates = [start_date + timedelta(days=i) for i in range(30)]
data = pd.DataFrame({
    'Date': dates,
    'Value': np.random.randn(30).cumsum()
})
data.set_index('Date', inplace=True)

# Plot the data
plt.figure(figsize=(12, 6))
data['Value'].plot()

# Add vertical lines
plt.axvline(x=datetime(2023, 1, 10), color='r', linestyle='--', label='Event A')
plt.axvline(x=datetime(2023, 1, 20), color='g', linestyle=':', label='Event B')

plt.title('Pandas Time Series with Matplotlib Axvline - how2matplotlib.com')
plt.xlabel('Date')
plt.ylabel('Value')
plt.legend()
plt.grid(True)
plt.show()
Output:
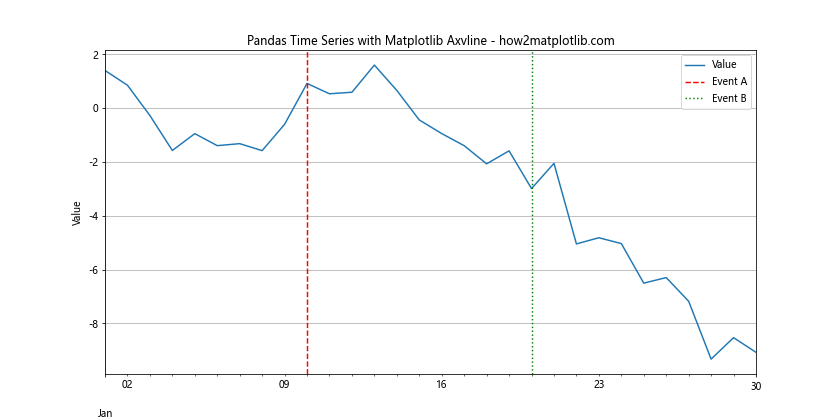
This example demonstrates how to use matplotlib axvline with a pandas DataFrame containing time series data.
Combining Matplotlib Axvline with Seaborn
Seaborn is a statistical data visualization library built on top of matplotlib. Here’s how you can use matplotlib axvline with seaborn:
import matplotlib.pyplot as plt
import seaborn as sns
import pandas as pd
import numpy as np
from datetime import datetime, timedelta

# Create a pandas DataFrame with time series data
start_date = datetime(2023, 1, 1)
dates = [start_date + timedelta(days=i) for i in range(30)]
data = pd.DataFrame({
    'Date': dates,
    'Temperature': np.random.normal(20, 5, 30),
    'Humidity': np.random.normal(60, 10, 30)
})

# Set up the plot
plt.figure(figsize=(12, 6))
sns.lineplot(data=data, x='Date', y='Temperature', label='Temperature')
sns.lineplot(data=data, x='Date', y='Humidity', label='Humidity')

# Add vertical lines
plt.axvline(x=datetime(2023, 1, 15), color='r', linestyle='--', label='Mid-month')

plt.title('Seaborn Plot with Matplotlib Axvline - how2matplotlib.com')
plt.xlabel('Date')
plt.ylabel('Value')
plt.legend()
plt.grid(True)
plt.show()
Output:
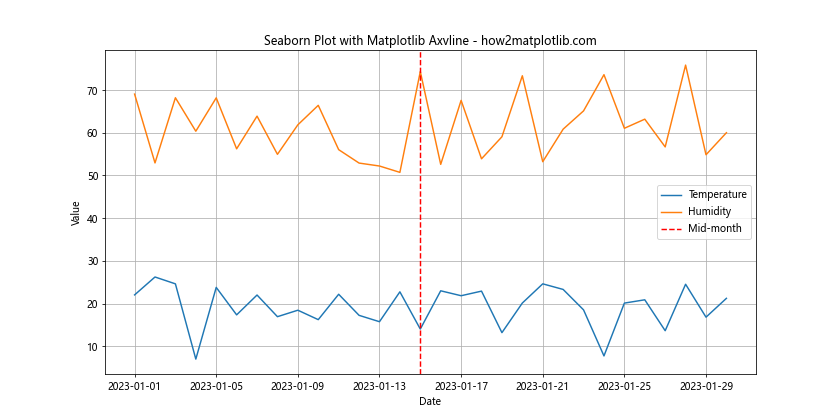
This example shows how to create a seaborn plot and add a vertical line using matplotlib axvline.
Matplotlib axvline datetime Conclusion
Matplotlib axvline datetime is a powerful tool for visualizing time-based data and highlighting important events or time points in your plots. By mastering the techniques and best practices outlined in this comprehensive guide, you’ll be able to create more informative and visually appealing time series visualizations.
Remember to always consider the context of your data when using matplotlib axvline datetime. Choose appropriate colors, line styles, and annotations to make your plots clear and easy to understand. With practice, you’ll be able to create sophisticated time-based visualizations that effectively communicate your data insights.
Whether you’re analyzing stock market trends, visualizing weather patterns, or creating project timelines, matplotlib axvline datetime provides the flexibility and functionality you need to bring your data to life. Keep experimenting with different combinations of matplotlib features to discover new ways of presenting your time series data.