How to Rotate Text in Matplotlib: A Comprehensive Guide
Matplotlib text rotate is a crucial technique for enhancing the readability and aesthetics of your data visualizations. In this comprehensive guide, we’ll explore various methods to rotate text in Matplotlib, providing you with the knowledge and tools to create professional-looking plots with rotated labels, titles, and annotations. We’ll cover everything from basic text rotation to advanced techniques, ensuring you have a thorough understanding of how to implement matplotlib text rotate in your projects.
Understanding the Basics of Matplotlib Text Rotate
Before diving into the specifics of rotating text in Matplotlib, it’s essential to understand the fundamental concepts behind text manipulation in this powerful visualization library. Matplotlib text rotate functionality allows you to adjust the orientation of text elements in your plots, which can be particularly useful when dealing with long labels or when you want to create visually appealing layouts.
The primary method for rotating text in Matplotlib is by using the rotation parameter, which is available in various text-related functions such as plt.xlabel(), plt.ylabel(), plt.title(), and ax.text(). This parameter accepts either a numeric value representing the rotation angle in degrees or a string specifying the desired orientation.
Let’s start with a simple example to demonstrate how to rotate the x-axis labels:
import matplotlib.pyplot as plt

# Create sample data
x = ['Category A', 'Category B', 'Category C', 'Category D']
y = [10, 25, 15, 30]

# Create the plot
plt.figure(figsize=(10, 6))
plt.bar(x, y)

# Rotate x-axis labels
plt.xticks(rotation=45)

# Add labels and title
plt.xlabel('Categories from how2matplotlib.com')
plt.ylabel('Values')
plt.title('Sample Bar Plot with Rotated X-axis Labels')

# Show the plot
plt.tight_layout()
plt.show()
Output:
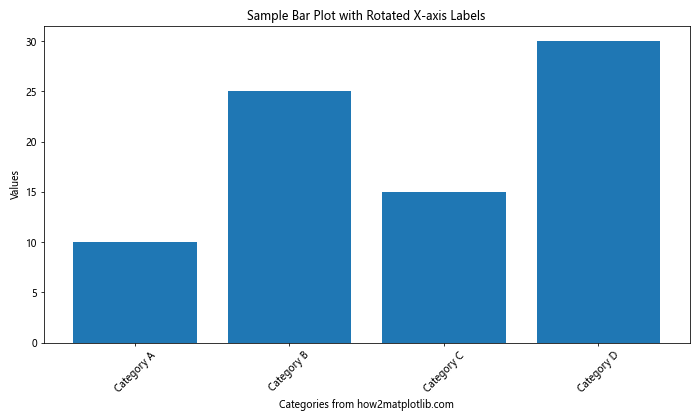
In this example, we use plt.xticks(rotation=45) to rotate the x-axis labels by 45 degrees. This simple adjustment can significantly improve the readability of your plot, especially when dealing with long category names.
Advanced Techniques for Matplotlib Text Rotate
While the basic rotation technique is useful for many scenarios, Matplotlib offers more advanced options for fine-tuning text rotation. Let’s explore some of these techniques to give you greater control over your plot’s appearance.
Rotating Individual Text Elements
Sometimes, you may want to rotate specific text elements rather than all labels on an axis. Matplotlib text rotate functionality allows you to do this using the rotation parameter in various text-related functions. Here’s an example that demonstrates how to rotate individual text annotations:
import matplotlib.pyplot as plt

# Create sample data
x = [1, 2, 3, 4, 5]
y = [2, 4, 6, 8, 10]

# Create the plot
plt.figure(figsize=(10, 6))
plt.plot(x, y, marker='o')

# Add rotated text annotations
plt.text(2, 4, 'Point A from how2matplotlib.com', rotation=30)
plt.text(4, 8, 'Point B from how2matplotlib.com', rotation=-30)

# Add labels and title
plt.xlabel('X-axis')
plt.ylabel('Y-axis')
plt.title('Line Plot with Rotated Text Annotations')

# Show the plot
plt.tight_layout()
plt.show()
Output:
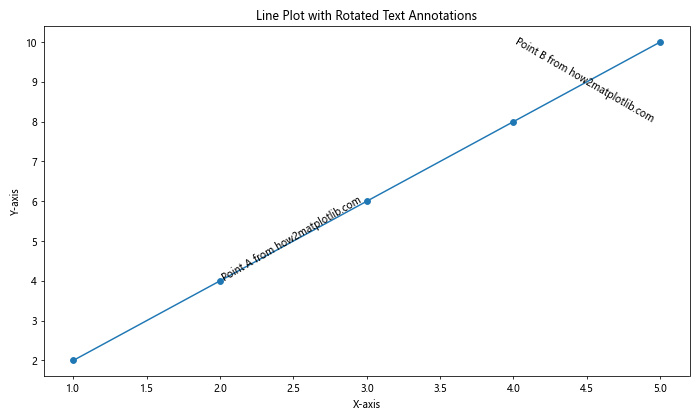
In this example, we use plt.text() to add annotations to specific points on the plot. The rotation parameter allows us to rotate each text element independently, giving us precise control over their orientation.
Using Different Rotation Units
Matplotlib text rotate functionality supports various units for specifying rotation angles. By default, the rotation is specified in degrees, but you can also use radians or even custom units. Here’s an example that demonstrates how to use different rotation units:
import matplotlib.pyplot as plt
import numpy as np

# Create sample data
x = np.linspace(0, 2*np.pi, 100)
y = np.sin(x)

# Create the plot
fig, (ax1, ax2) = plt.subplots(1, 2, figsize=(12, 6))

# Plot using degrees
ax1.plot(x, y)
ax1.set_title('Rotation in Degrees', rotation=45)
ax1.text(np.pi, 0, 'how2matplotlib.com', rotation=90)

# Plot using radians
ax2.plot(x, y)
ax2.set_title('Rotation in Radians', rotation=np.pi/4)
ax2.text(np.pi, 0, 'how2matplotlib.com', rotation=np.pi/2)

# Adjust layout and show the plot
plt.tight_layout()
plt.show()
Output:
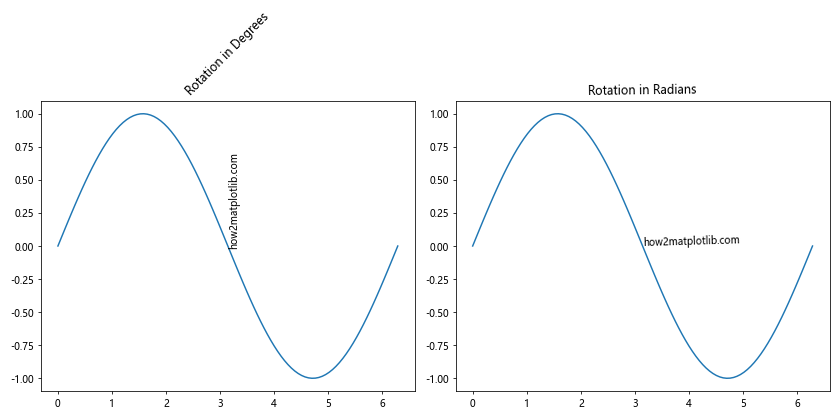
In this example, we create two subplots to demonstrate the use of degrees and radians for text rotation. The left subplot uses degrees (45° and 90°), while the right subplot uses radians (π/4 and π/2) for rotation.
Matplotlib Text Rotate for Axis Labels
Rotating axis labels is one of the most common use cases for matplotlib text rotate functionality. This technique is particularly useful when dealing with long category names or date labels that may overlap when displayed horizontally. Let’s explore different ways to rotate axis labels in Matplotlib.
Rotating X-axis Labels
We’ve already seen a basic example of rotating x-axis labels, but let’s dive deeper into the options available:
import matplotlib.pyplot as plt
import numpy as np

# Create sample data
categories = ['Category A', 'Category B', 'Category C', 'Category D', 'Category E']
values = np.random.randint(10, 100, len(categories))

# Create the plot
fig, (ax1, ax2, ax3) = plt.subplots(1, 3, figsize=(15, 5))

# Plot with 45-degree rotation
ax1.bar(categories, values)
ax1.set_xticklabels(categories, rotation=45, ha='right')
ax1.set_title('45-degree Rotation')

# Plot with vertical labels
ax2.bar(categories, values)
ax2.set_xticklabels(categories, rotation=90, ha='center')
ax2.set_title('Vertical Labels')

# Plot with angled labels and adjusted alignment
ax3.bar(categories, values)
ax3.set_xticklabels(categories, rotation=30, ha='right')
ax3.set_title('30-degree Rotation with Alignment')

# Add a common x-label
fig.text(0.5, 0.02, 'Categories from how2matplotlib.com', ha='center')

# Adjust layout and show the plot
plt.tight_layout()
plt.show()
Output:
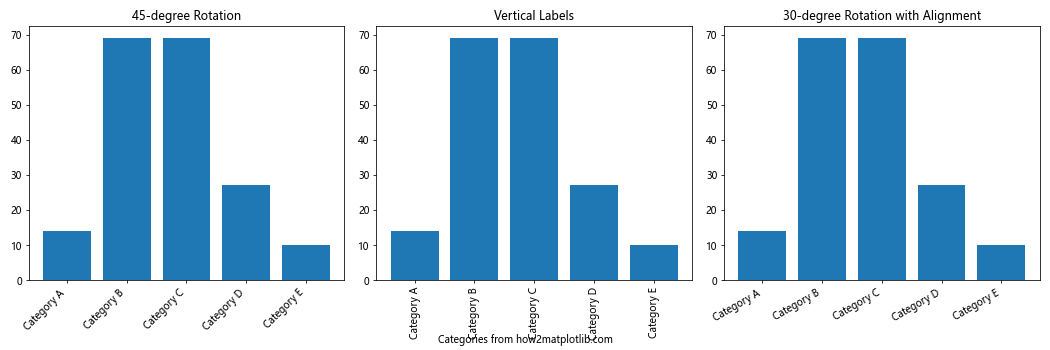
In this example, we demonstrate three different approaches to rotating x-axis labels:
- 45-degree rotation with right alignment
- Vertical (90-degree) rotation with center alignment
- 30-degree rotation with right alignment and adjusted positioning
The ha parameter (horizontal alignment) is used to fine-tune the position of the rotated labels relative to their tick marks.
Rotating Y-axis Labels
While rotating y-axis labels is less common, it can be useful in certain scenarios. Here’s an example of how to rotate y-axis labels:
import matplotlib.pyplot as plt
import numpy as np

# Create sample data
categories = ['Long Category A', 'Long Category B', 'Long Category C', 'Long Category D', 'Long Category E']
values = np.random.randint(10, 100, len(categories))

# Create the plot
fig, (ax1, ax2) = plt.subplots(1, 2, figsize=(12, 6))

# Plot with horizontal y-axis labels
ax1.barh(categories, values)
ax1.set_title('Horizontal Y-axis Labels')

# Plot with rotated y-axis labels
ax2.barh(categories, values)
ax2.set_yticklabels(categories, rotation=45, ha='right')
ax2.set_title('Rotated Y-axis Labels')

# Add a common y-label
fig.text(0.02, 0.5, 'Categories from how2matplotlib.com', va='center', rotation='vertical')

# Adjust layout and show the plot
plt.tight_layout()
plt.show()
Output:
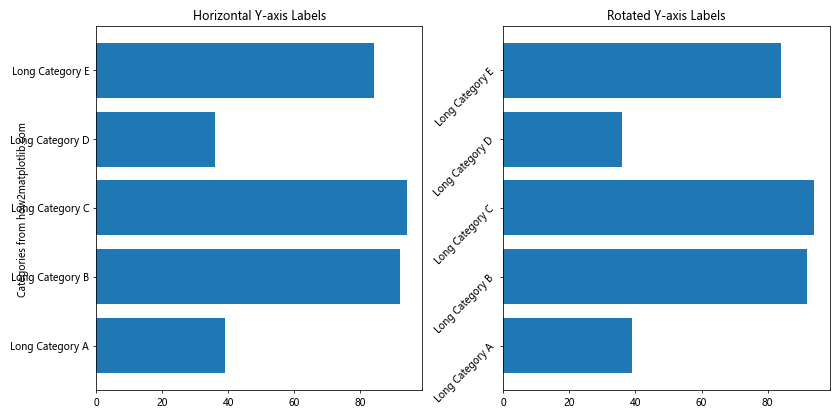
In this example, we create two horizontal bar plots:
- The first plot uses default horizontal y-axis labels
- The second plot rotates the y-axis labels by 45 degrees for improved readability
Matplotlib Text Rotate for Annotations and Text Elements
In addition to axis labels, Matplotlib text rotate functionality can be applied to various other text elements in your plots, such as annotations, legends, and text boxes. Let’s explore some examples of how to rotate these elements.
Rotating Annotations
Annotations are often used to highlight specific points or regions of interest in a plot. Rotating annotations can help you position them more effectively and avoid overlapping with other elements. Here’s an example:
import matplotlib.pyplot as plt
import numpy as np

# Create sample data
x = np.linspace(0, 10, 100)
y = np.sin(x)

# Create the plot
plt.figure(figsize=(10, 6))
plt.plot(x, y)

# Add rotated annotations
plt.annotate('Peak from how2matplotlib.com', xy=(np.pi/2, 1), xytext=(np.pi/2+1, 1.2),
             arrowprops=dict(arrowstyle='->'), rotation=30)
plt.annotate('Trough from how2matplotlib.com', xy=(3*np.pi/2, -1), xytext=(3*np.pi/2+1, -1.2),
             arrowprops=dict(arrowstyle='->'), rotation=-30)

# Add labels and title
plt.xlabel('X-axis')
plt.ylabel('Y-axis')
plt.title('Sine Wave with Rotated Annotations')

# Show the plot
plt.tight_layout()
plt.show()
Output:
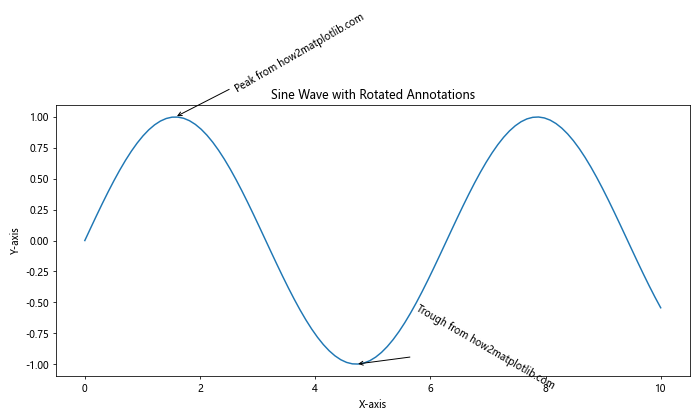
In this example, we use plt.annotate() to add rotated annotations to the peaks and troughs of a sine wave. The rotation parameter allows us to adjust the orientation of the annotation text.
Rotating Legend Labels
While it’s less common to rotate legend labels, there may be situations where this technique can improve the overall layout of your plot. Here’s an example of how to rotate legend labels:
import matplotlib.pyplot as plt
import numpy as np

# Create sample data
x = np.linspace(0, 10, 100)
y1 = np.sin(x)
y2 = np.cos(x)

# Create the plot
plt.figure(figsize=(10, 6))
plt.plot(x, y1, label='Sine Wave from how2matplotlib.com')
plt.plot(x, y2, label='Cosine Wave from how2matplotlib.com')

# Add rotated legend
plt.legend(bbox_to_anchor=(1.05, 1), loc='upper left', borderaxespad=0., labelspacing=1.5)
for text in plt.gca().get_legend().get_texts():
    text.set_rotation(30)

# Add labels and title
plt.xlabel('X-axis')
plt.ylabel('Y-axis')
plt.title('Sine and Cosine Waves with Rotated Legend Labels')

# Adjust layout and show the plot
plt.tight_layout()
plt.show()
Output:
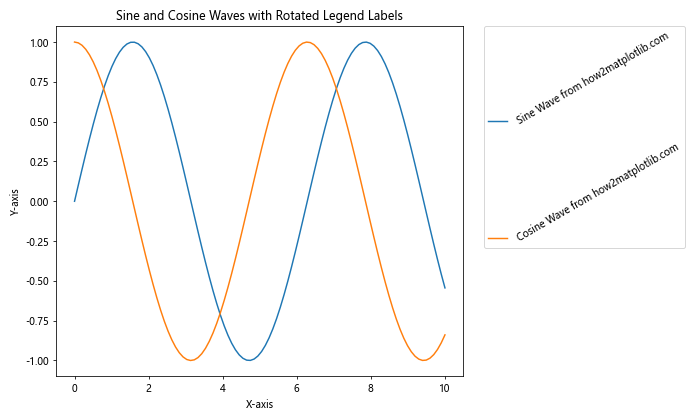
In this example, we create a legend for two curves and then rotate the legend labels by iterating through the legend text objects and applying the set_rotation() method.
Advanced Matplotlib Text Rotate Techniques
Now that we’ve covered the basics of matplotlib text rotate functionality, let’s explore some more advanced techniques that can help you create even more sophisticated and visually appealing plots.
Rotating Text with Custom Transforms
Matplotlib allows you to apply custom transforms to text elements, giving you precise control over their position and orientation. Here’s an example that demonstrates how to use custom transforms for text rotation:
import matplotlib.pyplot as plt
import numpy as np
from matplotlib.transforms import Affine2D

# Create sample data
x = np.linspace(0, 10, 100)
y = np.sin(x)

# Create the plot
fig, ax = plt.subplots(figsize=(10, 6))
ax.plot(x, y)

# Add rotated text with custom transform
for i, (xi, yi) in enumerate(zip(x[::20], y[::20])):
    trans = Affine2D().rotate_deg(30 * np.sin(xi))
    ax.text(xi, yi, f'Point {i} from how2matplotlib.com', transform=trans + ax.transData)

# Add labels and title
ax.set_xlabel('X-axis')
ax.set_ylabel('Y-axis')
ax.set_title('Sine Wave with Custom Rotated Text')

# Show the plot
plt.tight_layout()
plt.show()
Output:
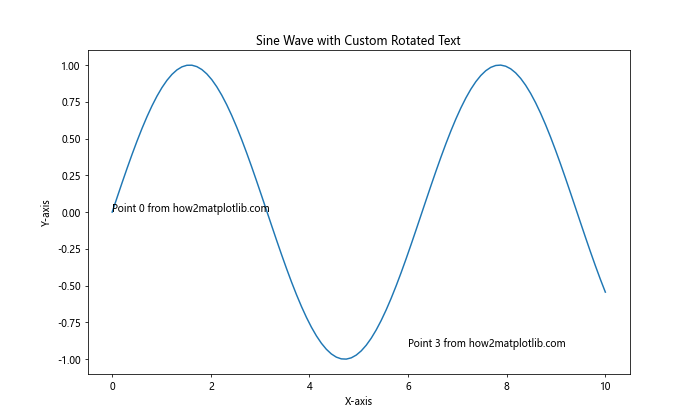
In this example, we use the Affine2D transform to create a custom rotation for each text element. The rotation angle varies based on the x-coordinate, creating a wave-like effect in the text orientation.
Animating Text Rotation
Matplotlib can be used to create animations, including animated text rotations. This can be particularly useful for creating dynamic visualizations or presentations. Here’s an example of how to animate text rotation:
import matplotlib.pyplot as plt
import numpy as np
from matplotlib.animation import FuncAnimation

# Create the plot
fig, ax = plt.subplots(figsize=(8, 8))
ax.set_xlim(-1.5, 1.5)
ax.set_ylim(-1.5, 1.5)

# Create text object
text = ax.text(0, 0, 'Rotating Text from how2matplotlib.com', ha='center', va='center', fontsize=16)

# Animation update function
def update(frame):
    angle = frame * 5  # Increase the angle by 5 degrees per frame
    text.set_rotation(angle)
    return text,

# Create the animation
anim = FuncAnimation(fig, update, frames=72, interval=50, blit=True)

# Add title
ax.set_title('Animated Text Rotation')

# Show the animation
plt.tight_layout()
plt.show()
Output:
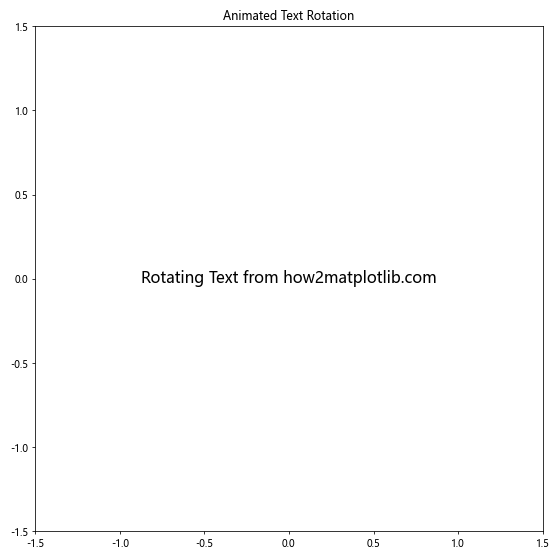
In this example, we create an animation that rotates text around its center point. The update function is called for each frame of the animation, updating the rotation angle of the text object.
Matplotlib Text Rotate for 3D Plots
Matplotlib’s 3D plotting capabilities also support text rotation, allowing you to create informative and visually appealing three-dimensional visualizations. Let’s explore how to rotate text in 3D plots.
Rotating Text in 3D Space
When working with 3D plots, you can rotate text not only around the z-axis but also around the x and y axes. Here’s an example that demonstrates text rotation in 3D space:
import matplotlib.pyplot as plt
import numpy as np
from mpl_toolkits.mplot3d import Axes3D

# Create the plot
fig = plt.figure(figsize=(12, 8))
ax = fig.add_subplot(111, projection='3d')

# Create sample data
x = np.linspace(-5, 5, 100)
y = np.linspace(-5, 5, 100)
X, Y = np.meshgrid(x, y)
Z = np.sin(np.sqrt(X**2 + Y**2))

# Plot the surface
surf = ax.plot_surface(X, Y, Z, cmap='viridis')

# Add rotated text in 3D space
ax.text(0, 0, 2, 'Top Text from how2matplotlib.com', fontsize=12, ha='center', va='center', rotation=45)
ax.text(5, 5, 0, 'Corner Text from how2matplotlib.com', fontsize=12, ha='center', va='center', rotation=30)
ax.text(-5, -5, -1, 'Bottom Text from how2matplotlib.com', fontsize=12, ha='center', va='center', rotation=60)

# Set labels and title
ax.set_xlabel('X-axis')
ax.set_ylabel('Y-axis')
ax.set_zlabel('Z-axis')ax.set_title('3D Surface Plot with Rotated Text')

# Adjust the view angle
ax.view_init(elev=30, azim=45)

# Show the plot
plt.tight_layout()
plt.show()
In this example, we create a 3D surface plot and add rotated text at different positions in the 3D space. The rotation parameter in the ax.text() function allows us to rotate the text around the z-axis. To achieve more complex rotations, you can use the zdir parameter to specify the axis of rotation.
Best Practices for Matplotlib Text Rotate
When using matplotlib text rotate functionality, it’s important to follow some best practices to ensure your plots are both visually appealing and easy to read. Here are some tips to keep in mind:
- Consistency: Try to maintain a consistent rotation angle for similar elements throughout your plot. This helps create a cohesive and professional look.
Readability: While rotated text can solve spacing issues, make sure it doesn’t compromise readability. Avoid extreme rotation angles that make text difficult to read.
Alignment: Pay attention to the alignment of rotated text. Use the
ha(horizontal alignment) andva(vertical alignment) parameters to fine-tune the position of your text.Font size: Adjust the font size of rotated text as needed. Sometimes, rotated text may require a slightly larger font size to maintain readability.
Spacing: When rotating axis labels, make sure to provide enough space to prevent overlapping. You can use
plt.tight_layout()or adjust subplot parameters to optimize the layout.
Let’s implement these best practices in an example: