How to Draw a 3D Cube using Matplotlib in Python
How to Draw 3D Cube using Matplotlib in Python is an essential skill for data visualization enthusiasts and Python programmers. Matplotlib is a powerful library that allows you to create various types of plots, including 3D visualizations. In this comprehensive guide, we’ll explore the process of drawing a 3D cube using Matplotlib, providing detailed explanations and numerous code examples to help you master this technique.
Understanding the Basics of 3D Plotting in Matplotlib
Before we dive into drawing a 3D cube using Matplotlib in Python, it’s crucial to understand the fundamentals of 3D plotting in this library. Matplotlib provides a module called mpl_toolkits.mplot3d that enables us to create three-dimensional plots. This module extends Matplotlib’s functionality to support 3D graphics.
To get started with 3D plotting, you need to import the necessary modules and create a figure with a 3D axes. Here’s a basic example:
import matplotlib.pyplot as plt
from mpl_toolkits.mplot3d import Axes3D

fig = plt.figure()
ax = fig.add_subplot(111, projection='3d')
ax.set_xlabel('X-axis')
ax.set_ylabel('Y-axis')
ax.set_zlabel('Z-axis')
ax.set_title('How to Draw 3D Cube using Matplotlib in Python - Basic 3D Plot')
plt.show()
Output:
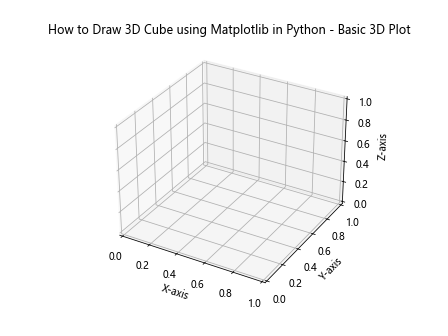
This code creates a simple 3D plot with labeled axes. It’s the foundation for drawing more complex 3D shapes, including cubes.
Setting Up the Environment for Drawing a 3D Cube
To draw a 3D cube using Matplotlib in Python, you’ll need to set up your environment properly. Make sure you have Matplotlib installed in your Python environment. You can install it using pip:
pip install matplotlib
Once you have Matplotlib installed, you’re ready to start drawing 3D cubes. Let’s begin with a simple example of how to draw a 3D cube using Matplotlib in Python:
import matplotlib.pyplot as plt
from mpl_toolkits.mplot3d import Axes3D
import numpy as np

fig = plt.figure()
ax = fig.add_subplot(111, projection='3d')

# Define the vertices of the cube
vertices = np.array([[0, 0, 0],
                     [1, 0, 0],
                     [1, 1, 0],
                     [0, 1, 0],
                     [0, 0, 1],
                     [1, 0, 1],
                     [1, 1, 1],
                     [0, 1, 1]])

# Define the edges of the cube
edges = [[0, 1], [1, 2], [2, 3], [3, 0],
         [4, 5], [5, 6], [6, 7], [7, 4],
         [0, 4], [1, 5], [2, 6], [3, 7]]

# Plot the vertices
ax.scatter3D(vertices[:, 0], vertices[:, 1], vertices[:, 2])

# Plot the edges
for edge in edges:
    ax.plot3D(vertices[edge, 0], vertices[edge, 1], vertices[edge, 2], 'b')

ax.set_title('How to Draw 3D Cube using Matplotlib in Python')
plt.show()
Output:
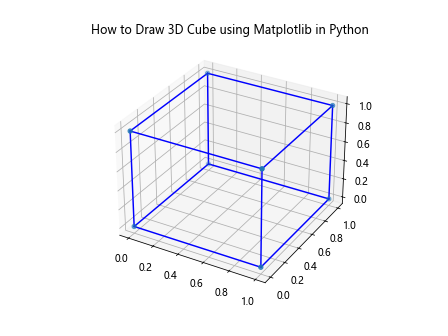
This example demonstrates how to draw a basic 3D cube using Matplotlib in Python. We define the vertices of the cube and the edges connecting them, then use scatter3D to plot the vertices and plot3D to draw the edges.
Understanding the Geometry of a 3D Cube
Before we delve deeper into drawing 3D cubes using Matplotlib in Python, it’s important to understand the geometry of a cube. A cube is a three-dimensional solid object with six square faces, twelve edges, and eight vertices. Each face is perpendicular to its adjacent faces, and all edges are of equal length.
When drawing a 3D cube using Matplotlib in Python, we need to represent these geometric properties. Here’s an example that illustrates the structure of a cube:
import matplotlib.pyplot as plt
from mpl_toolkits.mplot3d import Axes3D
import numpy as np

fig = plt.figure()
ax = fig.add_subplot(111, projection='3d')

# Define the vertices of the cube
vertices = np.array([[0, 0, 0],
                     [1, 0, 0],
                     [1, 1, 0],
                     [0, 1, 0],
                     [0, 0, 1],
                     [1, 0, 1],
                     [1, 1, 1],
                     [0, 1, 1]])

# Define the faces of the cube
faces = [[0, 1, 2, 3],
         [4, 5, 6, 7],
         [0, 1, 5, 4],
         [2, 3, 7, 6],
         [1, 2, 6, 5],
         [0, 3, 7, 4]]

# Plot the faces
for face in faces:
    x = vertices[face, 0]
    y = vertices[face, 1]
    z = vertices[face, 2]
    ax.plot_surface(x.reshape(2, 2), y.reshape(2, 2), z.reshape(2, 2), alpha=0.5)

ax.set_title('How to Draw 3D Cube using Matplotlib in Python - Cube Structure')
plt.show()
Output:
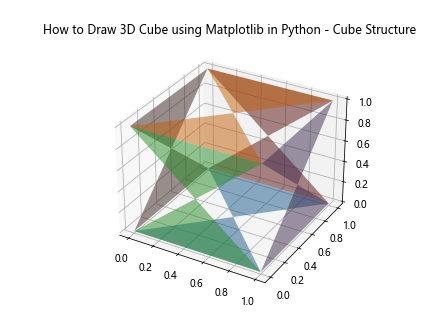
This example shows how to represent the faces of a cube when drawing a 3D cube using Matplotlib in Python. We define the vertices and faces of the cube, then use plot_surface to draw each face with some transparency.
Drawing a Solid 3D Cube
Now that we understand the structure of a cube, let’s learn how to draw a solid 3D cube using Matplotlib in Python. We’ll use the art3d module to create a collection of polygons representing the cube’s faces:
import matplotlib.pyplot as plt
from mpl_toolkits.mplot3d import Axes3D
from mpl_toolkits.mplot3d.art3d import Poly3DCollection
import numpy as np

fig = plt.figure()
ax = fig.add_subplot(111, projection='3d')

# Define the vertices of the cube
vertices = np.array([[0, 0, 0],
                     [1, 0, 0],
                     [1, 1, 0],
                     [0, 1, 0],
                     [0, 0, 1],
                     [1, 0, 1],
                     [1, 1, 1],
                     [0, 1, 1]])

# Define the faces of the cube
faces = [[vertices[0], vertices[1], vertices[2], vertices[3]],
         [vertices[4], vertices[5], vertices[6], vertices[7]],
         [vertices[0], vertices[1], vertices[5], vertices[4]],
         [vertices[2], vertices[3], vertices[7], vertices[6]],
         [vertices[1], vertices[2], vertices[6], vertices[5]],
         [vertices[0], vertices[3], vertices[7], vertices[4]]]

# Create a Poly3DCollection
cube = Poly3DCollection(faces, alpha=0.8, linewidths=1, edgecolors='r')
cube.set_facecolor('cyan')

# Add the cube to the plot
ax.add_collection3d(cube)

ax.set_xlim([0, 1])
ax.set_ylim([0, 1])
ax.set_zlim([0, 1])

ax.set_title('How to Draw 3D Cube using Matplotlib in Python - Solid Cube')
plt.show()
Output:
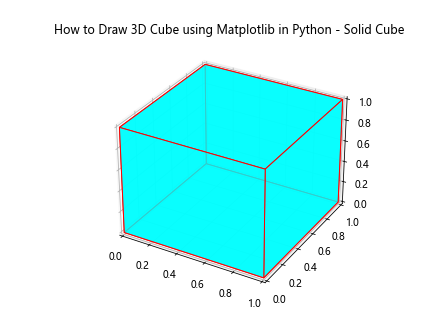
This example demonstrates how to draw a solid 3D cube using Matplotlib in Python. We create a Poly3DCollection object to represent the cube’s faces and add it to the plot using add_collection3d.
Adding Color and Transparency to the 3D Cube
When drawing a 3D cube using Matplotlib in Python, you can enhance its appearance by adding color and adjusting transparency. Here’s an example that shows how to create a colorful, semi-transparent cube:
import matplotlib.pyplot as plt
from mpl_toolkits.mplot3d import Axes3D
from mpl_toolkits.mplot3d.art3d import Poly3DCollection
import numpy as np

fig = plt.figure()
ax = fig.add_subplot(111, projection='3d')

# Define the vertices of the cube
vertices = np.array([[0, 0, 0],
                     [1, 0, 0],
                     [1, 1, 0],
                     [0, 1, 0],
                     [0, 0, 1],
                     [1, 0, 1],
                     [1, 1, 1],
                     [0, 1, 1]])

# Define the faces of the cube
faces = [[vertices[0], vertices[1], vertices[2], vertices[3]],
         [vertices[4], vertices[5], vertices[6], vertices[7]],
         [vertices[0], vertices[1], vertices[5], vertices[4]],
         [vertices[2], vertices[3], vertices[7], vertices[6]],
         [vertices[1], vertices[2], vertices[6], vertices[5]],
         [vertices[0], vertices[3], vertices[7], vertices[4]]]

# Create a Poly3DCollection with different colors for each face
colors = ['red', 'green', 'blue', 'yellow', 'orange', 'purple']
cube = Poly3DCollection(faces, alpha=0.5, linewidths=1, edgecolors='black')
cube.set_facecolors(colors)

# Add the cube to the plot
ax.add_collection3d(cube)

ax.set_xlim([0, 1])
ax.set_ylim([0, 1])
ax.set_zlim([0, 1])

ax.set_title('How to Draw 3D Cube using Matplotlib in Python - Colorful Cube')
plt.show()
Output:
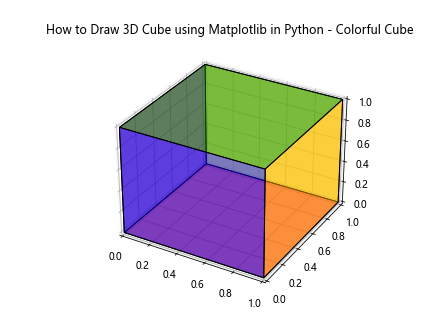
This example shows how to draw a 3D cube using Matplotlib in Python with different colors for each face and a semi-transparent appearance. We use the set_facecolors method to assign colors to the cube’s faces.
Rotating the 3D Cube
One of the advantages of drawing a 3D cube using Matplotlib in Python is the ability to rotate and view it from different angles. Here’s an example that demonstrates how to create an animated rotation of the cube:
import matplotlib.pyplot as plt
from mpl_toolkits.mplot3d import Axes3D
from mpl_toolkits.mplot3d.art3d import Poly3DCollection
import numpy as np
from matplotlib.animation import FuncAnimation

fig = plt.figure()
ax = fig.add_subplot(111, projection='3d')

# Define the vertices of the cube
vertices = np.array([[0, 0, 0],
                     [1, 0, 0],
                     [1, 1, 0],
                     [0, 1, 0],
                     [0, 0, 1],
                     [1, 0, 1],
                     [1, 1, 1],
                     [0, 1, 1]])

# Define the faces of the cube
faces = [[vertices[0], vertices[1], vertices[2], vertices[3]],
         [vertices[4], vertices[5], vertices[6], vertices[7]],
         [vertices[0], vertices[1], vertices[5], vertices[4]],
         [vertices[2], vertices[3], vertices[7], vertices[6]],
         [vertices[1], vertices[2], vertices[6], vertices[5]],
         [vertices[0], vertices[3], vertices[7], vertices[4]]]

# Create a Poly3DCollection
cube = Poly3DCollection(faces, alpha=0.8, linewidths=1, edgecolors='r')
cube.set_facecolor('cyan')

# Add the cube to the plot
ax.add_collection3d(cube)

ax.set_xlim([-1, 2])
ax.set_ylim([-1, 2])
ax.set_zlim([-1, 2])

ax.set_title('How to Draw 3D Cube using Matplotlib in Python - Rotating Cube')

def rotate(angle):
    ax.view_init(elev=10., azim=angle)

ani = FuncAnimation(fig, rotate, frames=np.linspace(0, 360, 100), interval=50)
plt.show()
Output:
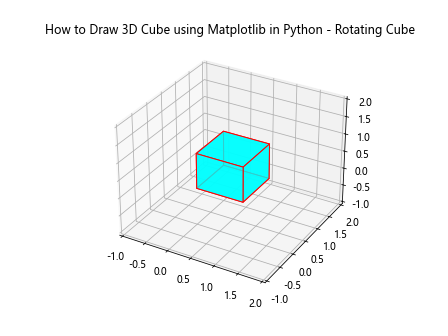
This example demonstrates how to create an animated rotation when drawing a 3D cube using Matplotlib in Python. We use the FuncAnimation class to update the viewing angle of the plot, creating a smooth rotation effect.
Adding Textures to the 3D Cube
To make your 3D cube more visually interesting, you can add textures to its faces. Here’s an example of how to draw a 3D cube using Matplotlib in Python with textured faces:
import matplotlib.pyplot as plt
from mpl_toolkits.mplot3d import Axes3D
import numpy as np

fig = plt.figure()
ax = fig.add_subplot(111, projection='3d')

# Define the vertices of the cube
vertices = np.array([[0, 0, 0],
                     [1, 0, 0],
                     [1, 1, 0],
                     [0, 1, 0],
                     [0, 0, 1],
                     [1, 0, 1],
                     [1, 1, 1],
                     [0, 1, 1]])

# Define the faces of the cube
faces = [[0, 1, 2, 3],
         [4, 5, 6, 7],
         [0, 1, 5, 4],
         [2, 3, 7, 6],
         [1, 2, 6, 5],
         [0, 3, 7, 4]]

# Create textures for each face
textures = []
for i in range(6):
    texture = np.random.rand(10, 10)
    textures.append(texture)

# Plot the faces with textures
for i, face in enumerate(faces):
    x = vertices[face, 0]
    y = vertices[face, 1]
    z = vertices[face, 2]
    ax.plot_surface(x.reshape(2, 2), y.reshape(2, 2), z.reshape(2, 2), facecolors=plt.cm.viridis(textures[i]), shade=False)

ax.set_title('How to Draw 3D Cube using Matplotlib in Python - Textured Cube')
plt.show()
Output:
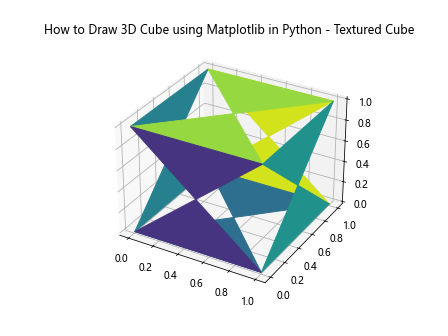
This example shows how to draw a 3D cube using Matplotlib in Python with textured faces. We create random textures for each face and apply them using the facecolors parameter in the plot_surface function.
Drawing Multiple 3D Cubes
Sometimes you may want to draw multiple 3D cubes using Matplotlib in Python. Here’s an example that demonstrates how to create a scene with multiple cubes:
import matplotlib.pyplot as plt
from mpl_toolkits.mplot3d import Axes3D
from mpl_toolkits.mplot3d.art3d import Poly3DCollection
import numpy as np

fig = plt.figure()
ax = fig.add_subplot(111, projection='3d')

def create_cube(center, size):
    # Define the vertices of the cube
    vertices = np.array([[0, 0, 0],
                         [1, 0, 0],
                         [1, 1, 0],
                         [0, 1, 0],
                         [0, 0,1],
                         [1, 0, 1],
                         [1, 1, 1],
                         [0, 1, 1]])

    vertices = vertices * size + center

    # Define the faces of the cube
    faces = [[vertices[0], vertices[1], vertices[2], vertices[3]],
             [vertices[4], vertices[5], vertices[6], vertices[7]],
             [vertices[0], vertices[1], vertices[5], vertices[4]],
             [vertices[2], vertices[3], vertices[7], vertices[6]],
             [vertices[1], vertices[2], vertices[6], vertices[5]],
             [vertices[0], vertices[3], vertices[7], vertices[4]]]

    return Poly3DCollection(faces, alpha=0.8, linewidths=1, edgecolors='r')

# Create multiple cubes
cube1 = create_cube([0, 0, 0], 1)
cube2 = create_cube([2, 0, 0], 0.5)
cube3 = create_cube([0, 2, 0], 0.7)

# Add the cubes to the plot
ax.add_collection3d(cube1)
ax.add_collection3d(cube2)
ax.add_collection3d(cube3)

ax.set_xlim([-1, 3])
ax.set_ylim([-1, 3])
ax.set_zlim([-1, 2])

ax.set_title('How to Draw 3D Cube using Matplotlib in Python - Multiple Cubes')
plt.show()
Output:
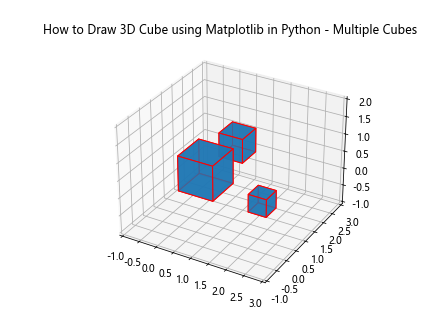
This example demonstrates how to draw multiple 3D cubes using Matplotlib in Python. We create a function to generate cubes of different sizes and positions, then add them to the plot.
Adding Shadows to 3D Cubes
To enhance the realism of your 3D cubes, you can add shadows. Here’s an example of how to draw a 3D cube using Matplotlib in Python with a shadow effect:
import matplotlib.pyplot as plt
from mpl_toolkits.mplot3d import Axes3D
from mpl_toolkits.mplot3d.art3d import Poly3DCollection
import numpy as np

fig = plt.figure()
ax = fig.add_subplot(111, projection='3d')

# Define the vertices of the cube
vertices = np.array([[0, 0, 0],
                     [1, 0, 0],
                     [1, 1, 0],
                     [0, 1, 0],
                     [0, 0, 1],
                     [1, 0, 1],
                     [1, 1, 1],
                     [0, 1, 1]])

# Define the faces of the cube
faces = [[vertices[0], vertices[1], vertices[2], vertices[3]],
         [vertices[4], vertices[5], vertices[6], vertices[7]],
         [vertices[0], vertices[1], vertices[5], vertices[4]],
         [vertices[2], vertices[3], vertices[7], vertices[6]],
         [vertices[1], vertices[2], vertices[6], vertices[5]],
         [vertices[0], vertices[3], vertices[7], vertices[4]]]

# Create a Poly3DCollection for the cube
cube = Poly3DCollection(faces, alpha=0.8, linewidths=1, edgecolors='r')
cube.set_facecolor('cyan')

# Add the cube to the plot
ax.add_collection3d(cube)

# Create a shadow on the xy-plane
shadow_vertices = vertices.copy()
shadow_vertices[:, 2] = 0  # Project onto xy-plane
shadow_faces = [[shadow_vertices[0], shadow_vertices[1], shadow_vertices[2], shadow_vertices[3]]]
shadow = Poly3DCollection(shadow_faces, alpha=0.2, linewidths=1, edgecolors='k')
shadow.set_facecolor('gray')

# Add the shadow to the plot
ax.add_collection3d(shadow)

ax.set_xlim([0, 1.5])
ax.set_ylim([0, 1.5])
ax.set_zlim([0, 1.5])

ax.set_title('How to Draw 3D Cube using Matplotlib in Python - Cube with Shadow')
plt.show()
Output:
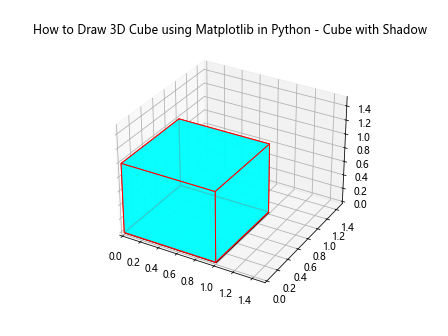
This example shows how to draw a 3D cube using Matplotlib in Python with a shadow effect. We create a projected shadow of the cube on the xy-plane and add it to the plot with reduced opacity.
Adding Labels and Annotations to 3D Cubes
When drawing a 3D cube using Matplotlib in Python, you may want to add labels or annotations to highlight specific features. Here’s an example that shows how to add labels to the vertices of a cube:
import matplotlib.pyplot as plt
from mpl_toolkits.mplot3d import Axes3D
from mpl_toolkits.mplot3d.art3d import Poly3DCollection
import numpy as np

fig = plt.figure()
ax = fig.add_subplot(111, projection='3d')

# Define the vertices of the cube
vertices = np.array([[0, 0, 0],
                     [1, 0, 0],
                     [1, 1, 0],
                     [0, 1, 0],
                     [0, 0, 1],
                     [1, 0, 1],
                     [1, 1, 1],
                     [0, 1, 1]])

# Define the faces of the cube
faces = [[vertices[0], vertices[1], vertices[2], vertices[3]],
         [vertices[4], vertices[5], vertices[6], vertices[7]],
         [vertices[0], vertices[1], vertices[5], vertices[4]],
         [vertices[2], vertices[3], vertices[7], vertices[6]],
         [vertices[1], vertices[2], vertices[6], vertices[5]],
         [vertices[0], vertices[3], vertices[7], vertices[4]]]

# Create a Poly3DCollection
cube = Poly3DCollection(faces, alpha=0.8, linewidths=1, edgecolors='r')
cube.set_facecolor('cyan')

# Add the cube to the plot
ax.add_collection3d(cube)

# Add labels to the vertices
for i, v in enumerate(vertices):
    ax.text(v[0], v[1], v[2], f'V{i}', fontsize=10)

ax.set_xlim([0, 1])
ax.set_ylim([0, 1])
ax.set_zlim([0, 1])

ax.set_title('How to Draw 3D Cube using Matplotlib in Python - Labeled Vertices')
plt.show()
Output:
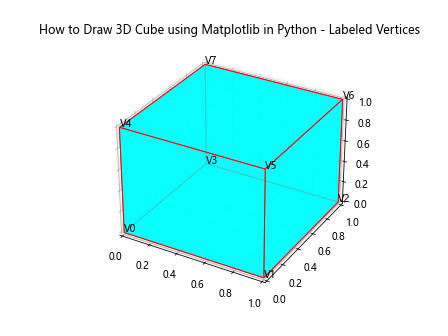
This example shows how to add labels to the vertices when drawing a 3D cube using Matplotlib in Python. We use the text function to add labels at each vertex position.
Creating a Wire Frame 3D Cube
Sometimes, you may want to create a wire frame representation of a 3D cube. Here’s an example of how to draw a wire frame 3D cube using Matplotlib in Python:
import matplotlib.pyplot as plt
from mpl_toolkits.mplot3d import Axes3D
import numpy as np

fig = plt.figure()
ax = fig.add_subplot(111, projection='3d')

# Define the vertices of the cube
vertices = np.array([[0, 0, 0],
                     [1, 0, 0],
                     [1, 1, 0],
                     [0, 1, 0],
                     [0, 0, 1],
                     [1, 0, 1],
                     [1, 1, 1],
                     [0, 1, 1]])

# Define the edges of the cube
edges = [[0, 1], [1, 2], [2, 3], [3, 0],  # Bottom face
         [4, 5], [5, 6], [6, 7], [7, 4],  # Top face
         [0, 4], [1, 5], [2, 6], [3, 7]]  # Connecting edges

# Plot the edges
for edge in edges:
    ax.plot3D(*zip(*vertices[edge]), color='b')

ax.set_xlim([0, 1])
ax.set_ylim([0, 1])
ax.set_zlim([0, 1])

ax.set_title('How to Draw 3D Cube using Matplotlib in Python - Wire Frame')
plt.show()
Output:
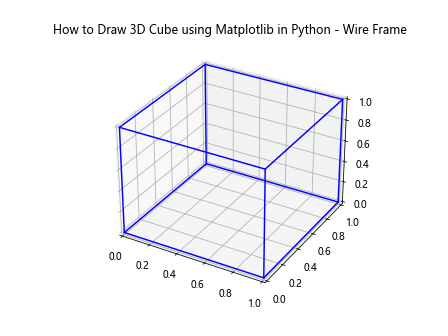
This example demonstrates how to draw a wire frame 3D cube using Matplotlib in Python. We define the edges of the cube and use plot3D to draw each edge as a line segment.
Conclusion
In this comprehensive guide, we’ve explored various techniques for drawing 3D cubes using Matplotlib in Python. We’ve covered everything from basic cube creation to advanced visualization techniques such as adding textures, creating exploded views, and combining multiple visualization methods.
By mastering these techniques, you’ll be able to create impressive 3D visualizations of cubes for a wide range of applications, from data visualization to educational purposes. Remember that Matplotlib is a powerful library with many more features to explore, so don’t hesitate to experimentand combine different techniques to create unique and informative visualizations.
Here’s a summary of the key points we’ve covered on how to draw 3D cubes using Matplotlib in Python:
- Setting up the environment and importing necessary modules
- Understanding the geometry of a 3D cube
- Drawing basic solid and wire frame cubes
- Adding color and transparency to cubes
- Rotating 3D cubes for dynamic visualizations
- Adding textures to cube faces
- Creating multiple cubes in a single plot
- Adding shadows to enhance realism
- Creating exploded views for better understanding of cube structure
- Adding labels and annotations to cubes
- Combining multiple visualization techniques
As you continue to work with Matplotlib and 3D visualizations, keep in mind that practice and experimentation are key to mastering these techniques. Don’t be afraid to try new combinations or adapt these examples to your specific needs.
Additional Tips for Drawing 3D Cubes with Matplotlib
Here are some additional tips to keep in mind when drawing 3D cubes using Matplotlib in Python:
- Perspective vs. Orthographic Projection: Matplotlib’s 3D plotting uses a perspective projection by default. If you want to switch to an orthographic projection, you can use the
ax.set_proj_type('ortho')method. Adjusting the Viewing Angle: Use
ax.view_init(elev, azim)to adjust the viewing angle of your 3D plot. This can help you showcase your cube from the most informative angle.Using Different Colormaps: Experiment with different colormaps when adding textures or colors to your cubes. Matplotlib offers a wide range of colormaps that can make your visualizations more appealing or informative.
Adding Lighting Effects: While Matplotlib doesn’t have built-in 3D lighting, you can simulate lighting effects by carefully choosing face colors and shading.
Incorporating Interactivity: Consider using Matplotlib’s interactive features to allow users to rotate or zoom the cube dynamically.
Optimizing Performance: For complex scenes with many cubes, consider using lower-level Matplotlib functions or other libraries like Mayavi for better performance.
Let’s explore a few more advanced examples to further illustrate these tips: