Comprehensive Guide to Matplotlib.artist.Artist.get_contains() in Python
Matplotlib.artist.Artist.get_contains() in Python is a powerful method that plays a crucial role in creating interactive visualizations. This function is an essential component of the Matplotlib library, which is widely used for creating static, animated, and interactive plots in Python. In this comprehensive guide, we’ll explore the ins and outs of Matplotlib.artist.Artist.get_contains(), its applications, and how it can enhance your data visualization projects.
The Importance of Matplotlib.artist.Artist.get_contains() in Interactive Visualizations
Matplotlib.artist.Artist.get_contains() plays a crucial role in creating interactive visualizations. By understanding and utilizing this method, you can enhance your plots with features like:
- Hover effects
- Click events
- Custom tooltips
- Interactive data exploration
Let’s explore an example that demonstrates how Matplotlib.artist.Artist.get_contains() can be used to create a simple hover effect:
import matplotlib.pyplot as plt
import numpy as np

fig, ax = plt.subplots()
scatter = ax.scatter(np.random.rand(20), np.random.rand(20), s=100)

def hover(event):
    cont, ind = scatter.contains(event)
    if cont:
        print(f"Hovered over point at index {ind['ind'][0]}")

fig.canvas.mpl_connect('motion_notify_event', hover)

plt.title("Interactive Scatter Plot - how2matplotlib.com")
plt.show()
Output:
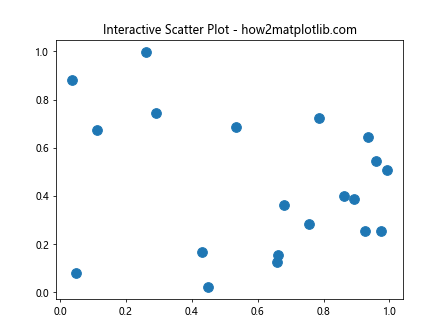
In this example, we create a scatter plot and use Matplotlib.artist.Artist.get_contains() implicitly through the contains method of the scatter artist. We define a hover function that checks if the mouse is over a point and prints the index of the hovered point.
Applying Matplotlib.artist.Artist.get_contains() to Different Artist Types
Matplotlib.artist.Artist.get_contains() can be applied to various types of artists in Matplotlib. Let’s explore how it works with different plot elements:
Bar Plots
import matplotlib.pyplot as plt
import numpy as np

fig, ax = plt.subplots()
x = np.arange(5)
y = np.random.rand(5)
bars = ax.bar(x, y)

def bar_hover(event):
    for bar in bars:
        cont, _ = bar.contains(event)
        if cont:
            bar.set_facecolor('red')
        else:
            bar.set_facecolor('blue')
    fig.canvas.draw_idle()

fig.canvas.mpl_connect('motion_notify_event', bar_hover)

plt.title("Interactive Bar Plot - how2matplotlib.com")
plt.show()
Output:
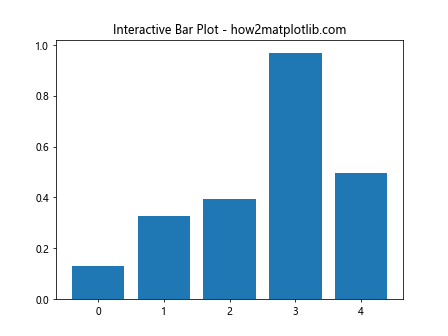
This example demonstrates how to use Matplotlib.artist.Artist.get_contains() with bar plots to create an interactive hover effect. When the cursor hovers over a bar, it changes color to red.
Advanced Techniques with Matplotlib.artist.Artist.get_contains()
Now that we’ve covered the basics, let’s explore some advanced techniques using Matplotlib.artist.Artist.get_contains():
Custom Tooltips
import matplotlib.pyplot as plt
import numpy as np

fig, ax = plt.subplots()
x = np.random.rand(20)
y = np.random.rand(20)
scatter = ax.scatter(x, y, s=100)

annot = ax.annotate("", xy=(0,0), xytext=(20,20), textcoords="offset points",
                    bbox=dict(boxstyle="round", fc="w"),
                    arrowprops=dict(arrowstyle="->"))
annot.set_visible(False)

def update_annot(ind):
    pos = scatter.get_offsets()[ind["ind"][0]]
    annot.xy = pos
    text = f"Point: {pos}"
    annot.set_text(text)

def hover(event):
    vis = annot.get_visible()
    if event.inaxes == ax:
        cont, ind = scatter.contains(event)
        if cont:
            update_annot(ind)
            annot.set_visible(True)
            fig.canvas.draw_idle()
        else:
            if vis:
                annot.set_visible(False)
                fig.canvas.draw_idle()

fig.canvas.mpl_connect("motion_notify_event", hover)

plt.title("Custom Tooltips - how2matplotlib.com")
plt.show()
Output:
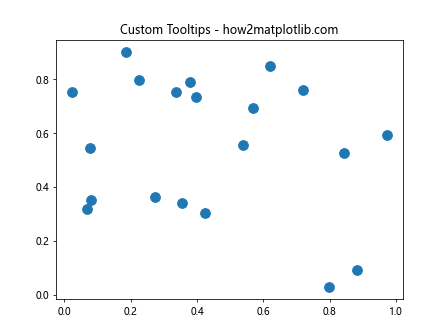
This example demonstrates how to create custom tooltips using Matplotlib.artist.Artist.get_contains(). When the cursor hovers over a point, a tooltip appears with the point’s coordinates.
Interactive Legend
import matplotlib.pyplot as plt
import numpy as np

fig, ax = plt.subplots()
x = np.linspace(0, 10, 100)
line1, = ax.plot(x, np.sin(x), label='Sin')
line2, = ax.plot(x, np.cos(x), label='Cos')

leg = ax.legend()

def on_pick(event):
    legend = event.artist
    isVisible = legend.get_visible()
    legend.set_visible(not isVisible)
    fig.canvas.draw()

for legline in leg.get_lines():
    legline.set_picker(5)

fig.canvas.mpl_connect('pick_event', on_pick)

plt.title("Interactive Legend - how2matplotlib.com")
plt.show()
Output:
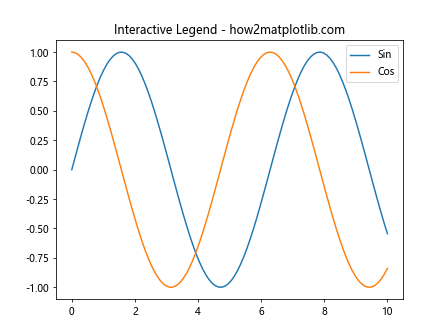
In this example, we use Matplotlib.artist.Artist.get_contains() implicitly through the picker functionality to create an interactive legend. Clicking on a legend item toggles the visibility of the corresponding line.
Combining Matplotlib.artist.Artist.get_contains() with Other Matplotlib Features
Matplotlib.artist.Artist.get_contains() can be combined with other Matplotlib features to create even more powerful visualizations. Let’s explore some examples:
Animation with Interactive Elements
import matplotlib.pyplot as plt
import numpy as np
from matplotlib.animation import FuncAnimation

fig, ax = plt.subplots()
line, = ax.plot([], [], 'r-')
point, = ax.plot([], [], 'bo', markersize=10)

ax.set_xlim(0, 2*np.pi)
ax.set_ylim(-1, 1)

def init():
    line.set_data([], [])
    point.set_data([], [])
    return line, point

def animate(frame):
    x = np.linspace(0, frame, 100)
    y = np.sin(x)
    line.set_data(x, y)
    point.set_data(frame, np.sin(frame))
    return line, point

def on_click(event):
    if point.contains(event)[0]:
        print(f"Clicked on point at x={event.xdata:.2f}, y={event.ydata:.2f}")

fig.canvas.mpl_connect('button_press_event', on_click)

anim = FuncAnimation(fig, animate, frames=np.linspace(0, 2*np.pi, 100),
                     init_func=init, blit=True)

plt.title("Animated Plot with Interactive Point - how2matplotlib.com")
plt.show()
Output:
This example combines animation with an interactive point that uses Matplotlib.artist.Artist.get_contains() to detect clicks.
Subplots with Shared Interactivity
import matplotlib.pyplot as plt
import numpy as np

fig, (ax1, ax2) = plt.subplots(1, 2, figsize=(10, 5))

x = np.linspace(0, 10, 100)
line1, = ax1.plot(x, np.sin(x), 'b-')
line2, = ax2.plot(x, np.cos(x), 'r-')

def on_hover(event):
    for ax in [ax1, ax2]:
        if ax == event.inaxes:
            line = ax.get_lines()[0]
            contains, _ = line.contains(event)
            if contains:
                line.set_linewidth(3)
            else:
                line.set_linewidth(1)
    fig.canvas.draw_idle()

fig.canvas.mpl_connect('motion_notify_event', on_hover)

plt.suptitle("Subplots with Shared Interactivity - how2matplotlib.com")
plt.show()
Output:
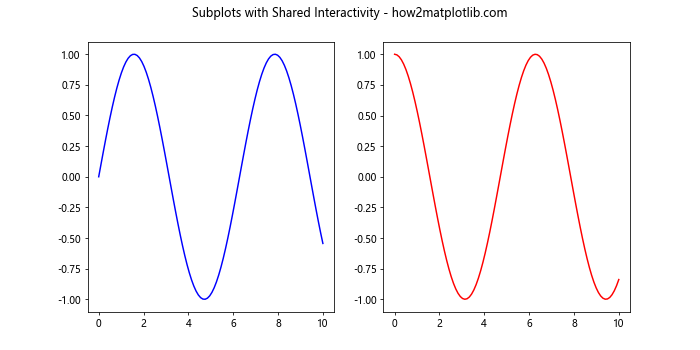
This example demonstrates how to use Matplotlib.artist.Artist.get_contains() to create shared interactivity across multiple subplots.
Extending Matplotlib.artist.Artist.get_contains() for Custom Visualizations
Matplotlib.artist.Artist.get_contains() can be extended to create custom visualizations with unique interactive features. Here are some ideas for extending its functionality:
- Implement custom picking behavior for complex shapes
- Create interactive data exploration tools
- Develop custom annotation systems
- Implement drag-and-drop functionality
Let’s explore an example that extends Matplotlib.artist.Artist.get_contains() to create a custom interactive visualization:
import matplotlib.pyplot as plt
import numpy as np
from matplotlib.patches import Polygon

class InteractivePolygon(Polygon):
    def __init__(self, xy, **kwargs):
        super().__init__(xy, **kwargs)
        self.set_picker(True)
        self.dragging = False
        self.offset = None

    def contains(self, event):
        inside, info = super().contains(event)
        if inside:
            self.offset = event.xdata - self.xy[0, 0], event.ydata - self.xy[0, 1]
        return inside, info

    def on_press(self, event):
        if self.contains(event)[0]:
            self.dragging = True

    def on_release(self, event):
        self.dragging = False

    def on_motion(self, event):
        if self.dragging:
            dx = event.xdata - self.xy[0, 0] - self.offset[0]
            dy = event.ydata - self.xy[0, 1] - self.offset[1]
            self.xy += [dx, dy]
            self.figure.canvas.draw_idle()

fig, ax = plt.subplots()

# Create an interactive polygon
xy = np.array([[0, 0], [1, 0], [0.5, 1]])
poly = InteractivePolygon(xy, facecolor='blue', alpha=0.5)
ax.add_artist(poly)

# Connect events
fig.canvas.mpl_connect('button_press_event', poly.on_press)
fig.canvas.mpl_connect('button_release_event', poly.on_release)
fig.canvas.mpl_connect('motion_notify_event', poly.on_motion)

ax.set_xlim(-1, 2)
ax.set_ylim(-1, 2)
plt.title("Custom Interactive Polygon - how2matplotlib.com")
plt.show()
Output:
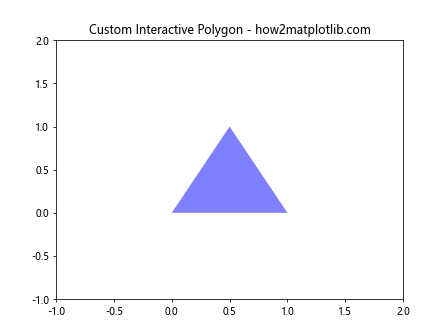
This example extends the Polygon class to create a draggable polygon using Matplotlib.artist.Artist.get_contains(). The custom InteractivePolygon class overrides the contains method and implements drag-and-drop functionality.
Conclusion: Mastering Matplotlib.artist.Artist.get_contains() for Advanced Visualizations
Throughout this comprehensive guide, we’ve explored the power and versatility of Matplotlib.artist.Artist.get_contains() in Python. We’ve covered its basic usage, advanced techniques, optimization strategies, and ways to extend its functionality for custom visualizations.