How to Increase the Size of Scatter Points in Matplotlib
How to increase the size of scatter points in Matplotlib is a common question among data visualization enthusiasts. Matplotlib is a powerful plotting library in Python that allows users to create a wide variety of plots, including scatter plots. One of the key aspects of creating effective scatter plots is controlling the size of the scatter points. In this comprehensive guide, we’ll explore various techniques and methods to increase the size of scatter points in Matplotlib, providing you with the knowledge and tools to enhance your data visualizations.
Understanding Scatter Plots and Point Sizes in Matplotlib
Before diving into the specifics of how to increase the size of scatter points in Matplotlib, it’s essential to understand what scatter plots are and how point sizes are handled in Matplotlib. Scatter plots are two-dimensional plots that use dots to represent the values of two different variables. The position of each dot on the horizontal and vertical axis is determined by its x and y coordinates, respectively.
In Matplotlib, the size of scatter points is controlled by the ‘s’ parameter in the scatter() function. By default, the size of scatter points is relatively small, which may not always be ideal for all visualization needs. Learning how to increase the size of scatter points in Matplotlib can greatly improve the readability and impact of your scatter plots.
Let’s start with a basic example of creating a scatter plot with default point sizes:
import matplotlib.pyplot as plt
import numpy as np

# Generate sample data
x = np.random.rand(50)
y = np.random.rand(50)

# Create a scatter plot with default point sizes
plt.figure(figsize=(8, 6))
plt.scatter(x, y)
plt.title('Default Scatter Plot - how2matplotlib.com')
plt.xlabel('X-axis')
plt.ylabel('Y-axis')
plt.show()
Output:
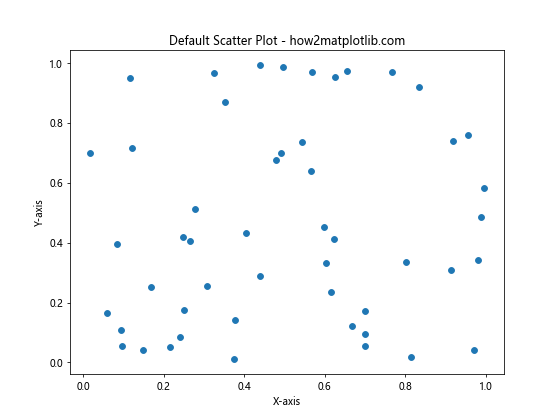
In this example, we create a basic scatter plot using random data points. The scatter points are plotted with their default size. Now, let’s explore how to increase the size of these scatter points.
Increasing Scatter Point Size Using the ‘s’ Parameter
The most straightforward way to increase the size of scatter points in Matplotlib is by using the ‘s’ parameter in the scatter() function. This parameter accepts a single value or an array of values that determine the size of each point.
Here’s an example of how to increase the size of scatter points using a single value:
import matplotlib.pyplot as plt
import numpy as np

# Generate sample data
x = np.random.rand(50)
y = np.random.rand(50)

# Create a scatter plot with increased point size
plt.figure(figsize=(8, 6))
plt.scatter(x, y, s=100)  # Increase point size to 100
plt.title('Increased Scatter Point Size - how2matplotlib.com')
plt.xlabel('X-axis')
plt.ylabel('Y-axis')
plt.show()
Output:
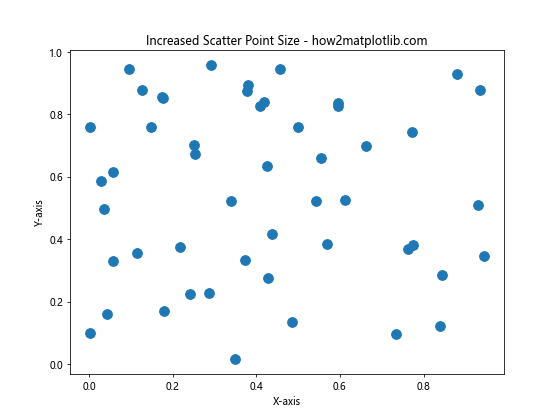
In this example, we set ‘s=100’ to increase the size of all scatter points uniformly. You can adjust this value to achieve the desired point size for your visualization.
Varying Scatter Point Sizes Based on Data
Sometimes, you may want to vary the size of scatter points based on a third variable in your dataset. This can add an extra dimension of information to your scatter plot. Here’s how you can achieve this:
import matplotlib.pyplot as plt
import numpy as np

# Generate sample data
x = np.random.rand(50)
y = np.random.rand(50)
sizes = np.random.rand(50) * 500  # Generate random sizes

# Create a scatter plot with varying point sizes
plt.figure(figsize=(8, 6))
plt.scatter(x, y, s=sizes)
plt.title('Varying Scatter Point Sizes - how2matplotlib.com')
plt.xlabel('X-axis')
plt.ylabel('Y-axis')
plt.colorbar(label='Point Size')
plt.show()
Output:
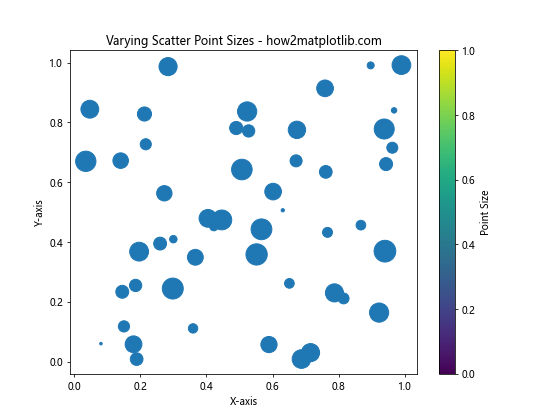
In this example, we generate random sizes for each point and pass them to the ‘s’ parameter. This creates a scatter plot where each point has a different size, potentially representing an additional dimension of your data.
Using Marker Styles to Increase Apparent Size
Another way to effectively increase the size of scatter points in Matplotlib is by using different marker styles. Some marker styles appear larger or more prominent than others, even with the same ‘s’ value. Here’s an example:
import matplotlib.pyplot as plt
import numpy as np

# Generate sample data
x = np.random.rand(50)
y = np.random.rand(50)

# Create a scatter plot with different marker styles
plt.figure(figsize=(12, 8))
markers = ['o', 's', '^', 'D', '*']
for i, marker in enumerate(markers):
    plt.scatter(x + i*0.5, y, marker=marker, s=100, label=f'Marker: {marker}')

plt.title('Different Marker Styles - how2matplotlib.com')
plt.xlabel('X-axis')
plt.ylabel('Y-axis')
plt.legend()
plt.show()
Output:
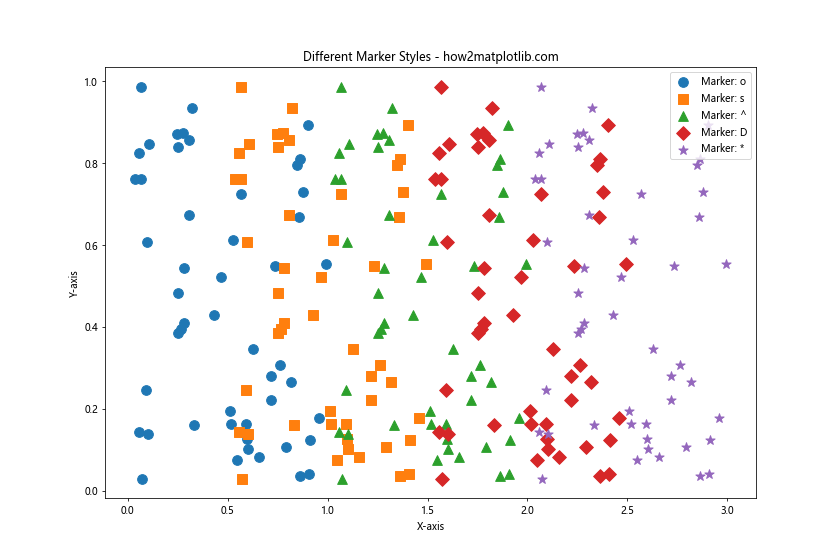
This example demonstrates how different marker styles can affect the apparent size of scatter points, even when the ‘s’ parameter is kept constant.
Adjusting Point Size for Different Plot Sizes
When working with different plot sizes, you may need to adjust the size of scatter points accordingly. Here’s how you can scale point sizes based on the figure size:
import matplotlib.pyplot as plt
import numpy as np

# Generate sample data
x = np.random.rand(50)
y = np.random.rand(50)

# Create two scatter plots with different figure sizes
fig, (ax1, ax2) = plt.subplots(1, 2, figsize=(16, 6))

# Plot 1: Smaller figure
ax1.scatter(x, y, s=50)
ax1.set_title('Smaller Figure - how2matplotlib.com')
ax1.set_xlabel('X-axis')
ax1.set_ylabel('Y-axis')

# Plot 2: Larger figure with adjusted point size
ax2.scatter(x, y, s=200)
ax2.set_title('Larger Figure - how2matplotlib.com')
ax2.set_xlabel('X-axis')
ax2.set_ylabel('Y-axis')

plt.tight_layout()
plt.show()
Output:
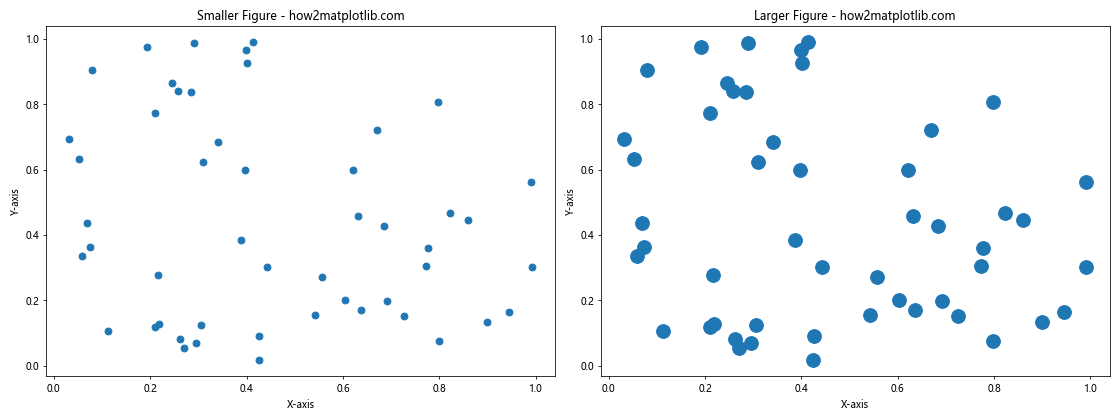
This example shows how to adjust point sizes for different plot sizes to maintain visual consistency across your visualizations.
Using Alpha to Enhance Visibility of Overlapping Points
When increasing the size of scatter points, you may encounter issues with overlapping points. Using the ‘alpha’ parameter can help in such situations by making the points semi-transparent:
import matplotlib.pyplot as plt
import numpy as np

# Generate sample data with some overlapping points
x = np.random.normal(0, 1, 1000)
y = np.random.normal(0, 1, 1000)

# Create a scatter plot with increased size and alpha
plt.figure(figsize=(10, 8))
plt.scatter(x, y, s=100, alpha=0.5)
plt.title('Scatter Plot with Alpha - how2matplotlib.com')
plt.xlabel('X-axis')
plt.ylabel('Y-axis')
plt.show()
Output:
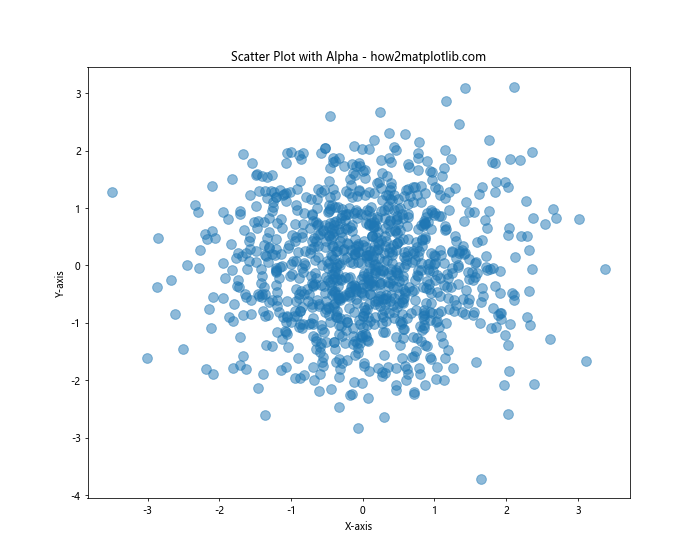
This example demonstrates how using alpha can help visualize overlapping points when you increase the size of scatter points in Matplotlib.
Combining Size and Color to Represent Multiple Variables
You can combine point size and color to represent multiple variables in your scatter plot. This technique is particularly useful when you want to visualize three or more dimensions of data:
import matplotlib.pyplot as plt
import numpy as np

# Generate sample data
x = np.random.rand(100)
y = np.random.rand(100)
colors = np.random.rand(100)
sizes = np.random.rand(100) * 500

# Create a scatter plot with varying sizes and colors
plt.figure(figsize=(10, 8))
scatter = plt.scatter(x, y, c=colors, s=sizes, cmap='viridis')
plt.title('Scatter Plot with Size and Color - how2matplotlib.com')
plt.xlabel('X-axis')
plt.ylabel('Y-axis')
plt.colorbar(scatter, label='Color Value')
plt.show()
Output:
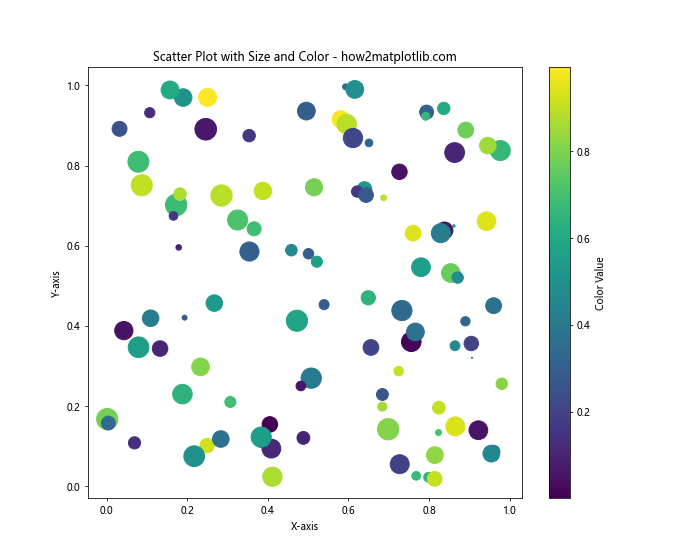
This example shows how to use both size and color to represent different variables in your scatter plot, effectively increasing the dimensionality of your visualization.
Using Logarithmic Scaling for Point Sizes
When dealing with data that has a wide range of values, using logarithmic scaling for point sizes can be beneficial. Here’s how you can implement this:
import matplotlib.pyplot as plt
import numpy as np

# Generate sample data with a wide range of values
x = np.random.rand(100)
y = np.random.rand(100)
sizes = np.random.randint(1, 1000, 100)

# Create a scatter plot with logarithmically scaled point sizes
plt.figure(figsize=(10, 8))
plt.scatter(x, y, s=np.log(sizes)*20)
plt.title('Scatter Plot with Log-Scaled Sizes - how2matplotlib.com')
plt.xlabel('X-axis')
plt.ylabel('Y-axis')
plt.show()
Output:
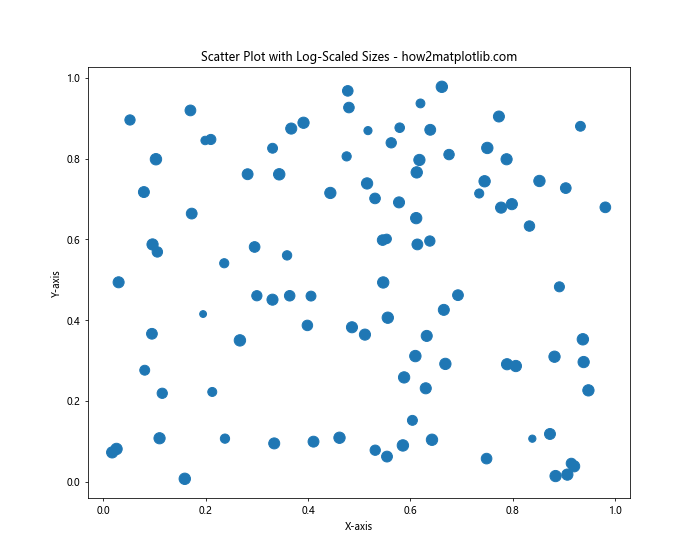
This example demonstrates how to use logarithmic scaling to handle a wide range of point sizes effectively.
Customizing Point Sizes in 3D Scatter Plots
Increasing the size of scatter points in Matplotlib is not limited to 2D plots. You can also apply these techniques to 3D scatter plots. Here’s an example:
import matplotlib.pyplot as plt
import numpy as np

# Generate sample 3D data
x = np.random.rand(100)
y = np.random.rand(100)
z = np.random.rand(100)

# Create a 3D scatter plot with increased point size
fig = plt.figure(figsize=(10, 8))
ax = fig.add_subplot(111, projection='3d')
ax.scatter(x, y, z, s=100)
ax.set_title('3D Scatter Plot with Increased Size - how2matplotlib.com')
ax.set_xlabel('X-axis')
ax.set_ylabel('Y-axis')
ax.set_zlabel('Z-axis')
plt.show()
Output:
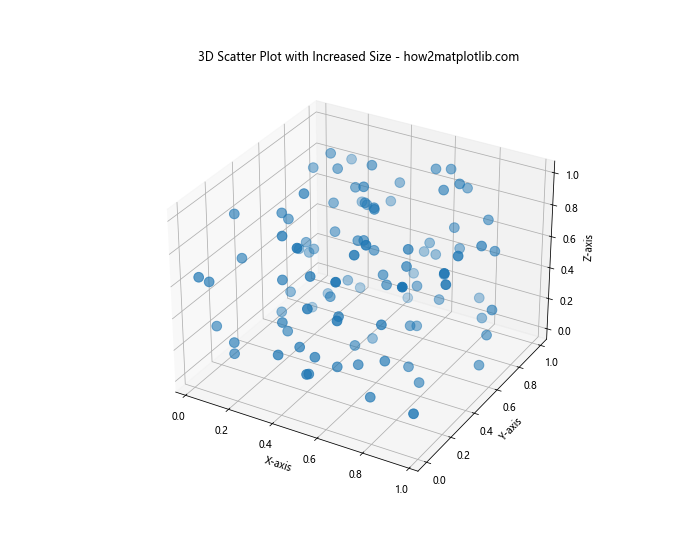
This example shows how to increase the size of scatter points in a 3D scatter plot, which can be particularly useful for visualizing complex, multi-dimensional data.
Using Size to Represent Categorical Data
You can also use point sizes to represent categorical data in your scatter plots. Here’s an example of how to achieve this:
import matplotlib.pyplot as plt
import numpy as np

# Generate sample data
x = np.random.rand(100)
y = np.random.rand(100)
categories = np.random.choice(['A', 'B', 'C'], 100)

# Create a scatter plot with sizes based on categories
plt.figure(figsize=(10, 8))
for category, size in zip(['A', 'B', 'C'], [50, 100, 200]):
    mask = categories == category
    plt.scatter(x[mask], y[mask], s=size, label=f'Category {category}')

plt.title('Scatter Plot with Categorical Sizes - how2matplotlib.com')
plt.xlabel('X-axis')
plt.ylabel('Y-axis')
plt.legend()
plt.show()
Output:
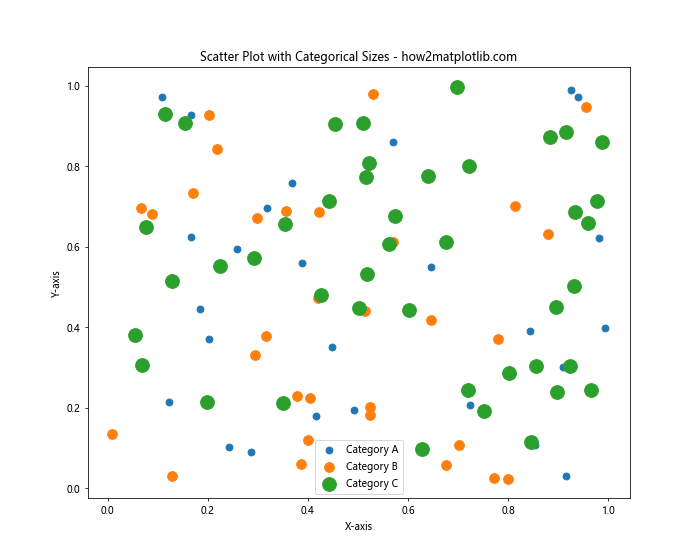
This example demonstrates how to use different point sizes to represent different categories in your data, providing a clear visual distinction between groups.
Animating Changes in Scatter Point Sizes
To create more dynamic visualizations, you can animate changes in scatter point sizes. Here’s a simple example of how to create an animation where point sizes change over time:
import matplotlib.pyplot as plt
import numpy as np
from matplotlib.animation import FuncAnimation

# Generate sample data
x = np.random.rand(20)
y = np.random.rand(20)

# Create the figure and scatter plot
fig, ax = plt.subplots(figsize=(8, 6))
scatter = ax.scatter(x, y, s=100)

# Animation update function
def update(frame):
    sizes = np.random.randint(50, 500, 20)
    scatter.set_sizes(sizes)
    return scatter,

# Create the animation
ani = FuncAnimation(fig, update, frames=50, interval=200, blit=True)

plt.title('Animated Scatter Plot Sizes - how2matplotlib.com')
plt.xlabel('X-axis')
plt.ylabel('Y-axis')
plt.show()
Output:
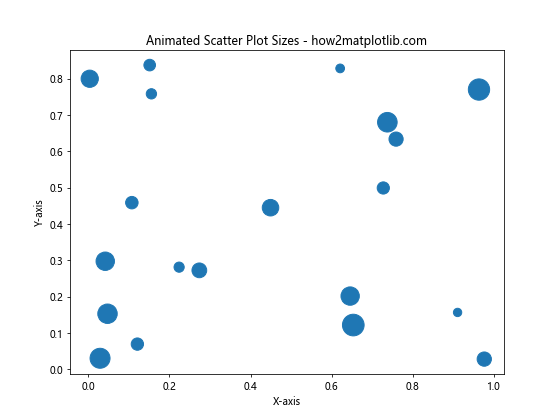
This example creates an animation where the sizes of scatter points change randomly over time, demonstrating how you can create dynamic visualizations by manipulating point sizes.
Using Point Sizes to Represent Uncertainty
Another interesting application of varying scatter point sizes is to represent uncertainty or confidence levels in your data. Here’s an example of how you might implement this:
import matplotlib.pyplot as plt
import numpy as np

# Generate sample data with "uncertainty"
x = np.random.rand(50)
y = np.random.rand(50)
uncertainty = np.random.rand(50)

# Create a scatter plot with sizes representing uncertainty
plt.figure(figsize=(10, 8))
scatter = plt.scatter(x, y, s=1000*uncertainty, alpha=0.5)
plt.title('Scatter Plot with Uncertainty - how2matplotlib.com')
plt.xlabel('X-axis')
plt.ylabel('Y-axis')
plt.colorbar(scatter, label='Uncertainty')
plt.show()
Output:
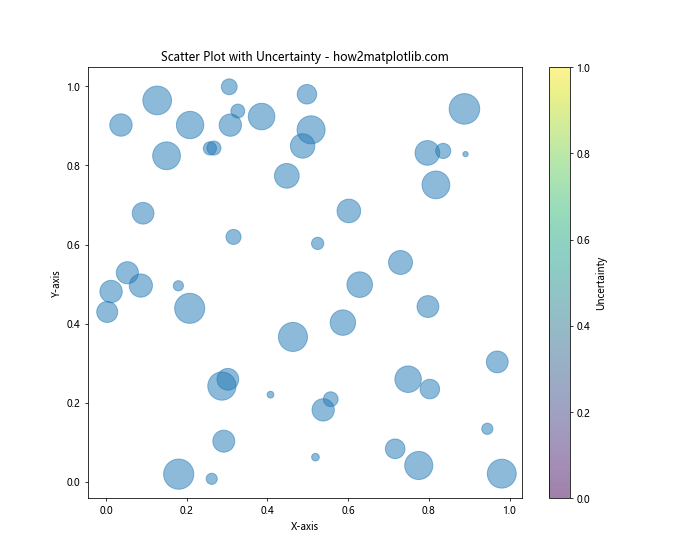
In this example, larger points represent higher uncertainty or lower confidence in the data point, while smaller points indicate more certain or confident measurements.
Combining Scatter Plots with Different Sizes
Sometimes, you may want to combine multiple scatter plots with different point sizes to compare different datasets or highlight specific data points. Here’s how you can achieve this:
import matplotlib.pyplot as plt
import numpy as np

# Generate sample data for two datasets
x1, y1 = np.random.rand(2, 50)
x2, y2 = np.random.rand(2, 20)

# Create a combined scatter plot
plt.figure(figsize=(10, 8))
plt.scatter(x1, y1, s=50, color='blue', label='Dataset 1')
plt.scatter(x2, y2, s=200, color='red', label='Dataset 2')
plt.title('Combined Scatter Plot with Different Sizes - how2matplotlib.com')
plt.xlabel('X-axis')
plt.ylabel('Y-axis')
plt.legend()
plt.show()
Output:
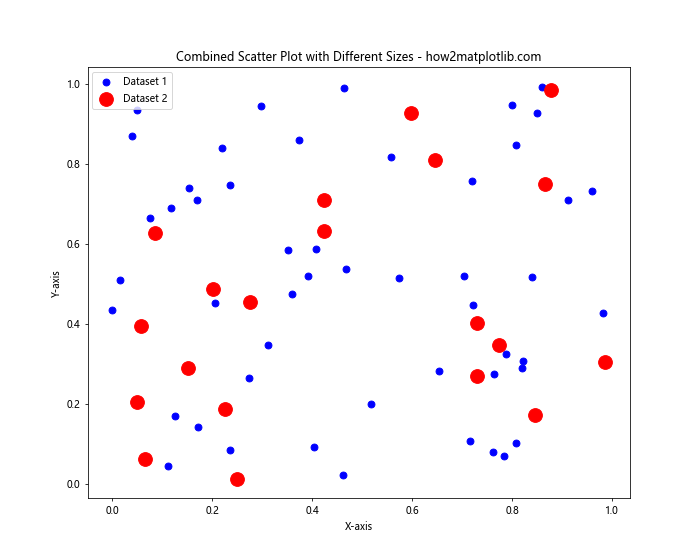
This example demonstrates how to create a scatter plot that combines two datasets with different point sizes, allowing for easy visual comparison.
Using Custom Markers to Increase Apparent Size
In addition to built-in markers, you can use custom markers to effectively increase the apparent size of scatter points. Here’s an example using custom star markers:
import matplotlib.pyplot as plt
import numpy as np

# Generate sample data
x = np.random.rand(50)
y = np.random.rand(50)

# Define a custom star marker
from matplotlib.path import Path
verts = np.array([(0., 1.), (0.587, 0.809), (0.951, 0.309),
                  (0.587, -0.809), (0., -1.), (-0.587, -0.809),
                  (-0.951, 0.309), (-0.587, 0.809), (0., 1.)])
codes = [Path.MOVETO] + [Path.LINETO] * 7 + [Path.CLOSEPOLY]
star_path = Path(verts, codes)

# Create a scatter plot with custom star markers
plt.figure(figsize=(10, 8))
plt.scatter(x, y, s=500, marker=star_path, facecolors='none', edgecolors='blue')
plt.title('Scatter Plot with Custom Star Markers - how2matplotlib.com')
plt.xlabel('X-axis')
plt.ylabel('Y-axis')
plt.show()
Output:
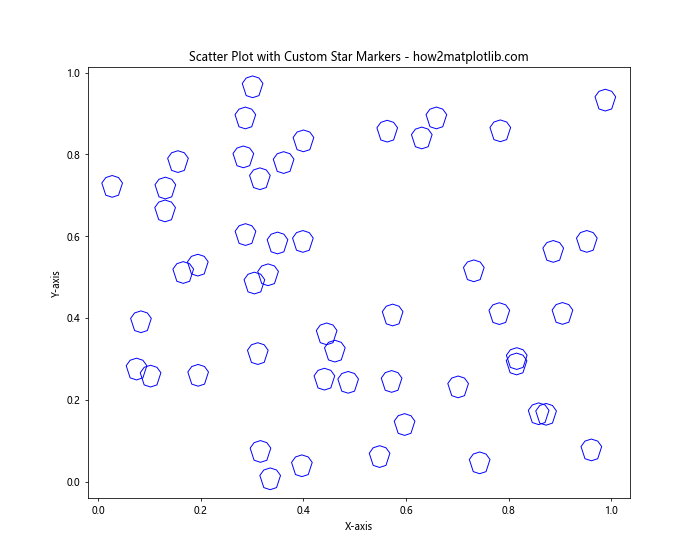
This example shows how to use a custom star-shaped marker to create visually striking and larger scatter points.
Adjusting Point Sizes for Different Output Formats
When preparing scatter plots for different output formats (e.g., screen display, print, or web), you may need to adjust point sizes accordingly. Here’s an example of how to create plots optimized for different outputs:
import matplotlib.pyplot as plt
import numpy as np

# Generate sample data
x = np.random.rand(50)
y = np.random.rand(50)

# Create scatter plots for different outputs
fig, (ax1, ax2) = plt.subplots(1, 2, figsize=(16, 6))

# Plot for screen display
ax1.scatter(x, y, s=50)
ax1.set_title('Screen Display - how2matplotlib.com')
ax1.set_xlabel('X-axis')
ax1.set_ylabel('Y-axis')

# Plot for print (higher DPI)
ax2.scatter(x, y, s=200)
ax2.set_title('Print Output - how2matplotlib.com')
ax2.set_xlabel('X-axis')
ax2.set_ylabel('Y-axis')

plt.tight_layout()
plt.show()

# Save high-resolution version for print
plt.savefig('high_res_scatter.png', dpi=300)
Output:
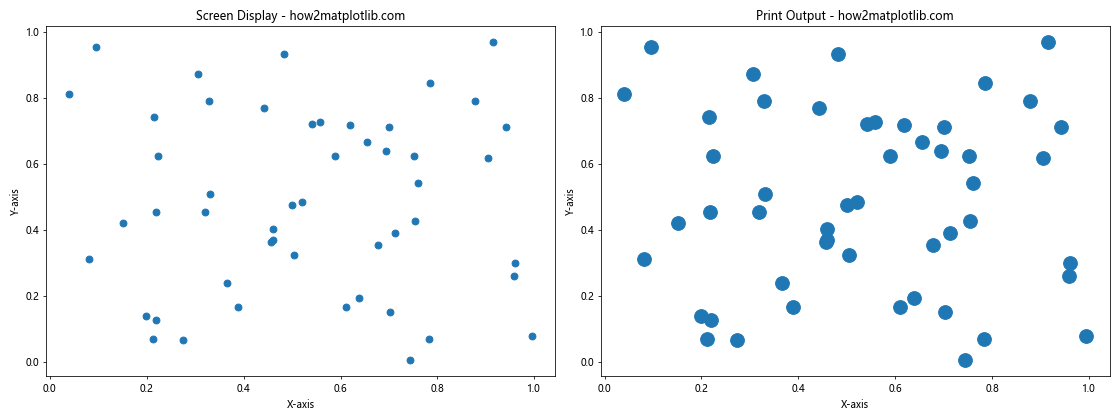
This example demonstrates how to adjust point sizes for different output formats, ensuring that your scatter plots look good whether viewed on screen or in print.
Conclusion: Mastering Scatter Point Sizes in Matplotlib
Learning how to increase the size of scatter points in Matplotlib is an essential skill for creating effective and visually appealing data visualizations. Throughout this comprehensive guide, we’ve explored various techniques and methods to control and manipulate scatter point sizes in Matplotlib.
We started with the basics of using the ‘s’ parameter to uniformly increase point sizes, then progressed to more advanced techniques such as varying sizes based on data, using different marker styles, and adjusting sizes for different plot and figure dimensions. We also covered how to handle overlapping points using transparency, combine size and color to represent multiple variables, and use logarithmic scaling for wide-ranging data.
Furthermore, we explored how to customize point sizes in 3D scatter plots, represent categorical data with different sizes, create animations with changing point sizes, and use sizes to represent uncertainty in data. We also looked at combining scatter plots with different sizes, using custom markers, and adjusting sizes for various output formats.
By mastering these techniques, you’ll be able to create more informative and visually striking scatter plots that effectively communicate your data. Remember that the key to creating great visualizations is not just knowing how to increase the size of scatter points in Matplotlib, but also understanding when and why to do so. Always consider your data, your audience, and the story you want to tell when deciding on the appropriate size and style for your scatter points.
As you continue to work with Matplotlib, experiment with these techniques and combine them in creative ways. The flexibility and power of Matplotlib allow for endless possibilities in data visualization, and mastering scatter point sizes is just one step towards becoming a proficient data visualizer.
Whether you’re working on scientific research, business analytics, or any other field that requires data visualization, the skills you’ve learned in this guide will help you create more impactful and informative scatter plots. Keep practicing, exploring, and pushing the boundaries of what’s possible with Matplotlib, and you’ll soon find yourself creating stunning visualizations that effectively communicate your data’s story.
Remember, the goal of data visualization is not just to make things look pretty, but to make complex information more accessible and understandable. By skillfully manipulating scatter point sizes, you can draw attention to important data points, highlight trends, and reveal patterns that might otherwise go unnoticed.