How to Plot a Time Series in Matplotlib
How to Plot a Time Series in Matplotlib is an essential skill for data visualization in Python. Time series plots are crucial for analyzing trends, patterns, and seasonality in data that changes over time. This comprehensive guide will walk you through various techniques and best practices for creating time series plots using Matplotlib, one of the most popular plotting libraries in Python.
Understanding Time Series Data and Matplotlib
Before diving into how to plot a time series in Matplotlib, it’s important to understand what time series data is and why Matplotlib is an excellent choice for visualizing it.
Time series data is a sequence of data points indexed in time order. This type of data is common in many fields, including finance, economics, weather forecasting, and more. When plotting time series data, the x-axis typically represents time, while the y-axis represents the measured variable.
Matplotlib is a powerful and flexible plotting library for Python. It provides a MATLAB-like interface for creating a wide variety of static, animated, and interactive visualizations. Matplotlib’s extensive functionality makes it particularly well-suited for plotting time series data.
Let’s start with a simple example of how to plot a time series in Matplotlib:
import matplotlib.pyplot as plt
import numpy as np
from datetime import datetime, timedelta

# Generate sample time series data
dates = [datetime(2023, 1, 1) + timedelta(days=i) for i in range(365)]
values = np.random.randn(365).cumsum()

# Create the plot
plt.figure(figsize=(12, 6))
plt.plot(dates, values)
plt.title('How to Plot a Time Series in Matplotlib - Basic Example')
plt.xlabel('Date')
plt.ylabel('Value')
plt.grid(True)
plt.text(0.5, 0.95, 'how2matplotlib.com', transform=plt.gca().transAxes, ha='center')
plt.show()
Output:
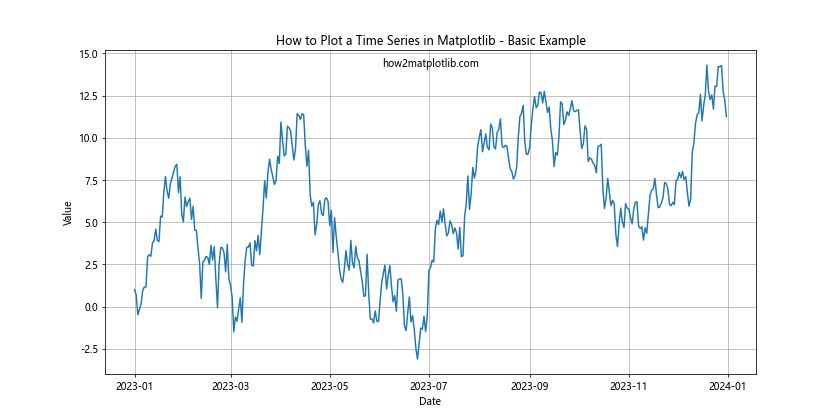
In this example, we’ve created a basic time series plot using Matplotlib. We generated sample data for a year and plotted it using the plt.plot() function. The plt.title(), plt.xlabel(), and plt.ylabel() functions are used to add a title and axis labels, respectively. The plt.grid() function adds a grid to the plot for better readability.
Customizing Time Series Plots in Matplotlib
Now that we’ve covered the basics of how to plot a time series in Matplotlib, let’s explore some ways to customize and enhance our plots.
Changing Line Styles and Colors
Matplotlib offers a wide range of line styles and colors to make your time series plots more visually appealing and informative. Here’s an example of how to customize the line style and color:
import matplotlib.pyplot as plt
import numpy as np
from datetime import datetime, timedelta

dates = [datetime(2023, 1, 1) + timedelta(days=i) for i in range(365)]
values = np.random.randn(365).cumsum()

plt.figure(figsize=(12, 6))
plt.plot(dates, values, linestyle='--', color='red', linewidth=2)
plt.title('How to Plot a Time Series in Matplotlib - Custom Line Style')
plt.xlabel('Date')
plt.ylabel('Value')
plt.grid(True)
plt.text(0.5, 0.95, 'how2matplotlib.com', transform=plt.gca().transAxes, ha='center')
plt.show()
Output:
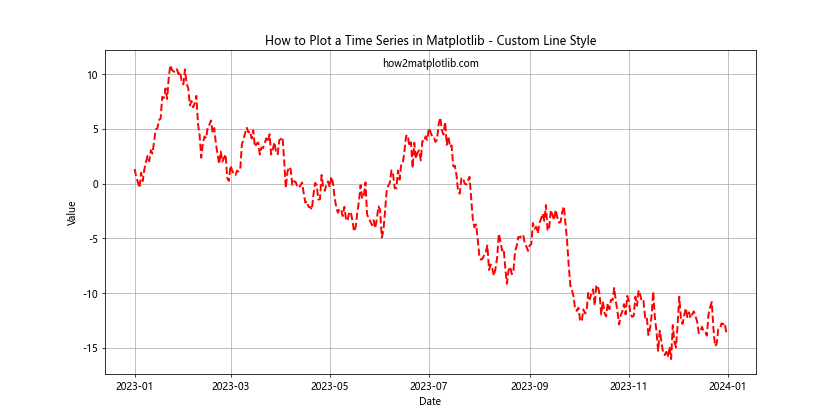
In this example, we’ve used a dashed line style (linestyle='--'), changed the color to red, and increased the line width. These customizations can help highlight important aspects of your time series data.
Adding Markers to Data Points
Sometimes, it’s useful to add markers to individual data points in your time series plot. Here’s how you can do that:
import matplotlib.pyplot as plt
import numpy as np
from datetime import datetime, timedelta

dates = [datetime(2023, 1, 1) + timedelta(days=i*7) for i in range(52)]
values = np.random.randn(52).cumsum()

plt.figure(figsize=(12, 6))
plt.plot(dates, values, marker='o', linestyle='-', markersize=6)
plt.title('How to Plot a Time Series in Matplotlib - With Markers')
plt.xlabel('Date')
plt.ylabel('Value')
plt.grid(True)
plt.text(0.5, 0.95, 'how2matplotlib.com', transform=plt.gca().transAxes, ha='center')
plt.show()
Output:
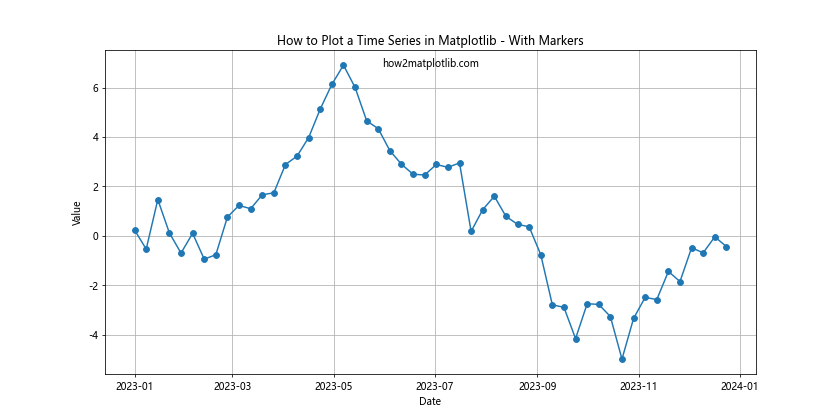
In this example, we’ve added circular markers (marker='o') to each data point. We’ve also reduced the number of data points to weekly intervals to make the markers more visible.
Handling Date Formatting in Time Series Plots
When working with time series data, proper date formatting on the x-axis is crucial for readability. Matplotlib provides several ways to handle date formatting in your plots.
Using AutoDateFormatter
The AutoDateFormatter class in Matplotlib automatically selects an appropriate date format based on the time scale of your data. Here’s an example:
import matplotlib.pyplot as plt
import matplotlib.dates as mdates
import numpy as np
from datetime import datetime, timedelta

dates = [datetime(2023, 1, 1) + timedelta(days=i) for i in range(365)]
values = np.random.randn(365).cumsum()

plt.figure(figsize=(12, 6))
plt.plot(dates, values)
plt.title('How to Plot a Time Series in Matplotlib - AutoDateFormatter')
plt.xlabel('Date')
plt.ylabel('Value')
plt.grid(True)

# Use AutoDateFormatter
ax = plt.gca()
ax.xaxis.set_major_formatter(mdates.AutoDateFormatter(ax.xaxis.get_major_locator()))

plt.text(0.5, 0.95, 'how2matplotlib.com', transform=plt.gca().transAxes, ha='center')
plt.show()
Output:
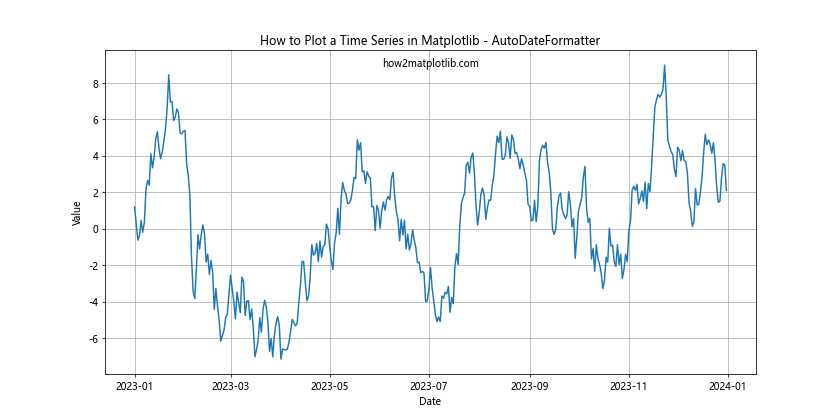
In this example, we’ve used the AutoDateFormatter to automatically format the dates on the x-axis. This is particularly useful when dealing with time series data that spans different time scales.
Custom Date Formatting
For more control over date formatting, you can use the DateFormatter class. Here’s an example:
import matplotlib.pyplot as plt
import matplotlib.dates as mdates
import numpy as np
from datetime import datetime, timedelta

dates = [datetime(2023, 1, 1) + timedelta(days=i) for i in range(365)]
values = np.random.randn(365).cumsum()

plt.figure(figsize=(12, 6))
plt.plot(dates, values)
plt.title('How to Plot a Time Series in Matplotlib - Custom Date Formatting')
plt.xlabel('Date')
plt.ylabel('Value')
plt.grid(True)

# Custom date formatting
ax = plt.gca()
ax.xaxis.set_major_formatter(mdates.DateFormatter('%Y-%m-%d'))
plt.gcf().autofmt_xdate()  # Rotate and align the tick labels

plt.text(0.5, 0.95, 'how2matplotlib.com', transform=plt.gca().transAxes, ha='center')
plt.show()
Output:
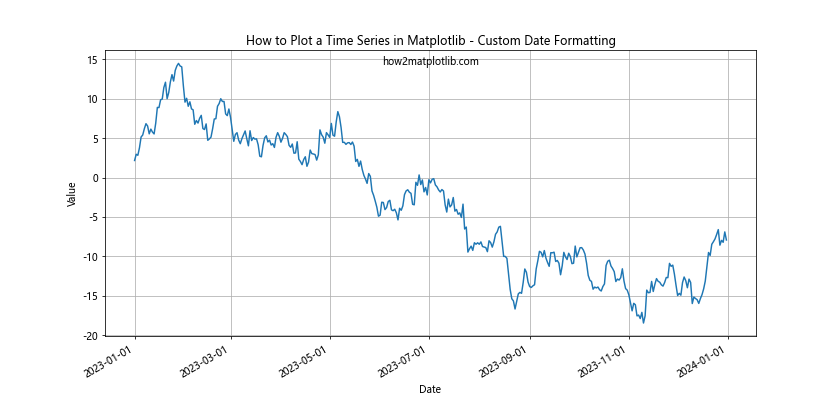
In this example, we’ve used the DateFormatter to specify a custom date format (‘%Y-%m-%d’). We’ve also used autofmt_xdate() to rotate the x-axis labels for better readability.
Multiple Time Series in One Plot
Often, you’ll want to compare multiple time series in a single plot. Matplotlib makes this easy to do. Here’s an example of how to plot multiple time series:
import matplotlib.pyplot as plt
import numpy as np
from datetime import datetime, timedelta

dates = [datetime(2023, 1, 1) + timedelta(days=i) for i in range(365)]
values1 = np.random.randn(365).cumsum()
values2 = np.random.randn(365).cumsum()

plt.figure(figsize=(12, 6))
plt.plot(dates, values1, label='Series 1')
plt.plot(dates, values2, label='Series 2')
plt.title('How to Plot a Time Series in Matplotlib - Multiple Series')
plt.xlabel('Date')
plt.ylabel('Value')
plt.legend()
plt.grid(True)
plt.text(0.5, 0.95, 'how2matplotlib.com', transform=plt.gca().transAxes, ha='center')
plt.show()
Output:
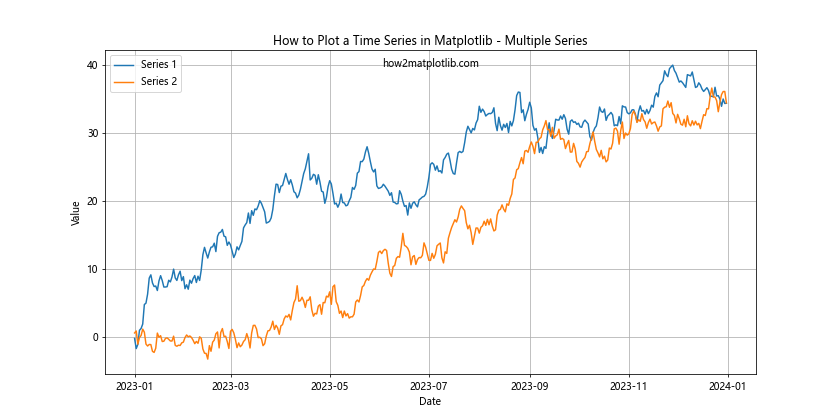
In this example, we’ve plotted two time series on the same axes. We’ve used the label parameter in the plot() function to give each series a name, and then called plt.legend() to display a legend.
Subplots for Time Series Data
When dealing with multiple time series that you want to compare but keep separate, subplots can be very useful. Here’s how to create subplots for time series data:
import matplotlib.pyplot as plt
import numpy as np
from datetime import datetime, timedelta

dates = [datetime(2023, 1, 1) + timedelta(days=i) for i in range(365)]
values1 = np.random.randn(365).cumsum()
values2 = np.random.randn(365).cumsum()

fig, (ax1, ax2) = plt.subplots(2, 1, figsize=(12, 10), sharex=True)

ax1.plot(dates, values1)
ax1.set_title('How to Plot a Time Series in Matplotlib - Subplot 1')
ax1.set_ylabel('Value')
ax1.grid(True)

ax2.plot(dates, values2)
ax2.set_title('How to Plot a Time Series in Matplotlib - Subplot 2')
ax2.set_xlabel('Date')
ax2.set_ylabel('Value')
ax2.grid(True)

plt.text(0.5, 0.98, 'how2matplotlib.com', transform=fig.transFigure, ha='center')
plt.tight_layout()
plt.show()
Output:
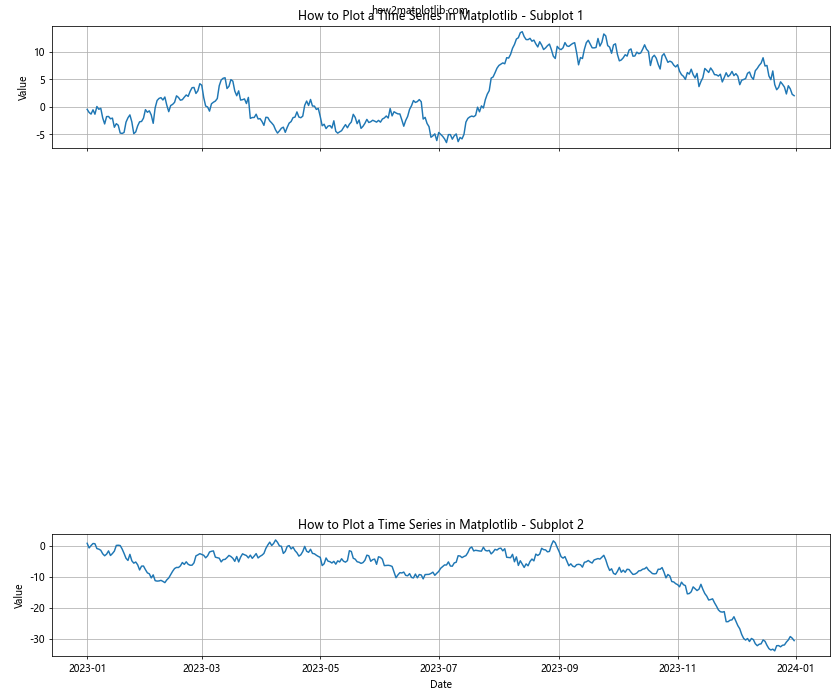
In this example, we’ve created two subplots stacked vertically. The sharex=True parameter ensures that both subplots share the same x-axis, which is useful for time series data.
Time Series Visualization Techniques
Now that we’ve covered the basics of how to plot a time series in Matplotlib, let’s explore some more advanced visualization techniques that can help you gain deeper insights from your time series data.
Moving Averages
Moving averages are a common technique used to smooth out short-term fluctuations and highlight longer-term trends or cycles. Here’s how to plot a moving average alongside your original time series:
import matplotlib.pyplot as plt
import numpy as np
from datetime import datetime, timedelta

dates = [datetime(2023, 1, 1) + timedelta(days=i) for i in range(365)]
values = np.random.randn(365).cumsum()

# Calculate 30-day moving average
window_size = 30
moving_avg = np.convolve(values, np.ones(window_size)/window_size, mode='valid')
ma_dates = dates[window_size-1:]

plt.figure(figsize=(12, 6))
plt.plot(dates, values, label='Original Data')
plt.plot(ma_dates, moving_avg, label='30-day Moving Average', color='red')
plt.title('How to Plot a Time Series in Matplotlib - Moving Average')
plt.xlabel('Date')
plt.ylabel('Value')
plt.legend()
plt.grid(True)
plt.text(0.5, 0.95, 'how2matplotlib.com', transform=plt.gca().transAxes, ha='center')
plt.show()
Output:
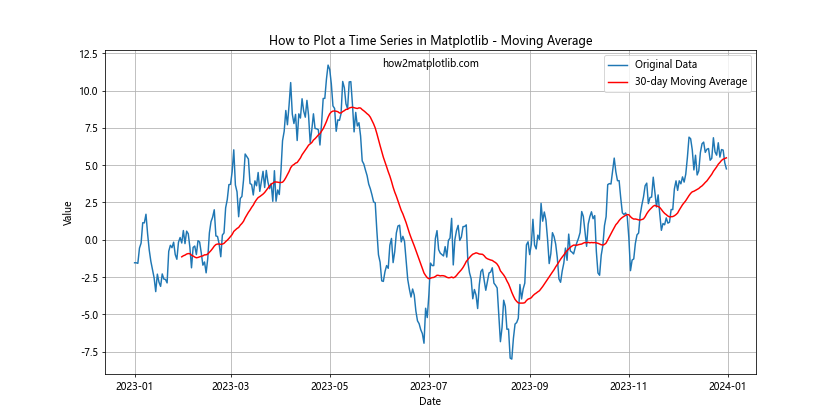
In this example, we’ve calculated a 30-day moving average using NumPy’s convolve function and plotted it alongside the original data. This can help highlight trends that might be obscured by day-to-day volatility.
Highlighting Specific Time Periods
Sometimes you may want to highlight specific time periods in your time series plot. Here’s how you can do that using Matplotlib:
import matplotlib.pyplot as plt
import numpy as np
from datetime import datetime, timedelta

dates = [datetime(2023, 1, 1) + timedelta(days=i) for i in range(365)]
values = np.random.randn(365).cumsum()

plt.figure(figsize=(12, 6))
plt.plot(dates, values)

# Highlight a specific time period
highlight_start = datetime(2023, 6, 1)
highlight_end = datetime(2023, 8, 31)
plt.axvspan(highlight_start, highlight_end, color='yellow', alpha=0.3)

plt.title('How to Plot a Time Series in Matplotlib - Highlighting Time Periods')
plt.xlabel('Date')
plt.ylabel('Value')
plt.grid(True)
plt.text(0.5, 0.95, 'how2matplotlib.com', transform=plt.gca().transAxes, ha='center')
plt.show()
Output:
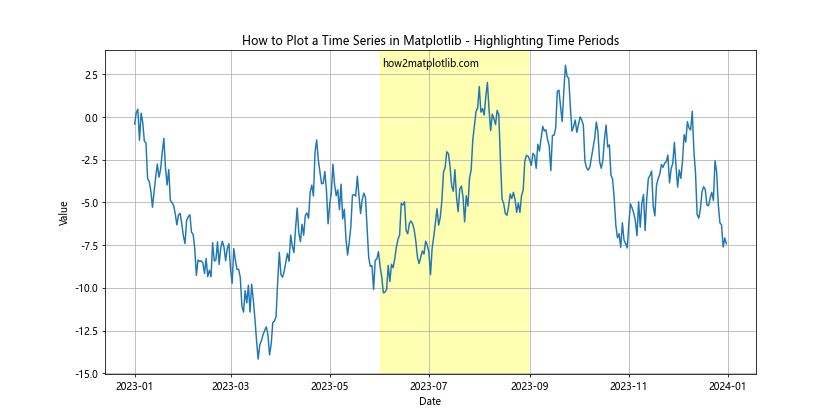
In this example, we’ve used plt.axvspan() to highlight a specific time period (in this case, the summer months) on our time series plot.
Advanced Time Series Plotting Techniques
As we continue to explore how to plot a time series in Matplotlib, let’s look at some more advanced techniques that can help you create even more informative and visually appealing plots.
Area Plots
Area plots can be useful for visualizing cumulative totals over time or for comparing multiple time series. Here’s how to create an area plot using Matplotlib:
import matplotlib.pyplot as plt
import numpy as np
from datetime import datetime, timedelta

dates = [datetime(2023, 1, 1) + timedelta(days=i) for i in range(365)]
values1 = np.random.randint(50, 100, 365)
values2 = np.random.randint(30, 80, 365)
values3 = np.random.randint(20, 60, 365)

plt.figure(figsize=(12, 6))
plt.stackplot(dates, values1, values2, values3, labels=['Series 1', 'Series 2', 'Series 3'])
plt.title('How to Plot a Time Series in Matplotlib - Area Plot')
plt.xlabel('Date')
plt.ylabel('Value')
plt.legend(loc='upper left')
plt.grid(True)
plt.text(0.5, 0.95, 'how2matplotlib.com', transform=plt.gca().transAxes, ha='center')
plt.show()
Output:
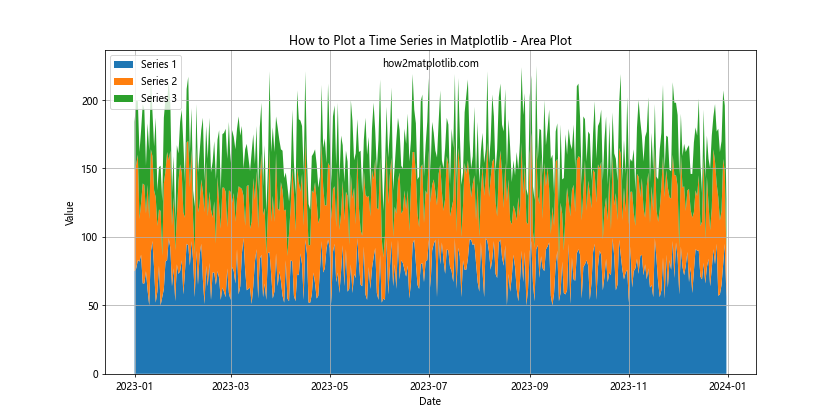
In this example, we’ve used plt.stackplot() to create an area plot of three different time series. This type of plot is particularly useful for showing how different components contribute to a total over time.
Handling Missing Data in Time Series Plots
When working with real-world time series data, it’s common to encounter missing values. Matplotlib provides several ways to handle missing data in your plots. Let’s explore a few techniques:
Interpolation
One way to handle missing data is to interpolate the missing values. Here’s an example:
import matplotlib.pyplot as plt
import numpy as np
import pandas as pd
from datetime import datetime, timedelta

# Generate sample data with missing values
dates = [datetime(2023, 1, 1) + timedelta(days=i) for i in range(365)]
values = np.random.randn(365).cumsum()
values[50:100] = np.nan  # Create a gap in the data

# Create a pandas Series and interpolate
ts = pd.Series(values, index=dates)
ts_interpolated = ts.interpolate()

plt.figure(figsize=(12, 6))
plt.plot(ts.index, ts.values, label='Original Data')
plt.plot(ts_interpolated.index, ts_interpolated.values, label='Interpolated Data')
plt.title('How to Plot a Time Series in Matplotlib - Handling Missing Data')
plt.xlabel('Date')
plt.ylabel('Value')
plt.legend()
plt.grid(True)
plt.text(0.5, 0.95, 'how2matplotlib.com', transform=plt.gca().transAxes, ha='center')
plt.show()
Output:
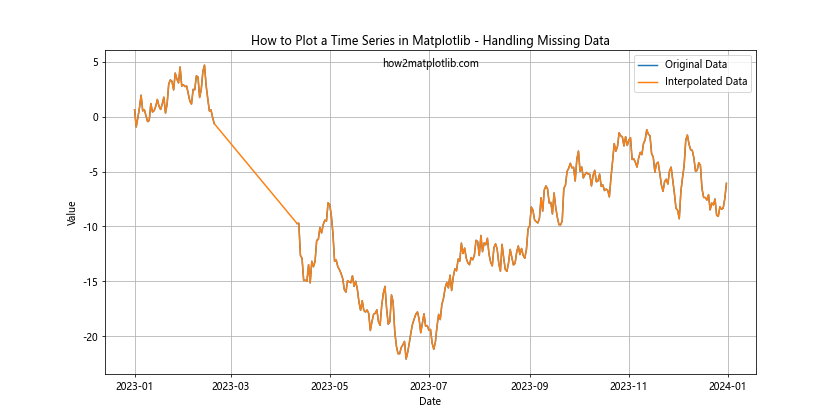
In this example, we’ve created a gap in our data and then used pandas’ interpolate() function to fill in the missing values. The plot shows both the original data with the gap and the interpolated data.
Masking Missing Data
Another approach is to simply not plot the missing data points. Matplotlib’s masked_array can be useful for this:
import matplotlib.pyplot as plt
import numpy as np
import numpy.ma as ma
from datetime import datetime, timedelta

# Generate sample data with missing values
dates = [datetime(2023, 1, 1) + timedelta(days=i) for i in range(365)]
values = np.random.randn(365).cumsum()
values[50:100] = np.nan  # Create a gap in the data

# Create a masked array
masked_values = ma.masked_invalid(values)

plt.figure(figsize=(12, 6))
plt.plot(dates, masked_values)
plt.title('How to Plot a Time Series in Matplotlib - Masking Missing Data')
plt.xlabel('Date')
plt.ylabel('Value')
plt.grid(True)
plt.text(0.5, 0.95, 'how2matplotlib.com', transform=plt.gca().transAxes, ha='center')
plt.show()
Output:
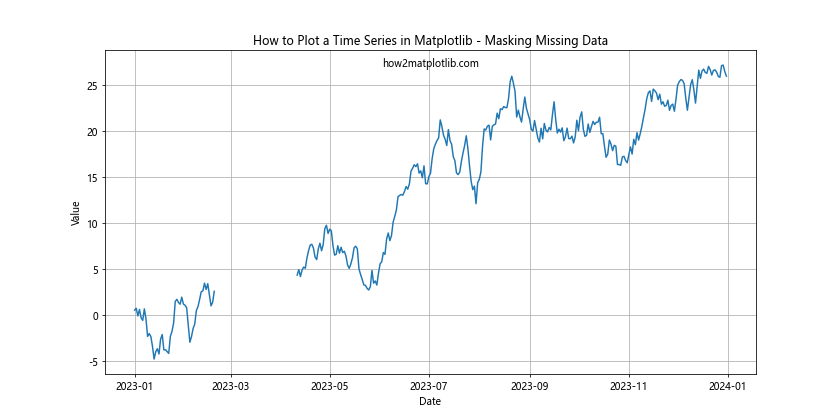
In this example, we’ve used numpy.ma.masked_invalid() to create a masked array that ignores the NaN values. When plotted, Matplotlib will simply skip over these masked values, creating a gap in the line.
Annotating Time Series Plots
Annotations can add valuable context to your time series plots. Let’s look at some ways to add annotations to your plots:
Adding Text Annotations
You can add text annotations to highlight specific points or periods in your time series:
import matplotlib.pyplot as plt
import numpy as np
from datetime import datetime, timedelta

dates = [datetime(2023, 1, 1) + timedelta(days=i) for i in range(365)]
values = np.random.randn(365).cumsum()

plt.figure(figsize=(12, 6))
plt.plot(dates, values)

# Add text annotation
max_value = max(values)
max_date = dates[np.argmax(values)]
plt.annotate(f'Peak: {max_value:.2f}', xy=(max_date, max_value), xytext=(10, 10),
             textcoords='offset points', ha='left', va='bottom',
             bbox=dict(boxstyle='round,pad=0.5', fc='yellow', alpha=0.5),
             arrowprops=dict(arrowstyle='->', connectionstyle='arc3,rad=0'))

plt.title('How to Plot a Time Series in Matplotlib - Text Annotation')
plt.xlabel('Date')
plt.ylabel('Value')
plt.grid(True)
plt.text(0.5, 0.95, 'how2matplotlib.com', transform=plt.gca().transAxes, ha='center')
plt.show()
Output:
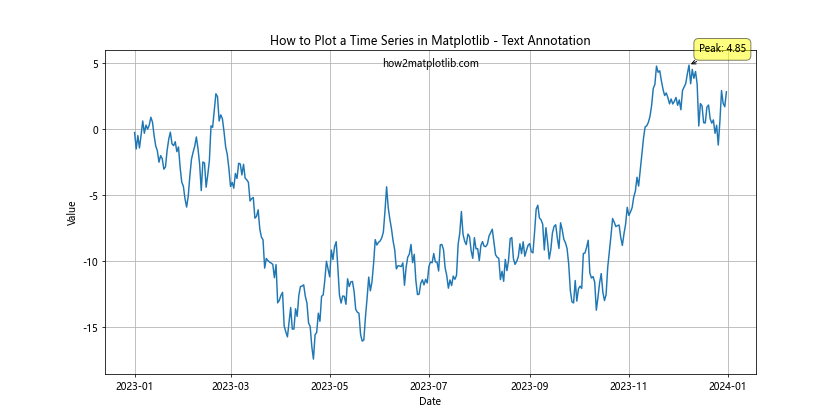
In this example, we’ve added a text annotation to highlight the peak value in our time series. The annotation includes an arrow pointing to the specific data point.
Adding Vertical and Horizontal Lines
Vertical and horizontal lines can be useful for marking specific dates or values:
import matplotlib.pyplot as plt
import numpy as np
from datetime import datetime, timedelta

dates = [datetime(2023, 1, 1) + timedelta(days=i) for i in range(365)]
values = np.random.randn(365).cumsum()

plt.figure(figsize=(12, 6))
plt.plot(dates, values)

# Add vertical line
event_date = datetime(2023, 7, 1)
plt.axvline(x=event_date, color='r', linestyle='--', label='Important Event')

# Add horizontal line
threshold = 5
plt.axhline(y=threshold, color='g', linestyle=':', label='Threshold')

plt.title('How to Plot a Time Series in Matplotlib - Adding Lines')
plt.xlabel('Date')
plt.ylabel('Value')
plt.legend()
plt.grid(True)
plt.text(0.5, 0.95, 'how2matplotlib.com', transform=plt.gca().transAxes, ha='center')
plt.show()
Output:
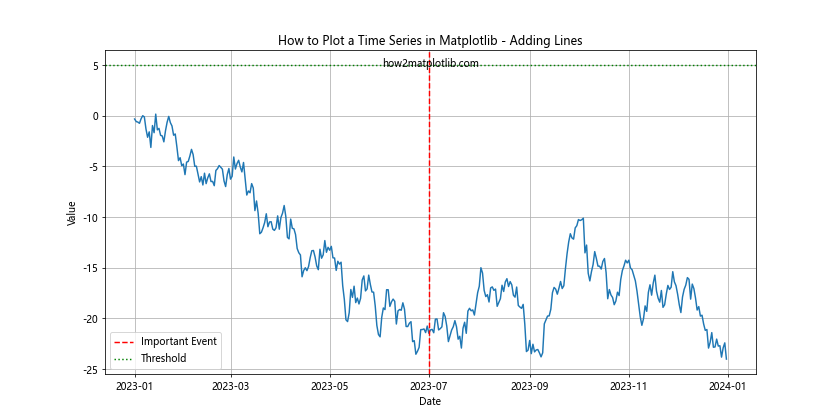
In this example, we’ve added a vertical line to mark a specific date and a horizontal line to indicate a threshold value.
Customizing Tick Labels and Axes
Proper formatting of tick labels and axes can greatly improve the readability of your time series plots. Let’s explore some advanced customization options:
Custom Tick Locators
Matplotlib provides various tick locators that can help you control the placement of ticks on your time series plots:
import matplotlib.pyplot as plt
import matplotlib.dates as mdates
import numpy as np
from datetime import datetime, timedelta

dates = [datetime(2023, 1, 1) + timedelta(days=i) for i in range(365)]
values = np.random.randn(365).cumsum()

fig, ax = plt.subplots(figsize=(12, 6))
ax.plot(dates, values)

# Set major ticks to be at the start of each month
ax.xaxis.set_major_locator(mdates.MonthLocator())
# Set minor ticks to be every Sunday
ax.xaxis.set_minor_locator(mdates.WeekdayLocator(byweekday=6))

# Format major ticks as 'YYYY-MM'
ax.xaxis.set_major_formatter(mdates.DateFormatter('%Y-%m'))
# Format minor ticks as 'DD'
ax.xaxis.set_minor_formatter(mdates.DateFormatter('%d'))

plt.title('How to Plot a Time Series in Matplotlib - Custom Tick Locators')
plt.xlabel('Date')
plt.ylabel('Value')
plt.grid(True)
plt.text(0.5, 0.95, 'how2matplotlib.com', transform=plt.gca().transAxes, ha='center')

# Rotate and align the tick labels so they look better
fig.autofmt_xdate()

plt.show()
Output:
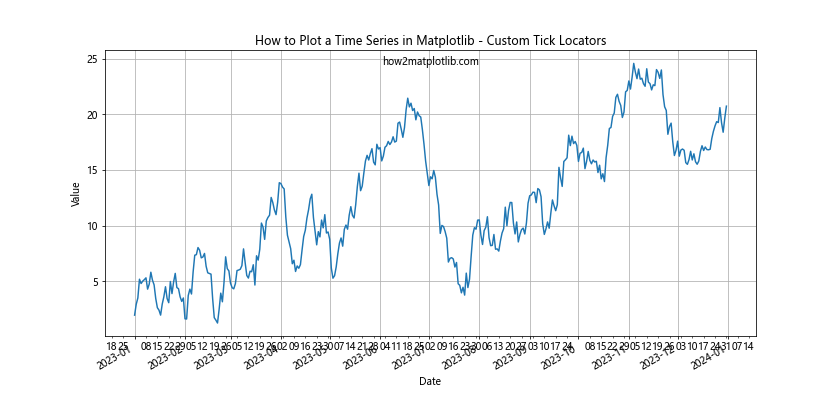
In this example, we’ve used MonthLocator for major ticks and WeekdayLocator for minor ticks. We’ve also customized the formatting of these ticks using DateFormatter.
Logarithmic Scale
For time series data that spans several orders of magnitude, a logarithmic scale can be useful:
import matplotlib.pyplot as plt
import numpy as np
from datetime import datetime, timedelta

dates = [datetime(2023, 1, 1) + timedelta(days=i) for i in range(365)]
values = np.exp(np.random.randn(365).cumsum())

plt.figure(figsize=(12, 6))
plt.semilogy(dates, values)
plt.title('How to Plot a Time Series in Matplotlib - Logarithmic Scale')
plt.xlabel('Date')
plt.ylabel('Value (log scale)')
plt.grid(True)
plt.text(0.5, 0.95, 'how2matplotlib.com', transform=plt.gca().transAxes, ha='center')
plt.show()
Output:
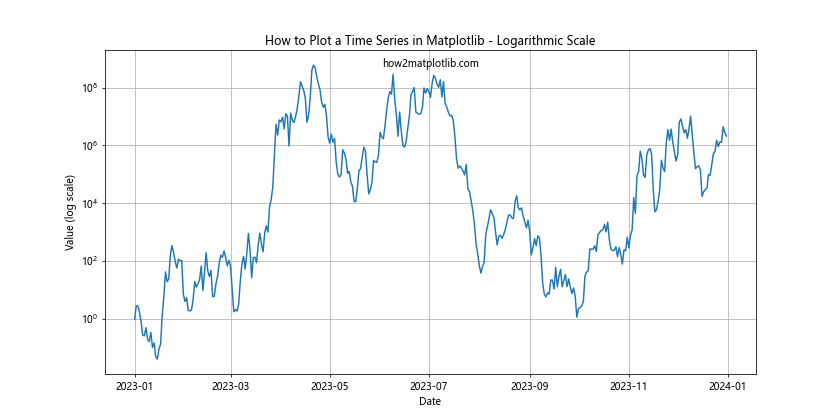
In this example, we’ve used plt.semilogy() to create a plot with a logarithmic y-axis. This can be particularly useful for financial time series or other data with exponential growth.
Interactive Time Series Plots
While Matplotlib is primarily designed for static plots, it’s possible to create interactive time series plots using Matplotlib’s animation features or by integrating with interactive libraries like Plotly. Here’s a simple example of an animated time series plot:
import matplotlib.pyplot as plt
import matplotlib.animation as animation
import numpy as np
from datetime import datetime, timedelta

# Generate sample data
dates = [datetime(2023, 1, 1) + timedelta(days=i) for i in range(365)]
values = np.random.randn(365).cumsum()

# Create the plot
fig, ax = plt.subplots(figsize=(12, 6))
line, = ax.plot(dates, values)

ax.set_title('How to Plot a Time Series in Matplotlib - Animated')
ax.set_xlabel('Date')
ax.set_ylabel('Value')
ax.grid(True)
plt.text(0.5, 0.95, 'how2matplotlib.com', transform=plt.gca().transAxes, ha='center')

# Animation function
def animate(i):
    line.set_data(dates[:i], values[:i])
    ax.relim()
    ax.autoscale_view()
    return line,

# Create the animation
ani = animation.FuncAnimation(fig, animate, frames=len(dates), interval=50, blit=True)

plt.show()
Output:
This example creates an animated plot that gradually reveals the time series data over time. While this specific animation might not be particularly useful for data analysis, it demonstrates the potential for creating more complex interactive visualizations.
Best Practices for Time Series Plotting
As we conclude our comprehensive guide on how to plot a time series in Matplotlib, let’s review some best practices to keep in mind:
- Choose the right type of plot: Line plots are standard for time series, but consider other types (like area plots or candlestick charts) if they better suit your data.
Pay attention to date formatting: Ensure your date labels are clear and appropriate for the time scale of your data.
Use appropriate time intervals: Choose tick intervals that make sense for your data (e.g., daily for short-term data, monthly for longer-term data).
Handle missing data appropriately: Decide whether to interpolate, mask, or otherwise handle missing values based on the nature of your data and analysis goals.
Use color effectively: Choose colors that are easy to distinguish and consider using color to highlight important aspects of your data.
Add context with annotations: Use textannotations, vertical lines, or other markers to highlight important events or thresholds in your time series.
Consider using subplots: If you’re comparing multiple time series, subplots can be an effective way to show relationships while keeping the data separate.
Use appropriate scales: Consider logarithmic scales for data that spans multiple orders of magnitude.
Provide clear titles and labels: Always include informative titles, axis labels, and legends to make your plots easy to understand.
Be mindful of overplotting: For very large time series, consider techniques like moving averages or resampling to reduce clutter.
Use interactive plots when appropriate: For exploratory data analysis or presentations, interactive plots can provide additional insights.
Customize for your audience: Consider who will be viewing your plots and adjust the level of detail and technical complexity accordingly.
Conclusion
Learning how to plot a time series in Matplotlib is an essential skill for anyone working with time-based data in Python. From basic line plots to more advanced techniques like seasonal decomposition and interactive animations, Matplotlib provides a powerful and flexible toolkit for visualizing time series data. Throughout this guide, we’ve covered a wide range of topics, including: