How to Reverse a Colormap Using Matplotlib in Python
How to reverse a Colormap using Matplotlib in Python is an essential skill for data visualization enthusiasts and professionals alike. Matplotlib, a powerful plotting library in Python, offers various ways to manipulate colormaps, including reversing them. In this comprehensive guide, we’ll explore the ins and outs of reversing colormaps in Matplotlib, providing you with the knowledge and tools to enhance your data visualizations.
Understanding Colormaps in Matplotlib
Before diving into how to reverse a Colormap using Matplotlib in Python, it’s crucial to understand what colormaps are and their significance in data visualization. Colormaps in Matplotlib are objects that map scalar data to colors. They play a vital role in representing data through color variations, making it easier for viewers to interpret complex information visually.
Matplotlib offers a wide range of built-in colormaps, each designed for specific types of data and visualization needs. These colormaps can be categorized into several types:
- Sequential colormaps
- Diverging colormaps
- Qualitative colormaps
- Cyclic colormaps
Let’s look at an example of how to display a colormap in Matplotlib:
import matplotlib.pyplot as plt
import numpy as np

# Create a sample dataset
data = np.random.rand(10, 10)

# Create a figure and axis
fig, ax = plt.subplots(figsize=(8, 6))

# Plot the data with a colormap
im = ax.imshow(data, cmap='viridis')

# Add a colorbar
cbar = plt.colorbar(im)

# Set title
plt.title('How to reverse a Colormap using Matplotlib in Python - Example')

# Show the plot
plt.show()
Output:
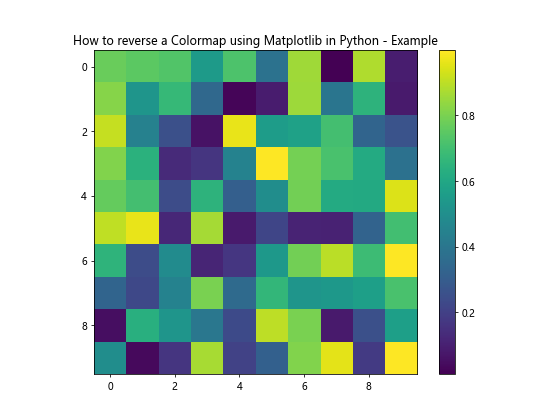
In this example, we’re using the ‘viridis’ colormap to visualize random data. The imshow function applies the colormap to our dataset, and we add a colorbar to show the color scale.
Why Reverse a Colormap?
Now that we understand what colormaps are, let’s explore why you might want to learn how to reverse a Colormap using Matplotlib in Python. Reversing a colormap can be useful in various scenarios:
- Enhancing data visibility: Sometimes, reversing a colormap can make certain features in your data more prominent.
- Aesthetic preferences: You might prefer the reversed version of a colormap for visual appeal.
- Consistency with other plots: If you’re creating multiple plots, you might need to reverse a colormap to maintain consistency across your visualizations.
- Adapting to color blindness: Reversed colormaps can sometimes be more accessible to color-blind individuals.
How to Reverse a Colormap Using Matplotlib in Python: Basic Approach
The simplest way to reverse a colormap in Matplotlib is by appending ‘_r’ to the colormap name. This method works for all built-in colormaps in Matplotlib. Let’s see an example:
import matplotlib.pyplot as plt
import numpy as np

# Create sample data
x = np.linspace(0, 10, 100)
y = np.sin(x)

# Create a figure and axis
fig, (ax1, ax2) = plt.subplots(1, 2, figsize=(12, 5))

# Plot with original colormap
im1 = ax1.scatter(x, y, c=y, cmap='viridis')
ax1.set_title('Original Viridis Colormap')
plt.colorbar(im1, ax=ax1)

# Plot with reversed colormap
im2 = ax2.scatter(x, y, c=y, cmap='viridis_r')
ax2.set_title('Reversed Viridis Colormap')
plt.colorbar(im2, ax=ax2)

# Set overall title
fig.suptitle('How to reverse a Colormap using Matplotlib in Python - how2matplotlib.com', fontsize=16)

# Show the plot
plt.show()
Output:
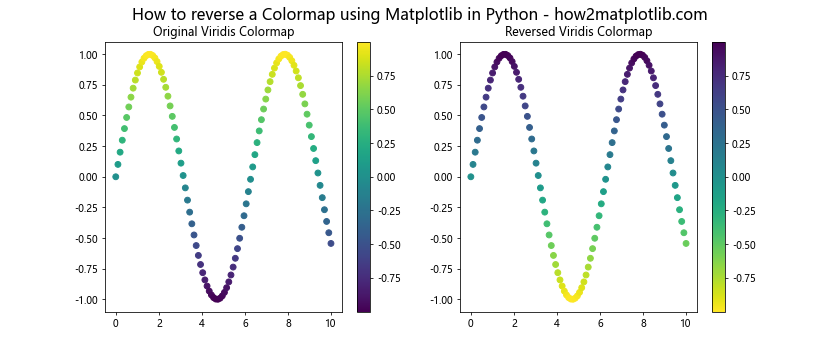
In this example, we’re creating two scatter plots side by side. The left plot uses the original ‘viridis’ colormap, while the right plot uses the reversed version ‘viridis_r’. This simple addition of ‘_r’ to the colormap name effectively reverses the color sequence.
Advanced Techniques: How to Reverse a Colormap Using Matplotlib in Python
While the ‘_r’ suffix is a quick and easy way to reverse colormaps, Matplotlib provides more advanced methods for greater control over colormap manipulation. Let’s explore some of these techniques.
Using ListedColormap to Reverse a Colormap
The ListedColormap class in Matplotlib allows you to create custom colormaps. You can use this to reverse a colormap by creating a new colormap with reversed colors. Here’s how:
import matplotlib.pyplot as plt
import matplotlib.colors as colors
import numpy as np

# Get the colormap
cmap = plt.get_cmap('viridis')

# Create a new ListedColormap with reversed colors
reversed_cmap = colors.ListedColormap(cmap.colors[::-1])

# Create sample data
data = np.random.rand(10, 10)

# Create a figure and axis
fig, (ax1, ax2) = plt.subplots(1, 2, figsize=(12, 5))

# Plot with original colormap
im1 = ax1.imshow(data, cmap=cmap)
ax1.set_title('Original Viridis Colormap')
plt.colorbar(im1, ax=ax1)

# Plot with reversed colormap
im2 = ax2.imshow(data, cmap=reversed_cmap)
ax2.set_title('Reversed Viridis Colormap')
plt.colorbar(im2, ax=ax2)

# Set overall title
fig.suptitle('How to reverse a Colormap using Matplotlib in Python - how2matplotlib.com', fontsize=16)

# Show the plot
plt.show()
Output:
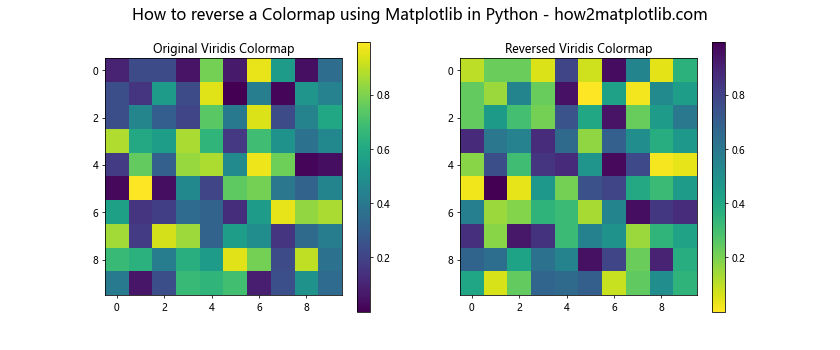
In this example, we first get the ‘viridis’ colormap using plt.get_cmap(). We then create a new ListedColormap by reversing the colors of the original colormap. This gives us more flexibility in how we reverse and manipulate colormaps.
Reversing Colormaps with LinearSegmentedColormap
Another advanced method to reverse a colormap is by using the LinearSegmentedColormap class. This approach allows for even more control over the colormap creation process. Here’s an example:
import matplotlib.pyplot as plt
import matplotlib.colors as colors
import numpy as np

# Get the colormap
cmap = plt.get_cmap('viridis')

# Get the colormap's color list
cmap_list = cmap(np.arange(cmap.N))

# Create a new LinearSegmentedColormap with reversed colors
reversed_cmap = colors.LinearSegmentedColormap.from_list('reversed_viridis', cmap_list[::-1])

# Create sample data
data = np.random.rand(10, 10)

# Create a figure and axis
fig, (ax1, ax2) = plt.subplots(1, 2, figsize=(12, 5))

# Plot with original colormap
im1 = ax1.imshow(data, cmap=cmap)
ax1.set_title('Original Viridis Colormap')
plt.colorbar(im1, ax=ax1)

# Plot with reversed colormap
im2 = ax2.imshow(data, cmap=reversed_cmap)
ax2.set_title('Reversed Viridis Colormap')
plt.colorbar(im2, ax=ax2)

# Set overall title
fig.suptitle('How to reverse a Colormap using Matplotlib in Python - how2matplotlib.com', fontsize=16)

# Show the plot
plt.show()
Output:
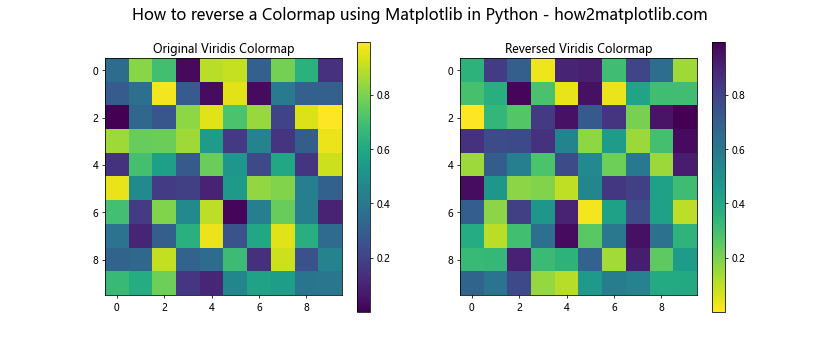
This method gives you the flexibility to create custom colormaps with specific color sequences, not just reversed ones.
Applying Reversed Colormaps to Different Plot Types
Now that we know how to reverse a Colormap using Matplotlib in Python, let’s explore how to apply these reversed colormaps to different types of plots.
Heatmaps with Reversed Colormaps
Heatmaps are an excellent way to visualize 2D data, and reversed colormaps can sometimes make the data more readable. Here’s an example:
import matplotlib.pyplot as plt
import numpy as np

# Create sample data
data = np.random.rand(10, 10)

# Create a figure and axis
fig, (ax1, ax2) = plt.subplots(1, 2, figsize=(12, 5))

# Plot heatmap with original colormap
im1 = ax1.imshow(data, cmap='coolwarm')
ax1.set_title('Heatmap with Original Coolwarm Colormap')
plt.colorbar(im1, ax=ax1)

# Plot heatmap with reversed colormap
im2 = ax2.imshow(data, cmap='coolwarm_r')
ax2.set_title('Heatmap with Reversed Coolwarm Colormap')
plt.colorbar(im2, ax=ax2)

# Set overall title
fig.suptitle('How to reverse a Colormap using Matplotlib in Python - how2matplotlib.com', fontsize=16)

# Show the plot
plt.show()
Output:
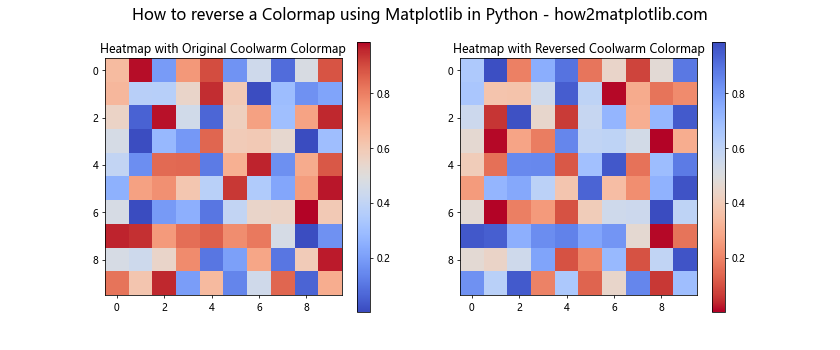
In this example, we’re using the ‘coolwarm’ colormap and its reversed version to create two heatmaps side by side.
Contour Plots with Reversed Colormaps
Contour plots are another type of visualization where reversed colormaps can be useful. Here’s how to create a contour plot with a reversed colormap:
import matplotlib.pyplot as plt
import numpy as np

# Create sample data
x = np.linspace(-3, 3, 100)
y = np.linspace(-3, 3, 100)
X, Y = np.meshgrid(x, y)
Z = np.sin(X) * np.cos(Y)

# Create a figure and axis
fig, (ax1, ax2) = plt.subplots(1, 2, figsize=(12, 5))

# Plot contour with original colormap
cs1 = ax1.contourf(X, Y, Z, cmap='plasma')
ax1.set_title('Contour Plot with Original Plasma Colormap')
plt.colorbar(cs1, ax=ax1)

# Plot contour with reversed colormap
cs2 = ax2.contourf(X, Y, Z, cmap='plasma_r')
ax2.set_title('Contour Plot with Reversed Plasma Colormap')
plt.colorbar(cs2, ax=ax2)

# Set overall title
fig.suptitle('How to reverse a Colormap using Matplotlib in Python - how2matplotlib.com', fontsize=16)

# Show the plot
plt.show()
Output:
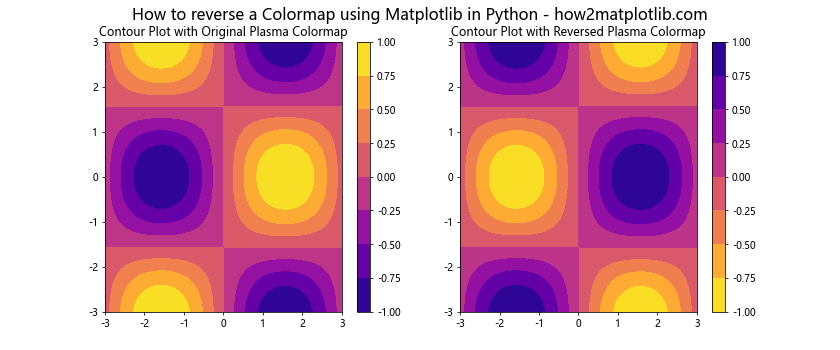
This example demonstrates how reversing a colormap can change the appearance of a contour plot, potentially highlighting different aspects of the data.
Customizing Reversed Colormaps
Learning how to reverse a Colormap using Matplotlib in Python is just the beginning. You can further customize your reversed colormaps to suit your specific needs.
Adjusting Colormap Brightness
Sometimes, you might want to adjust the brightness of your reversed colormap. Here’s how you can do that:
import matplotlib.pyplot as plt
import matplotlib.colors as colors
import numpy as np

# Get the colormap
cmap = plt.get_cmap('viridis')

# Get the colormap's color list and reverse it
cmap_list = cmap(np.arange(cmap.N))[::-1]

# Adjust brightness (increase values to brighten, decrease to darken)
brightness_factor = 1.2
brightened_cmap_list = np.clip(cmap_list * brightness_factor, 0, 1)

# Create a new LinearSegmentedColormap with brightened colors
brightened_reversed_cmap = colors.LinearSegmentedColormap.from_list('brightened_reversed_viridis', brightened_cmap_list)

# Create sample data
data = np.random.rand(10, 10)

# Create a figure and axis
fig, (ax1, ax2) = plt.subplots(1, 2, figsize=(12, 5))

# Plot with original reversed colormap
im1 = ax1.imshow(data, cmap='viridis_r')
ax1.set_title('Original Reversed Viridis Colormap')
plt.colorbar(im1, ax=ax1)

# Plot with brightened reversed colormap
im2 = ax2.imshow(data, cmap=brightened_reversed_cmap)
ax2.set_title('Brightened Reversed Viridis Colormap')
plt.colorbar(im2, ax=ax2)

# Set overall title
fig.suptitle('How to reverse a Colormap using Matplotlib in Python - how2matplotlib.com', fontsize=16)

# Show the plot
plt.show()
Output:
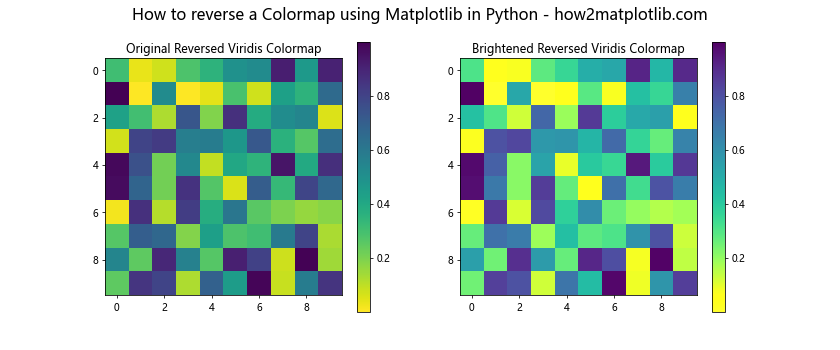
In this example, we’re not only reversing the ‘viridis’ colormap but also increasing its brightness by a factor of 1.2.
Creating a Custom Reversed Colormap
You can create a completely custom reversed colormap by defining your own color sequence. Here’s an example:
import matplotlib.pyplot as plt
import matplotlib.colors as colors
import numpy as np

# Define custom colors
custom_colors = ['#ff0000', '#00ff00', '#0000ff']  # Red, Green, Blue

# Create a custom colormap
custom_cmap = colors.LinearSegmentedColormap.from_list('custom', custom_colors)

# Create a reversed version of the custom colormap
reversed_custom_cmap = colors.LinearSegmentedColormap.from_list('reversed_custom', custom_colors[::-1])

# Create sample data
data = np.random.rand(10, 10)

# Create a figure and axis
fig, (ax1, ax2) = plt.subplots(1, 2, figsize=(12, 5))

# Plot with custom colormap
im1 = ax1.imshow(data, cmap=custom_cmap)
ax1.set_title('Custom Colormap')
plt.colorbar(im1, ax=ax1)

# Plot with reversed custom colormap
im2 = ax2.imshow(data, cmap=reversed_custom_cmap)
ax2.set_title('Reversed Custom Colormap')
plt.colorbar(im2, ax=ax2)

# Set overall title
fig.suptitle('How to reverse a Colormap using Matplotlib in Python - how2matplotlib.com', fontsize=16)

# Show the plot
plt.show()
Output:
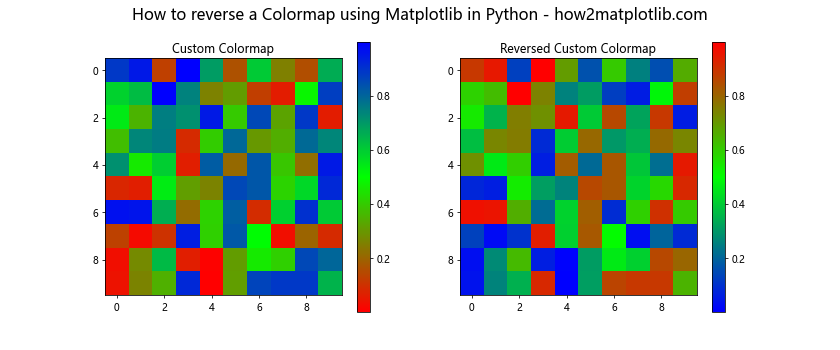
This example demonstrates how to create a custom colormap and its reversed version, giving you complete control over the color sequence.
Advanced Applications: How to Reverse a Colormap Using Matplotlib in Python
Now that we’ve covered the basics and some advanced techniques, let’s explore some more complex applications of reversed colormaps in Matplotlib.
Reversing Colormaps in Polar Plots
Polar plots are another type of visualization where reversed colormaps can be applied. Here’s an example:
import matplotlib.pyplot as plt
import numpy as np

# Create sample data
r = np.linspace(0, 2, 100)
theta = 4 * np.pi * r

# Create a figure with polar projection
fig, (ax1, ax2) = plt.subplots(1, 2, figsize=(12, 5), subplot_kw=dict(projection='polar'))

# Plot with original colormap
c1 = ax1.scatter(theta, r, c=r, cmap='hsv')
ax1.set_title('Polar Plot with Original HSV Colormap')
plt.colorbar(c1, ax=ax1)

# Plot with reversed colormap
c2 = ax2.scatter(theta, r, c=r, cmap='hsv_r')
ax2.set_title('Polar Plot with Reversed HSV Colormap')
plt.colorbar(c2, ax=ax2)

# Set overall title
fig.suptitle('How to reverse a Colormap using Matplotlib in Python - how2matplotlib.com', fontsize=16)

# Show the plot
plt.show()
Output:
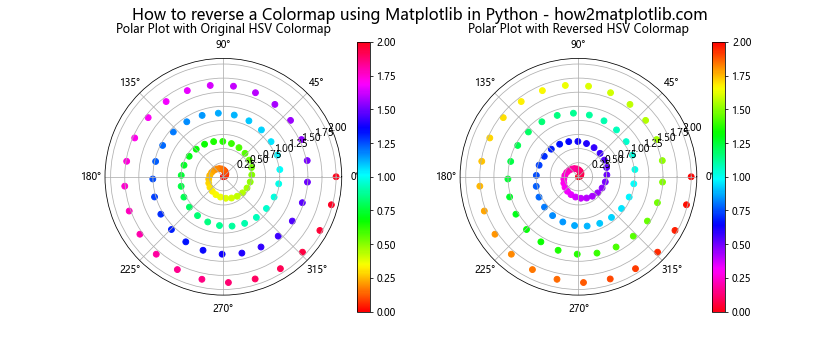
This example shows how reversing a colormap can change the visual interpretation of a polar plot, potentially highlighting different aspects of the data.
Best Practices: How to Reverse a Colormap Using Matplotlib in Python
When working with reversed colormaps, it’s important to keep some best practices in mind:
- Consider your data: Not all data benefits from a reversed colormap. Consider whether reversing the colormap enhances or obscures the information you’re trying to convey.
Consistency: If you’re creating multiple plots, be consistent in your use of colormaps. If you reverse one, consider whether you should reverse others for consistency.
Accessibility: Consider color-blind friendly colormaps and their reversed versions. Matplotlib provides several such colormaps, like ‘viridis’ and ‘cividis’.
Documentation: Always document your use of reversed colormaps in your code or accompanying text to avoid confusion.
Here’s an example demonstrating these best practices: