How to Resize Matplotlib RadioButtons
How to Resize Matplotlib RadioButtons is an essential skill for data visualization enthusiasts and professionals alike. Matplotlib, a powerful plotting library in Python, offers various interactive elements, including RadioButtons. Resizing these RadioButtons can significantly enhance the user experience and overall aesthetics of your plots. In this extensive guide, we’ll explore multiple techniques and best practices for resizing Matplotlib RadioButtons, providing you with the knowledge to create visually appealing and interactive visualizations.
Understanding Matplotlib RadioButtons
Before diving into resizing techniques, it’s crucial to understand what Matplotlib RadioButtons are and how they function. RadioButtons in Matplotlib are interactive widgets that allow users to select one option from a group of mutually exclusive choices. They are particularly useful when you want to provide users with the ability to switch between different plot styles, data sets, or other visualization parameters.
Let’s start with a basic example of creating RadioButtons in Matplotlib:
import matplotlib.pyplot as plt
from matplotlib.widgets import RadioButtons

fig, ax = plt.subplots()
plt.subplots_adjust(left=0.3)

# Create some sample data
x = range(10)
y = [i**2 for i in x]

# Plot the data
line, = ax.plot(x, y)

# Create RadioButtons
rax = plt.axes([0.05, 0.7, 0.15, 0.15])
radio = RadioButtons(rax, ('red', 'blue', 'green'))

# Define a function to update the plot color
def color_func(label):
    line.set_color(label)
    plt.draw()

radio.on_clicked(color_func)

plt.title('How to Resize Matplotlib RadioButtons - Basic Example')
plt.show()
Output:
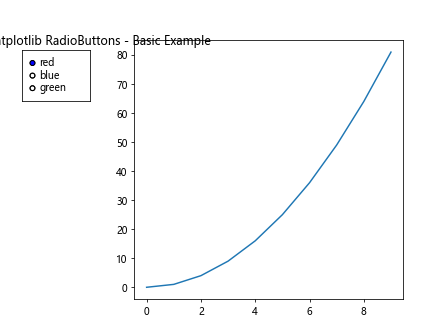
In this example, we create a simple line plot and add RadioButtons that allow the user to change the color of the line. The RadioButtons are positioned using the plt.axes() function, which takes four arguments: [left, bottom, width, height]. These values are normalized coordinates ranging from 0 to 1.
The Importance of Resizing Matplotlib RadioButtons
Resizing Matplotlib RadioButtons is crucial for several reasons:
- Improved visibility: Larger RadioButtons are easier to see and interact with, especially on high-resolution displays.
- Enhanced accessibility: Resized RadioButtons can make your visualizations more accessible to users with visual impairments.
- Aesthetic consistency: Properly sized RadioButtons can better match the overall style and scale of your plot.
- Responsive design: Resizing allows you to adapt the RadioButtons to different figure sizes and layouts.
Now that we understand the importance of resizing, let’s explore various techniques to achieve this goal.
Method 1: Adjusting the RadioButtons’ Axes
One of the simplest ways to resize Matplotlib RadioButtons is by adjusting the axes on which they are placed. By modifying the width and height parameters of the plt.axes() function, you can control the size of the RadioButtons.
Here’s an example of how to create larger RadioButtons:
import matplotlib.pyplot as plt
from matplotlib.widgets import RadioButtons

fig, ax = plt.subplots(figsize=(10, 6))
plt.subplots_adjust(left=0.3)

# Create some sample data
x = range(10)
y = [i**2 for i in x]

# Plot the data
line, = ax.plot(x, y)

# Create larger RadioButtons
rax = plt.axes([0.05, 0.4, 0.2, 0.3])  # Increased width and height
radio = RadioButtons(rax, ('red', 'blue', 'green'))

def color_func(label):
    line.set_color(label)
    plt.draw()

radio.on_clicked(color_func)

plt.title('How to Resize Matplotlib RadioButtons - Larger Buttons')
plt.show()
Output:

In this example, we’ve increased the width from 0.15 to 0.2 and the height from 0.15 to 0.3. This results in larger RadioButtons that are easier to see and interact with.
Method 2: Customizing RadioButtons’ Properties
Another approach to resizing Matplotlib RadioButtons is by customizing their properties directly. The RadioButtons widget allows you to modify various attributes, including the size of the circles and the font size of the labels.
Here’s an example demonstrating how to customize these properties:
import matplotlib.pyplot as plt
from matplotlib.widgets import RadioButtons

fig, ax = plt.subplots(figsize=(10, 6))
plt.subplots_adjust(left=0.3)

# Create some sample data
x = range(10)
y = [i**2 for i in x]

# Plot the data
line, = ax.plot(x, y)

# Create RadioButtons with custom properties
rax = plt.axes([0.05, 0.4, 0.2, 0.3])
radio = RadioButtons(rax, ('red', 'blue', 'green'))

# Customize RadioButtons
radio.circles.set_radius(0.08)  # Increase the size of the radio circles
for label in radio.labels:
    label.set_fontsize(14)  # Increase the font size of the labels

def color_func(label):
    line.set_color(label)
    plt.draw()

radio.on_clicked(color_func)

plt.title('How to Resize Matplotlib RadioButtons - Custom Properties')
plt.show()
In this example, we’ve increased the radius of the radio circles using radio.circles.set_radius(0.08) and enlarged the font size of the labels using a loop to set each label’s fontsize to 14.
Method 3: Using Figure-Relative Units
When resizing Matplotlib RadioButtons, it’s often helpful to use figure-relative units instead of absolute pixel values. This approach ensures that your RadioButtons scale appropriately when the figure size changes.
Here’s an example of how to use figure-relative units:
import matplotlib.pyplot as plt
from matplotlib.widgets import RadioButtons

fig, ax = plt.subplots(figsize=(10, 6))
plt.subplots_adjust(left=0.3)

# Create some sample data
x = range(10)
y = [i**2 for i in x]

# Plot the data
line, = ax.plot(x, y)

# Create RadioButtons using figure-relative units
fig_width, fig_height = fig.get_size_inches()
rax = plt.axes([0.05, 0.4, 0.2 * fig_width / fig_height, 0.3])
radio = RadioButtons(rax, ('red', 'blue', 'green'))

def color_func(label):
    line.set_color(label)
    plt.draw()

radio.on_clicked(color_func)

plt.title('How to Resize Matplotlib RadioButtons - Figure-Relative Units')
plt.show()
Output:
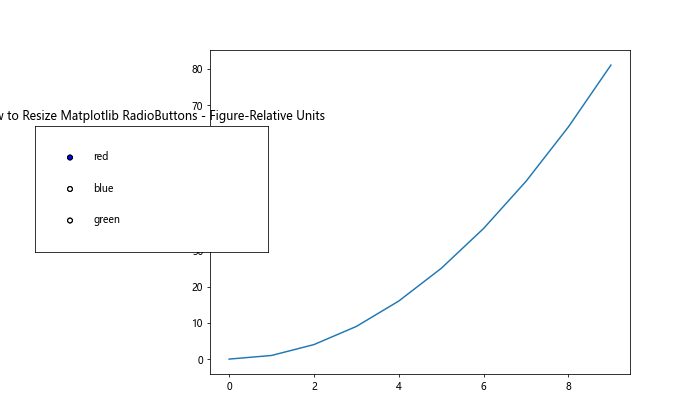
In this example, we calculate the aspect ratio of the figure using fig.get_size_inches() and adjust the width of the RadioButtons accordingly. This ensures that the RadioButtons maintain a consistent appearance across different figure sizes.
Method 4: Dynamic Resizing with Event Handling
For more advanced applications, you might want to dynamically resize the Matplotlib RadioButtons based on user interactions or changes in the figure size. This can be achieved by implementing event handling.
Here’s an example of how to resize RadioButtons dynamically when the figure is resized:
import matplotlib.pyplot as plt
from matplotlib.widgets import RadioButtons

fig, ax = plt.subplots(figsize=(10, 6))
plt.subplots_adjust(left=0.3)

# Create some sample data
x = range(10)
y = [i**2 for i in x]

# Plot the data
line, = ax.plot(x, y)

# Create RadioButtons
rax = plt.axes([0.05, 0.4, 0.2, 0.3])
radio = RadioButtons(rax, ('red', 'blue', 'green'))

def color_func(label):
    line.set_color(label)
    plt.draw()

radio.on_clicked(color_func)

# Function to update RadioButtons size
def update_radio_size(event):
    fig_width, fig_height = fig.get_size_inches()
    rax.set_position([0.05, 0.4, 0.2 * fig_width / fig_height, 0.3])
    plt.draw()

# Connect the resize event to the update function
fig.canvas.mpl_connect('resize_event', update_radio_size)

plt.title('How to Resize Matplotlib RadioButtons - Dynamic Resizing')
plt.show()
Output:
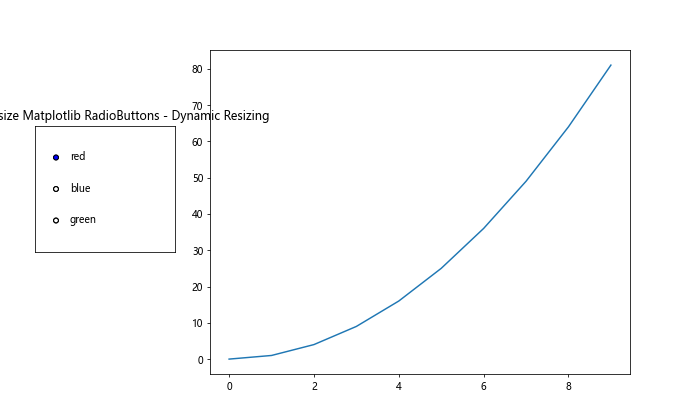
In this example, we define an update_radio_size function that recalculates the RadioButtons’ position and size based on the new figure dimensions. We then connect this function to the ‘resize_event’ of the figure canvas, ensuring that the RadioButtons are resized whenever the figure size changes.
Method 5: Resizing RadioButtons in Subplots
When working with multiple subplots, you may need to resize Matplotlib RadioButtons to fit within a specific subplot or to span across multiple subplots. Here’s an example of how to achieve this:
import matplotlib.pyplot as plt
from matplotlib.widgets import RadioButtons

fig, (ax1, ax2) = plt.subplots(1, 2, figsize=(12, 6))
plt.subplots_adjust(left=0.2)

# Create some sample data
x = range(10)
y1 = [i**2 for i in x]
y2 = [i**3 for i in x]

# Plot the data
line1, = ax1.plot(x, y1)
line2, = ax2.plot(x, y2)

# Create RadioButtons spanning both subplots
rax = plt.axes([0.05, 0.4, 0.1, 0.3])
radio = RadioButtons(rax, ('red', 'blue', 'green'))

def color_func(label):
    line1.set_color(label)
    line2.set_color(label)
    plt.draw()

radio.on_clicked(color_func)

ax1.set_title('How to Resize Matplotlib RadioButtons - Subplot 1')
ax2.set_title('How to Resize Matplotlib RadioButtons - Subplot 2')
plt.show()
Output:
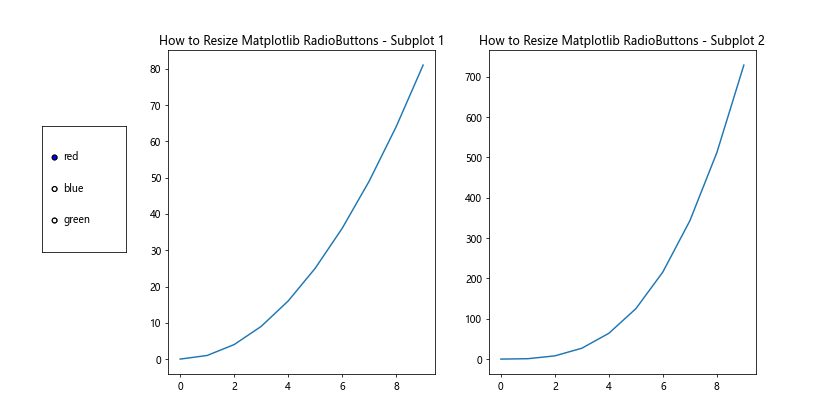
In this example, we create two subplots and position the RadioButtons to span both of them. The RadioButtons control the color of lines in both subplots simultaneously.
Method 6: Resizing RadioButtons with Custom Styling
To further enhance the appearance of your resized Matplotlib RadioButtons, you can apply custom styling. This includes changing colors, adding borders, and modifying the overall look of the widget.
Here’s an example of how to resize and style RadioButtons:
import matplotlib.pyplot as plt
from matplotlib.widgets import RadioButtons

fig, ax = plt.subplots(figsize=(10, 6))
plt.subplots_adjust(left=0.3)

# Create some sample data
x = range(10)
y = [i**2 for i in x]

# Plot the data
line, = ax.plot(x, y)

# Create RadioButtons with custom styling
rax = plt.axes([0.05, 0.4, 0.2, 0.3], facecolor='lightgoldenrodyellow')
radio = RadioButtons(rax, ('red', 'blue', 'green'))

# Customize RadioButtons
radio.circles.set_radius(0.08)
for circle in radio.circles:
    circle.set_facecolor('white')
    circle.set_edgecolor('black')
    circle.set_linewidth(2)

for label in radio.labels:
    label.set_fontsize(14)
    label.set_fontweight('bold')

def color_func(label):
    line.set_color(label)
    plt.draw()

radio.on_clicked(color_func)

plt.title('How to Resize Matplotlib RadioButtons - Custom Styling')
plt.show()
In this example, we’ve applied custom styling to the RadioButtons by changing the background color of the RadioButtons’ axes, modifying the appearance of the circles, and adjusting the font properties of the labels.
Method 7: Responsive Resizing with GridSpec
For more complex layouts, you can use Matplotlib’s GridSpec to create a responsive grid system that allows for easy resizing of RadioButtons. This method is particularly useful when you want to maintain consistent proportions across different screen sizes.
Here’s an example of how to use GridSpec for resizing RadioButtons:
import matplotlib.pyplot as plt
from matplotlib.widgets import RadioButtons
from matplotlib.gridspec import GridSpec

fig = plt.figure(figsize=(12, 6))
gs = GridSpec(1, 4, figure=fig)

# Create main plot area
ax = fig.add_subplot(gs[0, 1:])

# Create some sample data
x = range(10)
y = [i**2 for i in x]

# Plot the data
line, = ax.plot(x, y)

# Create RadioButtons in a dedicated grid cell
rax = fig.add_subplot(gs[0, 0])
radio = RadioButtons(rax, ('red', 'blue', 'green'))

def color_func(label):
    line.set_color(label)
    plt.draw()

radio.on_clicked(color_func)

# Customize RadioButtons
radio.circles.set_radius(0.1)
for label in radio.labels:
    label.set_fontsize(12)

plt.suptitle('How to Resize Matplotlib RadioButtons - GridSpec Layout')
plt.show()
In this example, we use GridSpec to create a 1×4 grid. The RadioButtons occupy the first cell, while the main plot takes up the remaining three cells. This layout automatically adjusts when the figure size changes, maintaining the relative sizes of the RadioButtons and the plot.
Method 8: Resizing RadioButtons for Touch Devices
When creating visualizations for touch devices, it’s important to make RadioButtons larger and more touch-friendly. Here’s an example of how to resize RadioButtons for better touch interaction:
import matplotlib.pyplot as plt
from matplotlib.widgets import RadioButtons

fig, ax = plt.subplots(figsize=(10, 6))
plt.subplots_adjust(left=0.4)

# Create some sample data
x = range(10)
y = [i**2 for i in x]

# Plot the data
line, = ax.plot(x, y)

# Create large, touch-friendly RadioButtons
rax = plt.axes([0.05, 0.3, 0.3, 0.4])
radio = RadioButtons(rax, ('red', 'blue', 'green'))

# Customize RadioButtons for touch
radio.circles.set_radius(0.12)
for circle in radio.circles:
    circle.set_linewidth(3)

for label in radio.labels:
    label.set_fontsize(16)

def color_func(label):
    line.set_color(label)
    plt.draw()

radio.on_clicked(color_func)

plt.title('How to Resize Matplotlib RadioButtons - Touch-Friendly')
plt.show()
In this example, we’ve significantly increased the size of the RadioButtons, made the circles larger, and increased the font size of the labels. These changes make the RadioButtons much easier to interact with on touch devices.
Method 9: Animated Resizing of RadioButtons
For a more dynamic user experience, you can implement animated resizing of Matplotlib RadioButtons. This can be particularly effective when you want to draw attention to the RadioButtons or create a more engaging interface.
Here’s an example of how to create animated resizing of RadioButtons:
import matplotlib.pyplot as plt
from matplotlib.widgets import RadioButtons
from matplotlib.animation import FuncAnimation

fig, ax = plt.subplots(figsize=(10, 6))
plt.subplots_adjust(left=0.3)

# Create some sample data
x = range(10)
y = [i**2 for i in x]

# Plot the data
line, = ax.plot(x, y)

# Create RadioButtons
rax = plt.axes([0.05, 0.4, 0.2, 0.3])
radio = RadioButtons(rax, ('red', 'blue', 'green'))

def color_func(label):
    line.set_color(label)
    plt.draw()

radio.on_clicked(color_func)

# Animation function
def animate(frame):
    scale = 1 + 0.1 * np.sin(frame * 0.1)
    radio.circles.set_radius(0.08 * scale)
    for label in radio.labels:
        label.set_fontsize(12 * scale)
    return radio.circles,

# Create animation
anim = FuncAnimation(fig, animate, frames=200, interval=50, blit=True)

plt.title('How to Resize Matplotlib RadioButtons - Animated Resizing')
plt.show()
In this example, we use Matplotlib’s FuncAnimation to create a pulsing effect for the RadioButtons. The animate function adjusts the size of the radio circles and the font size of the labels based on a sine wave, creating a smooth, cyclical resizing animation.
Method 10: Resizing RadioButtons with Sliders
Combining RadioButtons with other interactive elements can provide users with more control over the visualization. Here’s an example of how to resize Matplotlib RadioButtons using a Slider:
import matplotlib.pyplot as plt
from matplotlib.widgets import RadioButtons, Slider

fig, ax = plt.subplots(figsize=(10, 8))
plt.subplots_adjust(left=0.3, bottom=0.25)

# Create some sample data
x = range(10)
y = [i**2 for i in x]

# Plot the data
line, = ax.plot(x, y)

# Create RadioButtons
rax = plt.axes([0.05, 0.4, 0.2, 0.3])
radio = RadioButtons(rax, ('red', 'blue', 'green'))

def color_func(label):
    line.set_color(label)
    plt.draw()

radio.on_clicked(color_func)

# Create Slider for resizing RadioButtons
sax = plt.axes([0.1, 0.1, 0.8, 0.03])
size_slider = Slider(sax, 'RadioButton Size', 0.05, 0.15, valinit=0.08)

def update_size(val):
    radio.circles.set_radius(val)
    for label in radio.labels:
        label.set_fontsize(val * 150)
    plt.draw()

size_slider.on_changed(update_size)

plt.title('How to Resize Matplotlib RadioButtons - Slider Control')
plt.show()
Output:
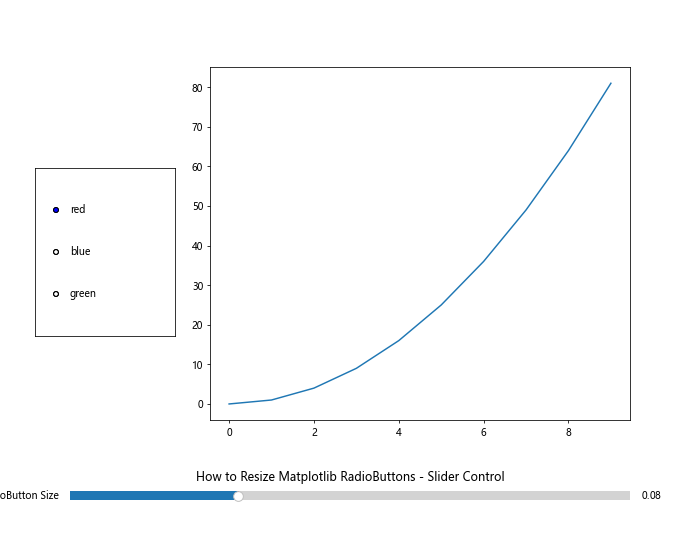
In this example, we’ve added a Slider widget that allows users to dynamically adjust the size of the RadioButtons. The update_size function changes both the radius of the radio circles and the font size of the labels based on the Slider’s value.
Best Practices for Resizing Matplotlib RadioButtons
When resizing Matplotlib RadioButtons, keep the following best practices in mind:
- Maintain proportions: Ensure that the RadioButtons remain visually balanced with the rest of your plot.
- Consider accessibility: Make RadioButtons large enough for easy interaction, especially for touch devices or users with motor impairments.
- Use responsive design: Implement resizing techniques that adapt to different figure sizes and screen resolutions.
- Test on various devices: Verify that your resized RadioButtons work well on desktop computers, tablets, and smartphones.
- Maintain readability: When increasing the size of RadioButtons, also adjust font sizes and spacing to keep labels legible.
- Use consistent styling: Ensure that the appearance of your resized RadioButtons matches the overall style of your visualization.
- Optimize performance: For complex visualizations with many interactive elements, be mindful of performance impacts when resizing RadioButtons.
Troubleshooting Common Issues
When resizing Matplotlib RadioButtons, you may encounter some common issues. Here are a few problems and their solutions:
- RadioButtons overlap with other plot elements:
- Adjust the position and size of the RadioButtons using the
plt.axes()function. - Use
plt.subplots_adjust()to create more space for the RadioButtons.
- Adjust the position and size of the RadioButtons using the
- RadioButtons are too small on high-resolution displays:
- Increase the size of the RadioButtons and their labels.
- Use figure-relative units instead of absolute pixel values.
- RadioButtons don’t resize properly when the figure is resized:
- Implement dynamic resizing using event handling or responsive layout techniques like GridSpec.
- Custom styling is lost after resizing:
- Apply custom styles after resizing operations or within the resizing function.
- RadioButtons are cut off in saved figures:
- Adjust the figure size or RadioButtons position before saving.
- Use
plt.tight_layout()orfig.savefig()with thebbox_inches='tight'parameter.
Advanced Techniques for Resizing Matplotlib RadioButtons
For those looking to push the boundaries of RadioButton customization, here are some advanced techniques:
Custom RadioButton Class
Create a custom RadioButton class that inherits from Matplotlib’s RadioButtons to add new functionality:
import matplotlib.pyplot as plt
from matplotlib.widgets import RadioButtons

class ResizableRadioButtons(RadioButtons):
    def __init__(self, ax, labels, active=0, size_factor=1.0):
        super().__init__(ax, labels, active)
        self.size_factor = size_factor
        self.update_sizes()

    def update_sizes(self):
        self.circles.set_radius(0.05 * self.size_factor)
        for label in self.labels:
            label.set_fontsize(10 * self.size_factor)

    def set_size_factor(self, factor):
        self.size_factor = factor
        self.update_sizes()

fig, ax = plt.subplots(figsize=(10, 6))
plt.subplots_adjust(left=0.3)

x = range(10)
y = [i**2 for i in x]
line, = ax.plot(x, y)

rax = plt.axes([0.05, 0.4, 0.2, 0.3])
radio = ResizableRadioButtons(rax, ('red', 'blue', 'green'), size_factor=1.5)

def color_func(label):
    line.set_color(label)
    plt.draw()

radio.on_clicked(color_func)

plt.title('How to Resize Matplotlib RadioButtons - Custom Class')
plt.show()
This custom class allows for easy resizing of RadioButtons by adjusting a single size factor.
Keyboard Shortcuts for Resizing
Implement keyboard shortcuts to resize RadioButtons:
import matplotlib.pyplot as plt
from matplotlib.widgets import RadioButtons

fig, ax = plt.subplots(figsize=(10, 6))
plt.subplots_adjust(left=0.3)

x = range(10)
y = [i**2 for i in x]
line, = ax.plot(x, y)

rax = plt.axes([0.05, 0.4, 0.2, 0.3])
radio = RadioButtons(rax, ('red', 'blue', 'green'))

def color_func(label):
    line.set_color(label)
    plt.draw()

radio.on_clicked(color_func)

def on_key(event):
    if event.key == '+':
        radio.circles.set_radius(radio.circles.get_radius() * 1.1)
    elif event.key == '-':
        radio.circles.set_radius(radio.circles.get_radius() / 1.1)
    plt.draw()

fig.canvas.mpl_connect('key_press_event', on_key)

plt.title('How to Resize Matplotlib RadioButtons - Keyboard Shortcuts')
plt.show()
Output:

This example allows users to resize RadioButtons using the ‘+’ and ‘-‘ keys.
Conclusion
Mastering how to resize Matplotlib RadioButtons is a valuable skill that can significantly enhance the interactivity and user experience of your data visualizations. Throughout this comprehensive guide, we’ve explored various methods and techniques for resizing RadioButtons, from simple adjustments to advanced customizations.
We’ve covered:
- Basic resizing techniques
- Custom styling and properties
- Responsive design approaches
- Dynamic and animated resizing
- Integration with other widgets
- Best practices and troubleshooting tips
- Advanced techniques for further customization
By applying these methods, you can create more engaging, accessible, and visually appealing interactive plots. Remember to consider your audience and the context of your visualization when deciding how to resize your RadioButtons.