How to Remove Ticks from Matplotlib Plots
How to Remove Ticks from Matplotlib Plots is an essential skill for data visualization enthusiasts and professionals alike. Matplotlib, a powerful plotting library in Python, offers various ways to customize plot elements, including ticks. In this extensive guide, we’ll explore different methods to remove ticks from Matplotlib plots, enhancing the clarity and aesthetics of your visualizations.
Understanding Ticks in Matplotlib Plots
Before diving into how to remove ticks from Matplotlib plots, it’s crucial to understand what ticks are and their role in data visualization. Ticks are the small marks along the axes of a plot that indicate specific values. They help readers interpret the scale and range of data represented in the plot. However, there are scenarios where removing ticks can improve the overall appearance and readability of your visualizations.
Why Remove Ticks from Matplotlib Plots?
There are several reasons why you might want to remove ticks from Matplotlib plots:
- Minimalist design: Removing ticks can create a cleaner, more minimalist look for your plots.
- Emphasizing trends: In some cases, exact values may be less important than overall trends, and removing ticks can help focus attention on the data’s shape.
- Custom labeling: You might want to replace default ticks with custom labels or annotations.
- Specialized plot types: Certain plot types, like heatmaps or image plots, may benefit from the absence of ticks.
Now that we understand the importance of knowing how to remove ticks from Matplotlib plots, let’s explore various methods to achieve this.
Method 1: Using set_tick_params() to Remove Ticks from Matplotlib Plots
One of the simplest ways to remove ticks from Matplotlib plots is by using the set_tick_params() method. This method allows you to control various aspects of tick appearance, including their visibility.
Here’s an example of how to remove ticks from Matplotlib plots using set_tick_params():
import matplotlib.pyplot as plt
import numpy as np

# Generate sample data
x = np.linspace(0, 10, 100)
y = np.sin(x)

# Create the plot
plt.figure(figsize=(8, 6))
plt.plot(x, y)
plt.title("How to Remove Ticks from Matplotlib Plots - how2matplotlib.com")

# Remove ticks from both axes
plt.gca().set_tick_params(top=False, bottom=False, left=False, right=False)

# Show the plot
plt.show()
In this example, we create a simple sine wave plot and then use set_tick_params() to remove ticks from all sides of the plot. The gca() function gets the current axes, and we set all tick parameters to False to hide them.
Method 2: Using tick_params() to Remove Ticks from Matplotlib Plots
Another approach to remove ticks from Matplotlib plots is by using the tick_params() function. This function provides a more concise way to modify tick properties for both axes simultaneously.
Here’s an example of how to remove ticks from Matplotlib plots using tick_params():
import matplotlib.pyplot as plt
import numpy as np

# Generate sample data
x = np.linspace(0, 10, 100)
y = np.cos(x)

# Create the plot
plt.figure(figsize=(8, 6))
plt.plot(x, y)
plt.title("How to Remove Ticks from Matplotlib Plots - how2matplotlib.com")

# Remove ticks from both axes
plt.tick_params(axis='both', which='both', length=0)

# Show the plot
plt.show()
Output:
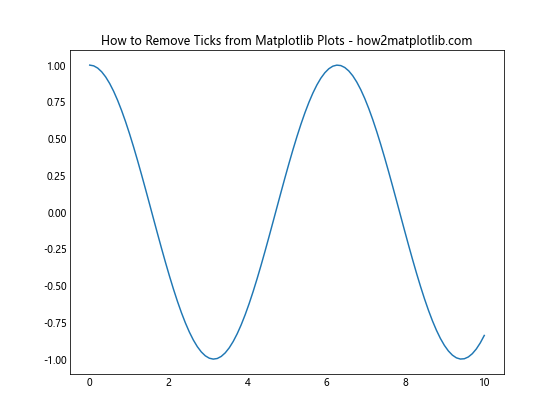
In this example, we create a cosine wave plot and use tick_params() to remove ticks from both axes. By setting the length parameter to 0, we effectively hide the ticks while keeping the labels visible.
Method 3: Using set_xticks() and set_yticks() to Remove Ticks from Matplotlib Plots
For more fine-grained control over tick removal, you can use the set_xticks() and set_yticks() methods. These methods allow you to specify exactly which ticks should be displayed or removed.
Here’s an example of how to remove ticks from Matplotlib plots using set_xticks() and set_yticks():
import matplotlib.pyplot as plt
import numpy as np

# Generate sample data
x = np.linspace(0, 10, 100)
y = np.tan(x)

# Create the plot
fig, ax = plt.subplots(figsize=(8, 6))
ax.plot(x, y)
ax.set_title("How to Remove Ticks from Matplotlib Plots - how2matplotlib.com")

# Remove ticks from both axes
ax.set_xticks([])
ax.set_yticks([])

# Show the plot
plt.show()
Output:
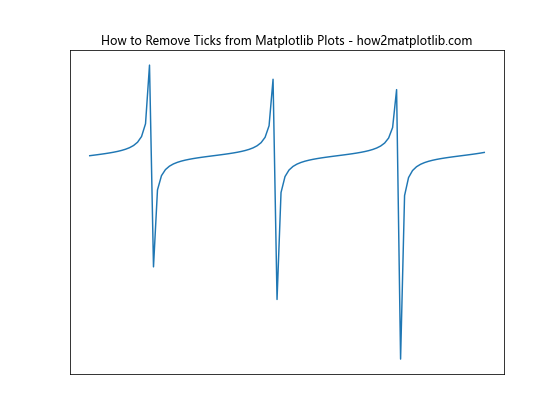
In this example, we create a tangent function plot and use set_xticks([]) and set_yticks([]) to remove all ticks from both axes. By passing an empty list to these methods, we effectively remove all ticks while keeping the axes visible.
Method 4: Using set_visible() to Remove Ticks from Matplotlib Plots
Another powerful method to remove ticks from Matplotlib plots is by using the set_visible() method. This approach allows you to hide both the ticks and their labels in one go.
Here’s an example of how to remove ticks from Matplotlib plots using set_visible():
import matplotlib.pyplot as plt
import numpy as np

# Generate sample data
x = np.linspace(0, 10, 100)
y = np.exp(x)

# Create the plot
fig, ax = plt.subplots(figsize=(8, 6))
ax.plot(x, y)
ax.set_title("How to Remove Ticks from Matplotlib Plots - how2matplotlib.com")

# Remove ticks and labels from both axes
ax.xaxis.set_visible(False)
ax.yaxis.set_visible(False)

# Show the plot
plt.show()
Output:
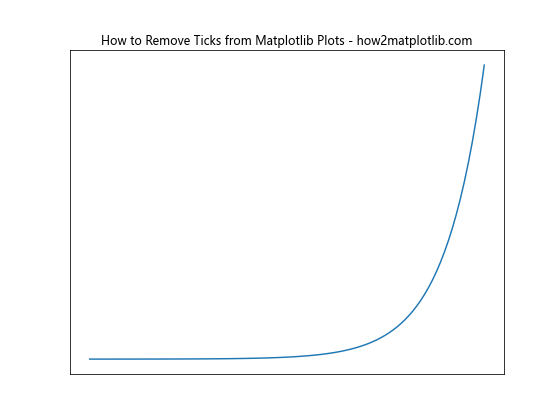
In this example, we create an exponential function plot and use set_visible(False) on both the x-axis and y-axis to hide ticks and labels completely. This method is particularly useful when you want to create a clean, minimalist plot without any axis markings.
Method 5: Using setp() to Remove Ticks from Matplotlib Plots
The setp() function in Matplotlib provides a flexible way to set multiple properties of plot elements, including ticks. This method can be particularly useful when you want to remove ticks from multiple subplots simultaneously.
Here’s an example of how to remove ticks from Matplotlib plots using setp():
import matplotlib.pyplot as plt
import numpy as np

# Generate sample data
x = np.linspace(0, 10, 100)
y1 = np.sin(x)
y2 = np.cos(x)

# Create subplots
fig, (ax1, ax2) = plt.subplots(1, 2, figsize=(12, 5))

# Plot data
ax1.plot(x, y1)
ax2.plot(x, y2)

# Set titles
ax1.set_title("Sine - How to Remove Ticks from Matplotlib Plots - how2matplotlib.com")
ax2.set_title("Cosine - How to Remove Ticks from Matplotlib Plots - how2matplotlib.com")

# Remove ticks from both subplots
plt.setp(ax1.get_xticklabels(), visible=False)
plt.setp(ax1.get_yticklabels(), visible=False)
plt.setp(ax2.get_xticklabels(), visible=False)
plt.setp(ax2.get_yticklabels(), visible=False)

# Show the plot
plt.tight_layout()
plt.show()
Output:
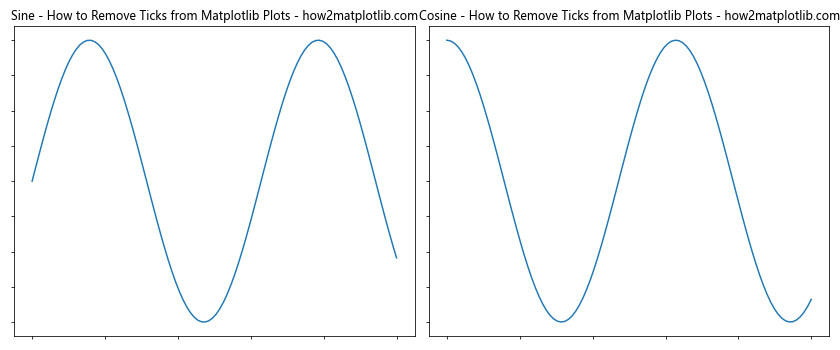
In this example, we create two subplots with sine and cosine functions. We then use setp() to hide the tick labels for both x and y axes on both subplots. This method allows for more granular control over tick visibility across multiple plots.
Method 6: Using Axis.set_ticks() to Remove Ticks from Matplotlib Plots
The Axis.set_ticks() method provides another way to remove ticks from Matplotlib plots. This method allows you to set the tick locations explicitly, and by passing an empty list, you can effectively remove all ticks.
Here’s an example of how to remove ticks from Matplotlib plots using Axis.set_ticks():
import matplotlib.pyplot as plt
import numpy as np

# Generate sample data
x = np.linspace(0, 10, 100)
y = x**2

# Create the plot
fig, ax = plt.subplots(figsize=(8, 6))
ax.plot(x, y)
ax.set_title("How to Remove Ticks from Matplotlib Plots - how2matplotlib.com")

# Remove ticks from both axes
ax.xaxis.set_ticks([])
ax.yaxis.set_ticks([])

# Show the plot
plt.show()
Output:
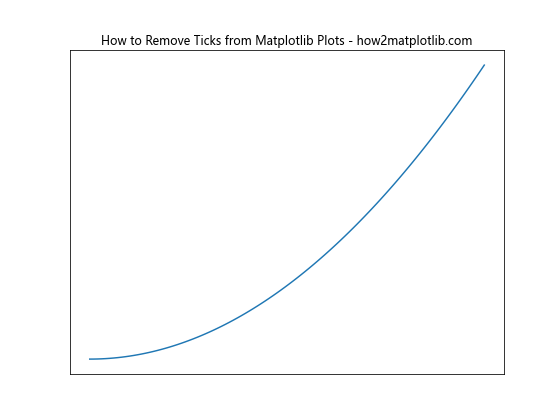
In this example, we create a quadratic function plot and use set_ticks([]) on both the x-axis and y-axis to remove all ticks. This method is particularly useful when you want to keep the axes visible but remove all tick marks.
Method 7: Using plt.axis(‘off’) to Remove Ticks from Matplotlib Plots
For situations where you want to remove not just the ticks but the entire axis, including the spines, you can use the plt.axis('off') command. This method provides a quick way to create a completely clean plot without any axis elements.
Here’s an example of how to remove ticks from Matplotlib plots using plt.axis('off'):
import matplotlib.pyplot as plt
import numpy as np

# Generate sample data
x = np.linspace(0, 10, 100)
y = np.log(x)

# Create the plot
plt.figure(figsize=(8, 6))
plt.plot(x, y)
plt.title("How to Remove Ticks from Matplotlib Plots - how2matplotlib.com")

# Remove all axis elements, including ticks
plt.axis('off')

# Show the plot
plt.show()
Output:
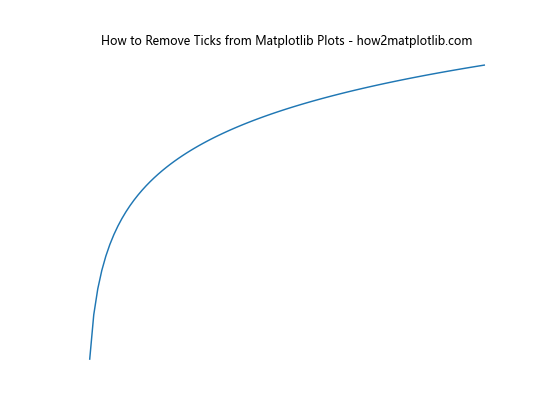
In this example, we create a logarithmic function plot and use plt.axis('off') to remove all axis elements, including ticks, labels, and spines. This method is useful when you want to create a plot that focuses solely on the data without any additional visual elements.
Method 8: Using ax.axes.get_xaxis().set_visible(False) to Remove Ticks from Matplotlib Plots
Another method to remove ticks from Matplotlib plots involves using the set_visible() method on the axis object directly. This approach allows you to hide the entire axis, including ticks and labels.
Here’s an example of how to remove ticks from Matplotlib plots using this method:
import matplotlib.pyplot as plt
import numpy as np

# Generate sample data
x = np.linspace(0, 10, 100)
y = np.sqrt(x)

# Create the plot
fig, ax = plt.subplots(figsize=(8, 6))
ax.plot(x, y)
ax.set_title("How to Remove Ticks from Matplotlib Plots - how2matplotlib.com")

# Remove x-axis and y-axis, including ticks
ax.axes.get_xaxis().set_visible(False)
ax.axes.get_yaxis().set_visible(False)

# Show the plot
plt.show()
Output:
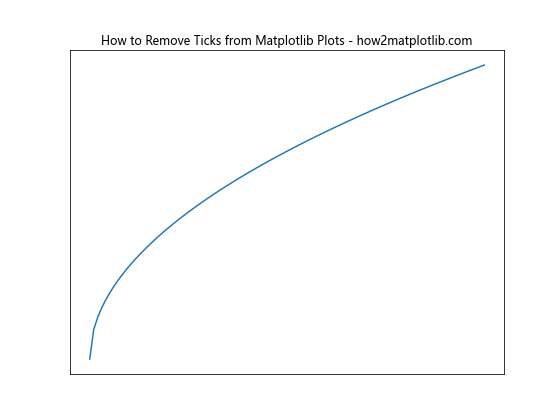
In this example, we create a square root function plot and use set_visible(False) on both the x-axis and y-axis objects to hide them completely. This method is particularly useful when you want to create a clean plot without any axis elements while keeping the plot area intact.
Method 9: Using ax.tick_params() with labelbottom and labelleft to Remove Ticks from Matplotlib Plots
The ax.tick_params() method provides a way to control various aspects of tick appearance, including their labels. By setting labelbottom and labelleft to False, you can remove tick labels while keeping the tick marks visible.
Here’s an example of how to remove ticks from Matplotlib plots using this method:
import matplotlib.pyplot as plt
import numpy as np

# Generate sample data
x = np.linspace(0, 10, 100)
y = 1 / (1 + np.exp(-x))

# Create the plot
fig, ax = plt.subplots(figsize=(8, 6))
ax.plot(x, y)
ax.set_title("How to Remove Ticks from Matplotlib Plots - how2matplotlib.com")

# Remove tick labels while keeping tick marks
ax.tick_params(labelbottom=False, labelleft=False)

# Show the plot
plt.show()
Output:
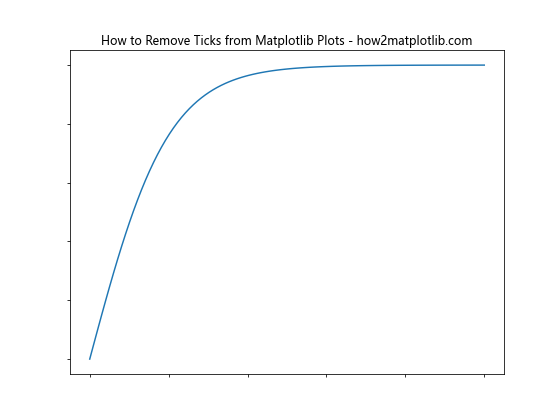
In this example, we create a sigmoid function plot and use ax.tick_params() to remove tick labels from both axes while keeping the tick marks visible. This method is useful when you want to maintain the visual structure of the axes but remove the numerical labels.
Method 10: Using ax.set_xticks() and ax.set_yticks() with Minor Ticks to Remove Ticks from Matplotlib Plots
When working with plots that have both major and minor ticks, you might want to remove them separately. The set_xticks() and set_yticks() methods can be used in combination with set_xticks([], minor=True) and set_yticks([], minor=True) to remove both major and minor ticks.
Here’s an example of how to remove ticks from Matplotlib plots using this method:
import matplotlib.pyplot as plt
import numpy as np

# Generate sample data
x = np.linspace(0, 10, 100)
y = np.sin(x) * np.exp(-0.1 * x)

# Create the plot
fig, ax = plt.subplots(figsize=(8, 6))
ax.plot(x, y)
ax.set_title("How to Remove Ticks from Matplotlib Plots - how2matplotlib.com")

# Remove major and minor ticks
ax.set_xticks([])
ax.set_yticks([])
ax.set_xticks([], minor=True)
ax.set_yticks([], minor=True)

# Show the plot
plt.show()
Output:
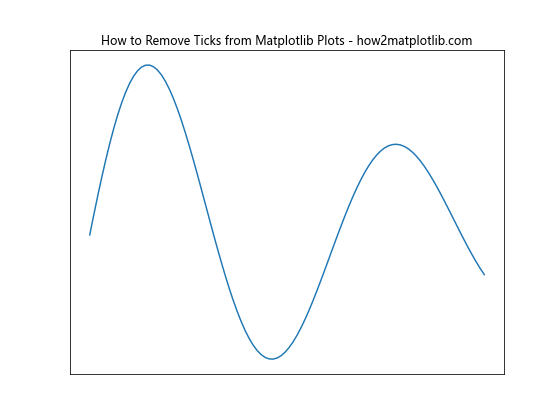
In this example, we create a damped sine wave plot and use a combination of set_xticks() and set_yticks() methods to remove both major and minor ticks from both axes. This approach ensures that all tick marks are removed, creating a clean plot without any axis markings.
Advanced Techniques: How to Remove Ticks from Matplotlib Plots Selectively
While removing all ticks from Matplotlib plots can create clean and minimalist visualizations, there may be situations where you want to remove ticks selectively. Let’s explore some advanced techniques for selective tick removal.
Removing Ticks from One Axis Only
Sometimes, you may want to remove ticks from only one axis while keeping them on the other. Here’s how you can achieve this:
import matplotlib.pyplot as plt
import numpy as np

# Generate sample data
x = np.linspace(0, 10, 100)
y = np.sin(x) + np.random.normal(0, 0.1, 100)

# Create the plot
fig, ax = plt.subplots(figsize=(8, 6))
ax.scatter(x, y)
ax.set_title("How to Remove Ticks from Matplotlib Plots - how2matplotlib.com")

# Remove ticks from x-axis only
ax.set_xticks([])

# Show the plot
plt.show()
Output:
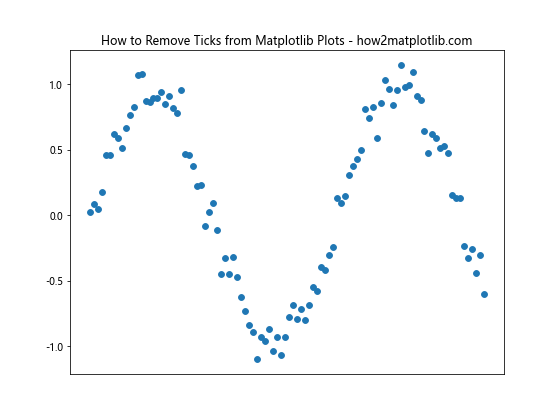
In this example, we create a scatter plot and remove ticks only from the x-axis using ax.set_xticks([]). This technique is useful when you want to emphasize the scale on one axis while simplifying the other.
Removing Ticks at Specific Positions
You might want to remove ticks at specific positions while keeping others. Here’s how you can do this:
import matplotlib.pyplot as plt
import numpy as np

# Generate sample data
x = np.linspace(0, 10, 100)
y = np.cos(x) * np.exp(-0.1 * x)

# Create the plot
fig, ax = plt.subplots(figsize=(8, 6))
ax.plot(x, y)
ax.set_title("How to Remove Ticks from Matplotlib Plots - how2matplotlib.com")

# Set custom ticks, removing some
ax.set_xticks([0, 2, 4, 6, 8, 10])
ax.set_yticks([-1, -0.5, 0, 0.5, 1])

# Show the plot
plt.show()
Output:
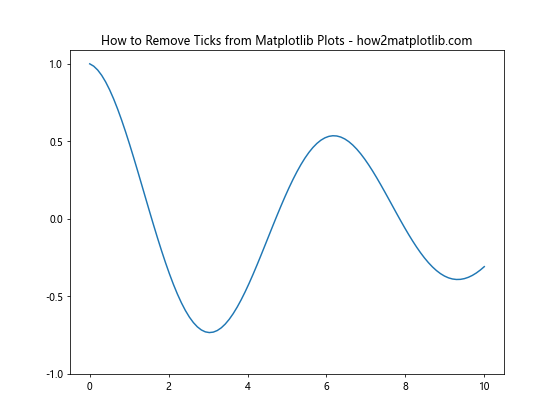
In this example, we create a damped cosine wave plot and set custom ticks for both axes using ax.set_xticks() and ax.set_yticks(). By specifying only the tick positions we want to keep, we effectively remove ticks at other positions.
Removing Major Ticks While Keeping Minor Ticks
In some cases, you might want to remove major ticks while keeping minor ticks for a more subtle scale indication. Here’s how you can achieve this:
import matplotlib.pyplot as plt
import numpy as np

# Generate sample data
x = np.linspace(0, 10, 100)
y = np.tan(x)

# Create the plot
fig, ax = plt.subplots(figsize=(8, 6))
ax.plot(x, y)
ax.set_title("How to Remove Ticks from Matplotlib Plots - how2matplotlib.com")

# Remove major ticks
ax.set_xticks([])
ax.set_yticks([])

# Add minor ticks
ax.minorticks_on()

# Show the plot
plt.show()
Output:
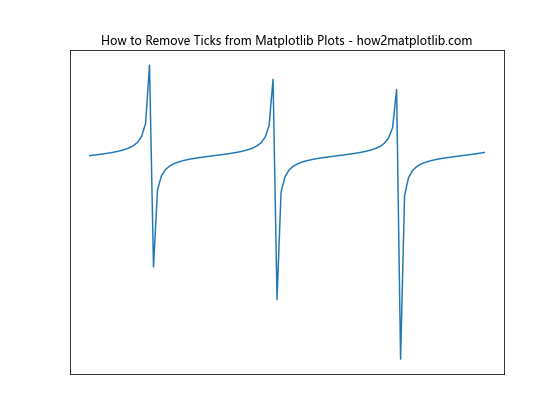
In this example, we create a tangent function plot, remove all major ticks using ax.set_xticks([]) and ax.set_yticks([]), and then turn on minor ticks using ax.minorticks_on(). This creates a plot with subtle scale indications without the more prominent major ticks.
Best Practices for Removing Ticks from Matplotlib Plots
When learning how to remove ticks from Matplotlib plots, it’s important to consider some best practices to ensure your visualizations are both effective and aesthetically pleasing:
- Consider your audience: Before removing ticks, think about who will be viewing your plot and whether they need the precise values that ticks provide.
Maintain context: Even when removing ticks, try to provide some context for the scale of your data through other means, such as annotations or text labels.
Be consistent: If you’re creating multiple plots for a single presentation or report, be consistent in your tick removal approach across all plots.
Use appropriate methods: Choose the tick removal method that best suits your specific needs and the type of plot you’re creating.
Test different approaches: Experiment with various tick removal techniques to find the one that best enhances your data visualization.
Common Pitfalls When Removing Ticks from Matplotlib Plots
As you learn how to remove ticks from Matplotlib plots, be aware of these common pitfalls: