How to Remove the Frame from a Matplotlib Figure in Python

How to Remove the Frame from a Matplotlib Figure in Python

How to remove the frame from a Matplotlib figure in Python is an essential skill for creating clean and professional-looking visualizations. This article will explore various techniques and methods to achieve this goal, providing detailed explanations and easy-to-understand code examples. By the end of this guide, you’ll be well-equipped to remove frames from your Matplotlib figures and enhance the overall appearance of your plots.

Understanding the Importance of Frame Removal in Matplotlib

Before diving into the specifics of how to remove the frame from a Matplotlib figure in Python, it’s crucial to understand why this technique is valuable. Removing the frame can:

  1. Enhance the visual appeal of your plots
  2. Reduce clutter and distractions
  3. Focus attention on the data itself
  4. Create a more minimalist and modern design

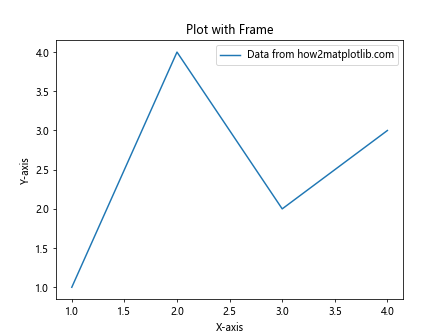
Let’s start with a basic example of a Matplotlib figure with a frame:

import matplotlib.pyplot as plt

# Create a simple plot
plt.plot([1, 2, 3, 4], [1, 4, 2, 3], label='Data from how2matplotlib.com')
plt.title('Plot with Frame')
plt.xlabel('X-axis')
plt.ylabel('Y-axis')
plt.legend()

# Display the plot
plt.show()

Output:
How to Remove the Frame from a Matplotlib Figure in Python

This code creates a simple line plot with a frame. Now, let’s explore various methods to remove this frame and create a cleaner visualization.

Method 1: Using plt.axis(‘off’) to Remove the Frame

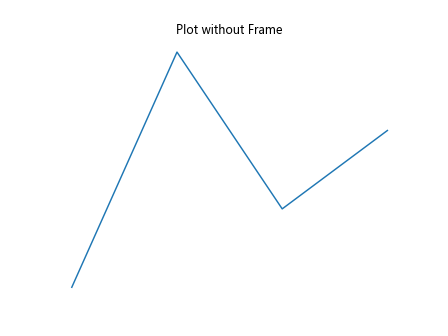
One of the simplest ways to remove the frame from a Matplotlib figure in Python is by using the plt.axis('off') command. This method turns off all axis lines, ticks, and labels, effectively removing the frame.

Here’s an example of how to remove the frame using this method:

import matplotlib.pyplot as plt

# Create a simple plot
plt.plot([1, 2, 3, 4], [1, 4, 2, 3], label='Data from how2matplotlib.com')
plt.title('Plot without Frame')

# Remove the frame
plt.axis('off')

# Display the plot
plt.show()

Output:
How to Remove the Frame from a Matplotlib Figure in Python

In this example, we’ve added the plt.axis('off') line before displaying the plot. This command removes all axis elements, including the frame, ticks, and labels.

Method 2: Using spines to Remove the Frame

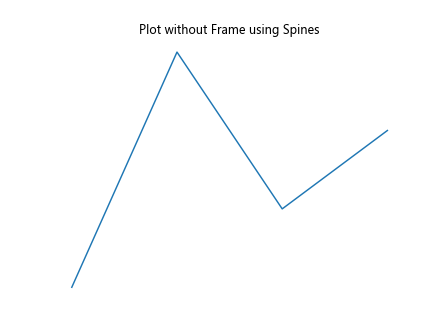
Another way to remove the frame from a Matplotlib figure in Python is by manipulating the spines. Spines are the lines that connect the axis tick marks and form the boundaries of the data area. By setting the visibility of all spines to False, we can effectively remove the frame.

Here’s an example:

import matplotlib.pyplot as plt

# Create a figure and axis objects
fig, ax = plt.subplots()

# Plot the data
ax.plot([1, 2, 3, 4], [1, 4, 2, 3], label='Data from how2matplotlib.com')
ax.set_title('Plot without Frame using Spines')

# Remove the frame
for spine in ax.spines.values():
    spine.set_visible(False)

# Remove ticks
ax.tick_params(left=False, bottom=False, labelleft=False, labelbottom=False)

# Display the plot
plt.show()

Output:
How to Remove the Frame from a Matplotlib Figure in Python

In this example, we iterate through all spines and set their visibility to False. We also remove the ticks and tick labels to complete the frameless look.

Method 3: Using ax.set_axis_off() to Remove the Frame

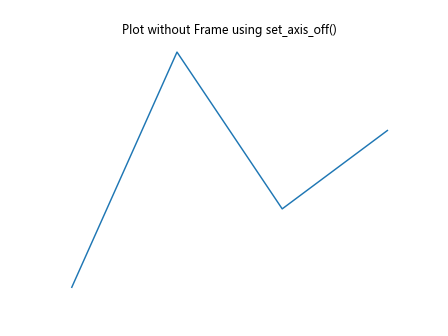
Similar to the plt.axis('off') method, we can use ax.set_axis_off() when working with Axes objects. This method is particularly useful when dealing with subplots or more complex figure layouts.

Here’s an example of how to remove the frame from a Matplotlib figure in Python using this method:

import matplotlib.pyplot as plt

# Create a figure and axis objects
fig, ax = plt.subplots()

# Plot the data
ax.plot([1, 2, 3, 4], [1, 4, 2, 3], label='Data from how2matplotlib.com')
ax.set_title('Plot without Frame using set_axis_off()')

# Remove the frame
ax.set_axis_off()

# Display the plot
plt.show()

Output:
How to Remove the Frame from a Matplotlib Figure in Python

This method achieves the same result as plt.axis('off') but is more suitable when working with specific Axes objects.

Method 4: Removing Specific Spines

Sometimes, you may want to remove only specific parts of the frame while keeping others. In this case, you can target individual spines and set their visibility to False.

Here’s an example of how to remove specific spines from a Matplotlib figure in Python:

import matplotlib.pyplot as plt

# Create a figure and axis objects
fig, ax = plt.subplots()

# Plot the data
ax.plot([1, 2, 3, 4], [1, 4, 2, 3], label='Data from how2matplotlib.com')
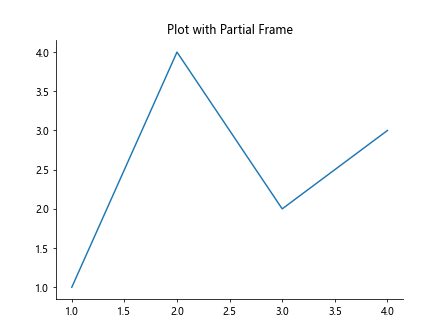
ax.set_title('Plot with Partial Frame')

# Remove top and right spines
ax.spines['top'].set_visible(False)
ax.spines['right'].set_visible(False)

# Display the plot
plt.show()

Output:
How to Remove the Frame from a Matplotlib Figure in Python

In this example, we’ve removed only the top and right spines, creating a plot with a partial frame.

Method 5: Using seaborn to Remove the Frame

Seaborn, a statistical data visualization library built on top of Matplotlib, provides an easy way to remove the frame from a Matplotlib figure in Python. The sns.despine() function can be used to remove specific spines or all spines at once.

Here’s an example:

import matplotlib.pyplot as plt
import seaborn as sns

# Set the style to remove the frame
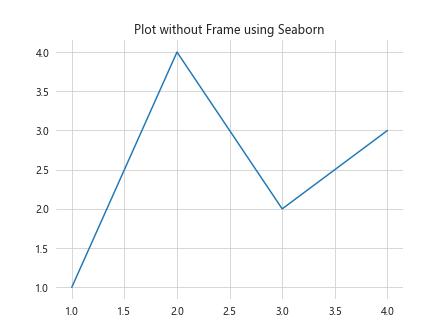
sns.set_style("whitegrid")

# Create a simple plot
plt.plot([1, 2, 3, 4], [1, 4, 2, 3], label='Data from how2matplotlib.com')
plt.title('Plot without Frame using Seaborn')

# Remove all spines
sns.despine(left=True, bottom=True, right=True, top=True)

# Display the plot
plt.show()

Output:
How to Remove the Frame from a Matplotlib Figure in Python

In this example, we first set the Seaborn style to “whitegrid” and then use sns.despine() to remove all spines, effectively removing the frame.

Method 6: Customizing the Frame Removal

Sometimes, you may want to remove the frame but keep certain elements, such as axis labels or ticks. Here’s an example of how to achieve this level of customization:

import matplotlib.pyplot as plt

# Create a figure and axis objects
fig, ax = plt.subplots()

# Plot the data
ax.plot([1, 2, 3, 4], [1, 4, 2, 3], label='Data from how2matplotlib.com')
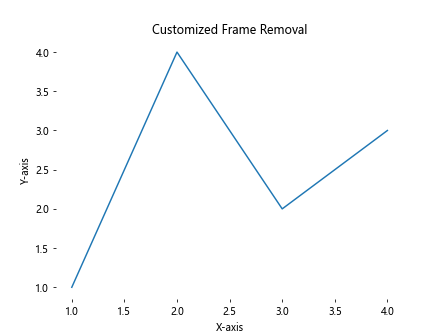
ax.set_title('Customized Frame Removal')

# Remove the frame
for spine in ax.spines.values():
    spine.set_visible(False)

# Keep bottom and left ticks
ax.tick_params(left=True, bottom=True, labelleft=True, labelbottom=True)

# Set axis labels
ax.set_xlabel('X-axis')
ax.set_ylabel('Y-axis')

# Display the plot
plt.show()

Output:
How to Remove the Frame from a Matplotlib Figure in Python

In this example, we remove the frame but keep the bottom and left ticks, as well as the axis labels, creating a clean yet informative plot.

Method 7: Removing the Frame in 3D Plots

Removing the frame from a 3D plot in Matplotlib requires a slightly different approach. Here’s an example of how to remove the frame from a Matplotlib figure in Python when working with 3D plots:

import matplotlib.pyplot as plt
from mpl_toolkits.mplot3d import Axes3D
import numpy as np

# Create a figure and 3D axis
fig = plt.figure()
ax = fig.add_subplot(111, projection='3d')

# Generate some sample data
x = np.linspace(-5, 5, 100)
y = np.linspace(-5, 5, 100)
X, Y = np.meshgrid(x, y)
Z = np.sin(np.sqrt(X**2 + Y**2))

# Create the surface plot
surf = ax.plot_surface(X, Y, Z, cmap='viridis')

# Remove the frame
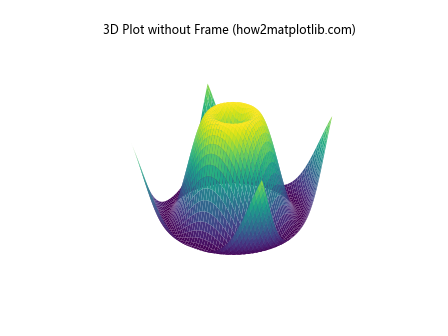
ax.set_axis_off()

# Set the title
ax.set_title('3D Plot without Frame (how2matplotlib.com)')

# Display the plot
plt.show()

Output:
How to Remove the Frame from a Matplotlib Figure in Python

In this example, we use ax.set_axis_off() to remove the frame from the 3D plot, creating a clean and modern look.

Method 8: Removing the Frame in Polar Plots

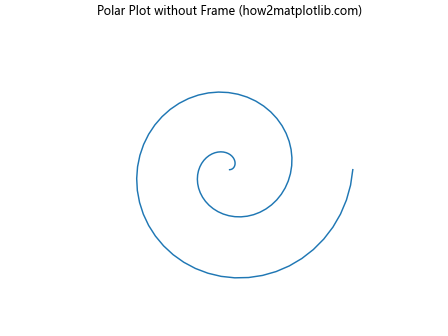
Polar plots are another type of visualization where removing the frame can enhance the overall appearance. Here’s an example of how to remove the frame from a Matplotlib figure in Python when working with polar plots:

import matplotlib.pyplot as plt
import numpy as np

# Create polar axes
fig, ax = plt.subplots(subplot_kw=dict(projection='polar'))

# Generate some sample data
r = np.linspace(0, 2, 100)
theta = 2 * np.pi * r

# Create the polar plot
ax.plot(theta, r)

# Remove the frame
ax.set_axis_off()

# Set the title
ax.set_title('Polar Plot without Frame (how2matplotlib.com)')

# Display the plot
plt.show()

Output:
How to Remove the Frame from a Matplotlib Figure in Python

In this example, we use ax.set_axis_off() to remove the frame from the polar plot, resulting in a clean and minimalist design.

Method 9: Removing the Frame in Subplots

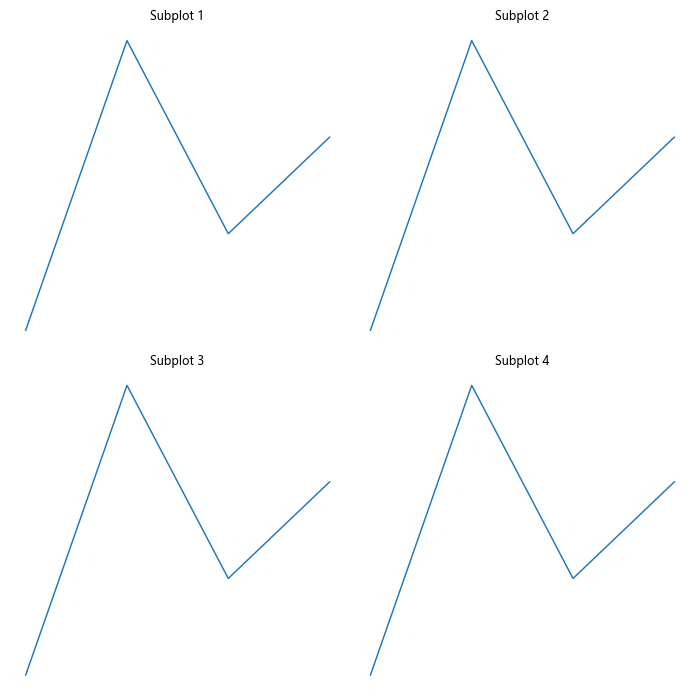
When working with multiple subplots, you may want to remove the frame from all or specific subplots. Here’s an example of how to remove the frame from a Matplotlib figure in Python when dealing with subplots:

import matplotlib.pyplot as plt

# Create a figure with 2x2 subplots
fig, axs = plt.subplots(2, 2, figsize=(10, 10))

# Flatten the axs array for easier iteration
axs = axs.flatten()

# Plot data and remove frames
for i, ax in enumerate(axs):
    ax.plot([1, 2, 3, 4], [1, 4, 2, 3], label=f'Data {i+1} from how2matplotlib.com')
    ax.set_title(f'Subplot {i+1}')
    ax.set_axis_off()

# Adjust the layout and display the plot
plt.tight_layout()
plt.show()

Output:
How to Remove the Frame from a Matplotlib Figure in Python

In this example, we create a 2×2 grid of subplots and remove the frame from each subplot using ax.set_axis_off().

Method 10: Removing the Frame in Histograms

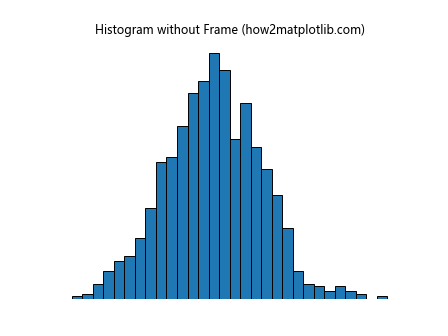
Histograms are another type of plot where removing the frame can create a cleaner look. Here’s an example of how to remove the frame from a Matplotlib figure in Python when creating a histogram:

import matplotlib.pyplot as plt
import numpy as np

# Generate some sample data
data = np.random.normal(0, 1, 1000)

# Create the histogram
plt.hist(data, bins=30, edgecolor='black')

# Remove the frame
plt.axis('off')

# Set the title
plt.title('Histogram without Frame (how2matplotlib.com)')

# Display the plot
plt.show()

Output:
How to Remove the Frame from a Matplotlib Figure in Python

In this example, we use plt.axis('off') to remove the frame from the histogram, creating a clean and focused visualization.

Best Practices for Removing Frames in Matplotlib

When removing the frame from a Matplotlib figure in Python, it’s important to keep a few best practices in mind:

  1. Consider the context: Not all plots benefit from frame removal. Use this technique when it enhances the visual appeal and clarity of your data.

  2. Maintain necessary information: If removing the frame also removes important information (like axis labels or ticks), consider using a method that allows you to keep these elements.

  3. Be consistent: If you’re creating multiple plots for a single project or presentation, maintain a consistent style across all visualizations.

  4. Test different methods: Experiment with various frame removal techniques to find the one that best suits your specific plot and data.

  5. Combine with other styling techniques: Frame removal can be combined with other Matplotlib styling options to create truly unique and professional-looking visualizations.

Advanced Techniques for Frame Removal and Plot Customization

Now that we’ve covered the basics of how to remove the frame from a Matplotlib figure in Python, let’s explore some advanced techniques that combine frame removal with other customization options.

Technique 1: Combining Frame Removal with Custom Colors and Fonts

In this example, we’ll remove the frame and customize the colors and fonts of our plot:

import matplotlib.pyplot as plt

# Set custom font
plt.rcParams['font.family'] = 'sans-serif'
plt.rcParams['font.sans-serif'] = ['Arial']

# Create a figure and axis objects
fig, ax = plt.subplots(figsize=(8, 6))

# Plot the data
ax.plot([1, 2, 3, 4], [1, 4, 2, 3], color='#FF5733', linewidth=2, label='Data from how2matplotlib.com')

# Customize the plot
ax.set_title('Custom Styled Plot without Frame', fontsize=16, fontweight='bold')
ax.set_xlabel('X-axis', fontsize=12)
ax.set_ylabel('Y-axis', fontsize=12)

# Remove the frame
ax.spines['top'].set_visible(False)
ax.spines['right'].set_visible(False)
ax.spines['bottom'].set_visible(False)
ax.spines['left'].set_visible(False)

# Remove ticks
ax.tick_params(left=False, bottom=False)

# Add a legend
ax.legend(frameon=False)

# Set background color
fig.patch.set_facecolor('#F0F0F0')

# Display the plot
plt.show()

Output:

How to Remove the Frame from a Matplotlib Figure in Python

In this example, we’ve removed the frame, customized colors and fonts, and added a background color to create a unique and visually appealing plot.

Technique 2: Creating a Minimalist Plot with Partial Frame

Sometimes, a completely frameless plot might not be ideal. Here’s an example of how to create a minimalist plot with a partial frame:

import matplotlib.pyplot as plt
import numpy as np

# Generate some sample data
x = np.linspace(0, 10, 100)
y1 = np.sin(x)
y2 = np.cos(x)

# Create a figure and axis objects
fig, ax = plt.subplots(figsize=(10, 6))

# Plot the data
ax.plot(x, y1, label='Sin (how2matplotlib.com)', color='#3498db')
ax.plot(x, y2, label='Cos (how2matplotlib.com)', color='#e74c3c')

# Customize the plot
ax.set_title('Minimalist Plot with Partial Frame', fontsize=16, fontweight='bold')
ax.set_xlabel('X-axis', fontsize=12)
ax.set_ylabel('Y-axis', fontsize=12)

# Remove top and right spines
ax.spines['top'].set_visible(False)
ax.spines['right'].set_visible(False)

# Style the bottom and left spines
ax.spines['bottom'].set_color('#333333')
ax.spines['left'].set_color('#333333')
ax.spines['bottom'].set_linewidth(0.5)
ax.spines['left'].set_linewidth(0.5)

# Customize ticks
ax.tick_params(axis='both', which='major', color='#333333', length=5, width=0.5)

# Add a legend
ax.legend(frameon=False)

# Set background color
fig.patch.set_facecolor('#f9f9f9')

# Display the plot
plt.show()

Output:

How to Remove the Frame from a Matplotlib Figure in Python

This example creates a minimalist plot with a partial frame, demonstrating how to balance frame removal with maintaining necessary visual elements.

Technique 3: Creating a Frameless Heatmap

Heatmaps are another type of visualization where removing the frame can enhance the overall appearance. Here’s an example of how to remove the frame from a Matplotlib figure in Python when creating a heatmap:

import matplotlib.pyplot as plt
import numpy as np

# Generate some sample data
data = np.random.rand(10, 10)

# Create a figure and axis objects
fig, ax = plt.subplots(figsize=(8, 6))

# Create the heatmap
im = ax.imshow(data, cmap='viridis')

# Remove the frame
ax.set_frame_on(False)

# Remove ticks
ax.set_xticks([])
ax.set_yticks([])

# Add a colorbar
cbar = plt.colorbar(im, ax=ax)
cbar.outline.set_visible(False)

# Set the title
ax.set_title('Frameless Heatmap (how2matplotlib.com)', fontsize=14)

# Display the plot
plt.show()

Output:

How to Remove the Frame from a Matplotlib Figure in Python

In this example, we use ax.set_frame_on(False) to remove the frame from the heatmap and also remove the ticks. We’ve also removed the outline of the colorbar for a cleaner look.

Considerations When Removing Frames in Matplotlib

While removing the frame from a Matplotlib figure in Python can create visually appealing plots, there are some important considerations to keep in mind:

  1. Data clarity: Ensure that removing the frame doesn’t compromise the clarity of your data. Sometimes, axis lines and ticks are necessary for accurate interpretation.

  2. Context: Consider the context in which your plot will be presented. In some scientific or technical contexts, a full frame might be expected or required.

  3. Accessibility: Make sure that removing the frame doesn’t make your plot less accessible to people with visual impairments. High contrast and clear labeling become even more important in frameless plots.

  4. Consistency: If you’re creating multiple plots for a single project or presentation, be consistent in your use of frames (or lack thereof).

  5. Overuse: While frameless plots can look modern and clean, overusing this technique can make your visualizations less effective. Use it judiciously.

Troubleshooting Common Issues When Removing Frames

When learning how to remove the frame from a Matplotlib figure in Python, you might encounter some common issues. Here are a few problems and their solutions:

  1. Issue: Removing the frame also removes axis labels and ticks.
    Solution: Use methods that allow you to selectively remove spines while keeping other elements, or manually add back the elements you want to keep.

  2. Issue: The plot looks incomplete or unfinished without a frame.
    Solution: Consider using a partial frame or adding other design elements to give the plot structure without a full frame.

  3. Issue: The plot area shrinks when removing the frame.
    Solution: Adjust the figure size or use plt.tight_layout() to optimize the use of figure space.

  4. Issue: Text elements (title, labels) are cut off after removing the frame.
    Solution: Adjust the plot margins using plt.subplots_adjust() or increase the figure size.

  5. Issue: The plot looks different in different output formats (e.g., on screen vs. saved as PNG).
    Solution: Be sure to test your plots in various formats and adjust as necessary. Sometimes, you may need to use different settings for different output formats.

Advanced Frame Removal Techniques

Let’s explore some more advanced techniques for removing frames and customizing plots in Matplotlib.

Technique 4: Creating a Frameless Plot with Grid Lines

Sometimes, you may want to remove the frame but keep grid lines for reference. Here’s how to achieve this:

import matplotlib.pyplot as plt
import numpy as np

# Generate some sample data
x = np.linspace(0, 10, 100)
y = np.sin(x) * np.exp(-0.1 * x)

# Create a figure and axis objects
fig, ax = plt.subplots(figsize=(10, 6))

# Plot the data
ax.plot(x, y, label='Data from how2matplotlib.com', color='#2ecc71', linewidth=2)

# Remove the frame
for spine in ax.spines.values():
    spine.set_visible(False)

# Add grid lines
ax.grid(color='#cccccc', linestyle='--', linewidth=0.5, alpha=0.7)

# Customize the plot
ax.set_title('Frameless Plot with Grid Lines', fontsize=16, fontweight='bold')
ax.set_xlabel('X-axis', fontsize=12)
ax.set_ylabel('Y-axis', fontsize=12)

# Add a legend
ax.legend(frameon=False)

# Display the plot
plt.show()

Output:

How to Remove the Frame from a Matplotlib Figure in Python

This example demonstrates how to create a clean, frameless plot while still providing reference grid lines for easier data interpretation.

Technique 5: Creating a Frameless Scatter Plot with Marginal Distributions

In this advanced example, we’ll create a frameless scatter plot with marginal distributions, combining several techniques we’ve learned:

import matplotlib.pyplot as plt
import numpy as np

# Generate some sample data
np.random.seed(42)
x = np.random.normal(0, 1, 1000)
y = x * 0.5 + np.random.normal(0, 0.5, 1000)

# Create a figure with a 2x2 grid
fig = plt.figure(figsize=(10, 10))
gs = fig.add_gridspec(2, 2, width_ratios=(7, 2), height_ratios=(2, 7),
                      left=0.1, right=0.9, bottom=0.1, top=0.9,
                      wspace=0.05, hspace=0.05)

# Create the scatter plot
ax = fig.add_subplot(gs[1, 0])
ax.scatter(x, y, alpha=0.5, color='#3498db')

# Remove the frame from the scatter plot
ax.set_frame_on(False)

# Create the x marginal distribution
ax_histx = fig.add_subplot(gs[0, 0], sharex=ax)
ax_histx.hist(x, bins=50, color='#3498db', alpha=0.5)
ax_histx.set_frame_on(False)
ax_histx.set_yticks([])

# Create the y marginal distribution
ax_histy = fig.add_subplot(gs[1, 1], sharey=ax)
ax_histy.hist(y, bins=50, orientation='horizontal', color='#3498db', alpha=0.5)
ax_histy.set_frame_on(False)
ax_histy.set_xticks([])

# Set labels and title
ax.set_xlabel('X-axis (how2matplotlib.com)', fontsize=12)
ax.set_ylabel('Y-axis (how2matplotlib.com)', fontsize=12)
fig.suptitle('Frameless Scatter Plot with Marginal Distributions', fontsize=16, fontweight='bold')

# Display the plot
plt.show()

Output:

How to Remove the Frame from a Matplotlib Figure in Python

This advanced example showcases how to create a complex, frameless visualization that combines a scatter plot with marginal distributions.

Best Practices for Creating Frameless Plots

As we conclude our exploration of how to remove the frame from a Matplotlib figure in Python, let’s summarize some best practices:

  1. Purpose: Always consider the purpose of your visualization. Remove the frame only if it enhances the clarity and impact of your data presentation.

  2. Consistency: If you’re creating multiple plots for a single project, maintain a consistent style across all visualizations.

  3. Readability: Ensure that removing the frame doesn’t compromise the readability of your plot. Keep necessary elements like axis labels and legends.

  4. White space: Use white space effectively in frameless plots to create a clean, uncluttered look.

  5. Color: Choose your colors carefully in frameless plots. Without the frame to provide structure, colors become even more important in guiding the viewer’s eye.

  6. Testing: Always test your frameless plots in different contexts (e.g., different background colors, various output formats) to ensure they look good in all situations.

  7. Accessibility: Consider accessibility when creating frameless plots. Use high contrast colors and clear labeling to ensure your plots are readable by all.

  8. Simplicity: Remember that the goal of removing the frame is often to simplify and focus the visualization. Don’t add unnecessary elements that could clutter the plot.

  9. Experimentation: Don’t be afraid to experiment with different techniques and combinations. The best approach may vary depending on your specific data and visualization goals.

  10. Feedback: Seek feedback on your frameless plots from colleagues or your target audience. Sometimes, an outside perspective can provide valuable insights.

Conclusion

Learning how to remove the frame from a Matplotlib figure in Python is a valuable skill that can significantly enhance the visual appeal and effectiveness of your data visualizations. Throughout this article, we’ve explored various methods and techniques for creating frameless plots, from simple line graphs to complex scatter plots with marginal distributions.

We’ve seen how removing the frame can create cleaner, more focused visualizations that draw attention to the data itself. We’ve also discussed the importance of balancing frame removal with maintaining necessary visual elements for data interpretation.

Like(0)