How to Reverse Axes in Matplotlib
How to Reverse Axes in Matplotlib is an essential skill for data visualization enthusiasts and professionals alike. Matplotlib, a powerful plotting library for Python, offers various ways to customize your plots, including the ability to reverse axes. This article will delve deep into the methods and techniques for reversing axes in Matplotlib, providing you with a thorough understanding of this important feature.
Understanding Axis Reversal in Matplotlib
Before we dive into the specifics of how to reverse axes in Matplotlib, it’s crucial to understand what axis reversal means and why it’s important. Reversing an axis in Matplotlib involves flipping the direction of the axis so that the values increase in the opposite direction. This can be particularly useful when dealing with certain types of data or when you want to present information in a specific way.
Let’s start with a simple example to illustrate how to reverse axes in Matplotlib:
import matplotlib.pyplot as plt
import numpy as np

# Generate sample data
x = np.linspace(0, 10, 100)
y = np.sin(x)

# Create the plot
plt.figure(figsize=(10, 6))
plt.plot(x, y, label='Sine wave')
plt.title('How to Reverse Axes in Matplotlib - Basic Example')
plt.xlabel('X-axis (how2matplotlib.com)')
plt.ylabel('Y-axis (how2matplotlib.com)')
plt.legend()

# Reverse the x-axis
plt.gca().invert_xaxis()

plt.show()
Output:
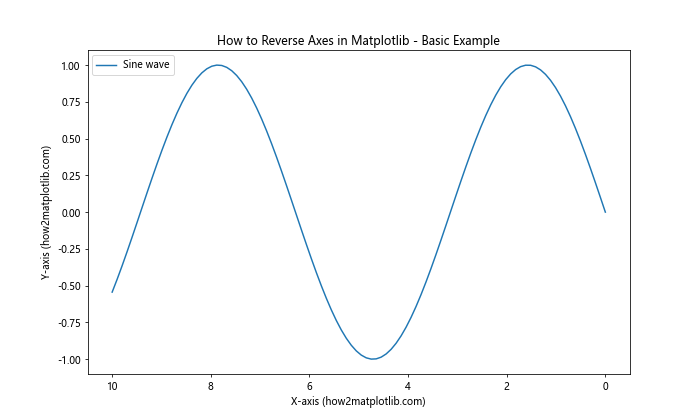
In this example, we’ve created a simple sine wave plot and reversed the x-axis using the invert_xaxis() method. This method is one of the simplest ways to reverse an axis in Matplotlib.
Reversing the X-axis in Matplotlib
Now that we’ve seen a basic example of how to reverse axes in Matplotlib, let’s explore more methods for reversing the x-axis specifically.
Using set_xlim()
Another way to reverse the x-axis is by using the set_xlim() method. This method allows you to set the limits of the x-axis, and by setting the higher value first, you can effectively reverse the axis.
import matplotlib.pyplot as plt
import numpy as np

# Generate sample data
x = np.linspace(0, 10, 100)
y = np.cos(x)

# Create the plot
plt.figure(figsize=(10, 6))
plt.plot(x, y, label='Cosine wave')
plt.title('How to Reverse Axes in Matplotlib - Using set_xlim()')
plt.xlabel('X-axis (how2matplotlib.com)')
plt.ylabel('Y-axis (how2matplotlib.com)')
plt.legend()

# Reverse the x-axis using set_xlim()
plt.xlim(10, 0)

plt.show()
Output:
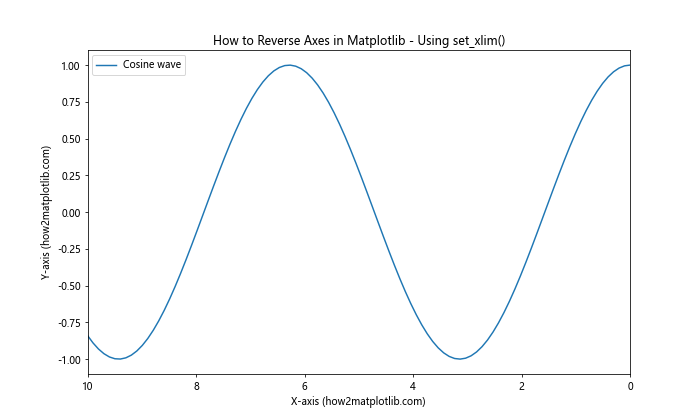
In this example, we’ve used plt.xlim(10, 0) to reverse the x-axis. By setting the maximum value (10) first and the minimum value (0) second, we’ve effectively flipped the direction of the axis.
Using ax.set_xlim()
If you’re working with Matplotlib’s object-oriented interface, you can use the ax.set_xlim() method to reverse the x-axis:
import matplotlib.pyplot as plt
import numpy as np

# Generate sample data
x = np.linspace(0, 10, 100)
y = np.tan(x)

# Create the plot
fig, ax = plt.subplots(figsize=(10, 6))
ax.plot(x, y, label='Tangent function')
ax.set_title('How to Reverse Axes in Matplotlib - Using ax.set_xlim()')
ax.set_xlabel('X-axis (how2matplotlib.com)')
ax.set_ylabel('Y-axis (how2matplotlib.com)')
ax.legend()

# Reverse the x-axis using ax.set_xlim()
ax.set_xlim(10, 0)

plt.show()
Output:
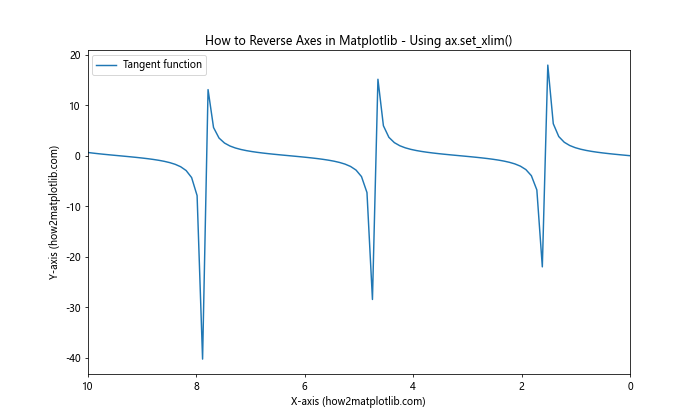
This method is particularly useful when you’re working with multiple subplots or when you need more fine-grained control over your plot elements.
Reversing the Y-axis in Matplotlib
Now that we’ve covered how to reverse the x-axis, let’s explore methods for reversing the y-axis in Matplotlib.
Using invert_yaxis()
Similar to the invert_xaxis() method we saw earlier, Matplotlib provides an invert_yaxis() method to easily reverse the y-axis:
import matplotlib.pyplot as plt
import numpy as np

# Generate sample data
x = np.linspace(0, 10, 100)
y = np.exp(x)

# Create the plot
plt.figure(figsize=(10, 6))
plt.plot(x, y, label='Exponential function')
plt.title('How to Reverse Axes in Matplotlib - Using invert_yaxis()')
plt.xlabel('X-axis (how2matplotlib.com)')
plt.ylabel('Y-axis (how2matplotlib.com)')
plt.legend()

# Reverse the y-axis
plt.gca().invert_yaxis()

plt.show()
Output:
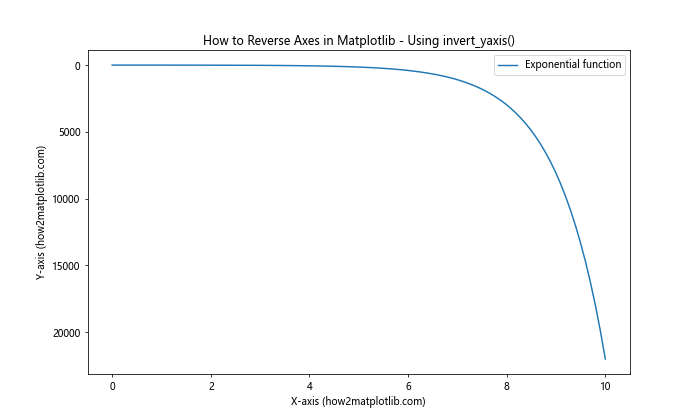
This method is straightforward and works well for simple plots where you need to quickly reverse the y-axis.
Using set_ylim()
Just like with the x-axis, you can use set_ylim() to reverse the y-axis by specifying the limits in reverse order:
import matplotlib.pyplot as plt
import numpy as np

# Generate sample data
x = np.linspace(0, 10, 100)
y = np.log(x + 1)

# Create the plot
plt.figure(figsize=(10, 6))
plt.plot(x, y, label='Logarithmic function')
plt.title('How to Reverse Axes in Matplotlib - Using set_ylim()')
plt.xlabel('X-axis (how2matplotlib.com)')
plt.ylabel('Y-axis (how2matplotlib.com)')
plt.legend()

# Reverse the y-axis using set_ylim()
plt.ylim(plt.ylim()[::-1])

plt.show()
Output:
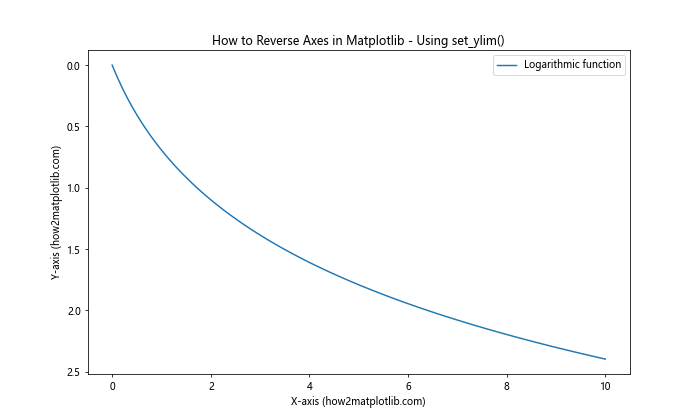
In this example, we’ve used plt.ylim(plt.ylim()[::-1]) to reverse the y-axis. This method first gets the current y-axis limits and then reverses them.
Reversing Both Axes Simultaneously
Sometimes, you may need to reverse both the x-axis and y-axis simultaneously. Let’s explore how to achieve this in Matplotlib.
Using invert_xaxis() and invert_yaxis()
The simplest way to reverse both axes is to use both invert_xaxis() and invert_yaxis() methods:
import matplotlib.pyplot as plt
import numpy as np

# Generate sample data
x = np.linspace(0, 10, 100)
y = x**2

# Create the plot
plt.figure(figsize=(10, 6))
plt.plot(x, y, label='Quadratic function')
plt.title('How to Reverse Axes in Matplotlib - Reversing Both Axes')
plt.xlabel('X-axis (how2matplotlib.com)')
plt.ylabel('Y-axis (how2matplotlib.com)')
plt.legend()

# Reverse both axes
plt.gca().invert_xaxis()
plt.gca().invert_yaxis()

plt.show()
Output:
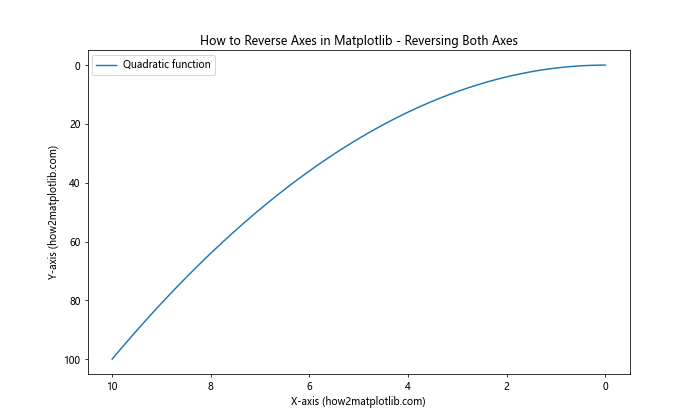
This method is straightforward and works well for most cases where you need to reverse both axes.
Using set_xlim() and set_ylim()
Alternatively, you can use set_xlim() and set_ylim() to reverse both axes:
import matplotlib.pyplot as plt
import numpy as np

# Generate sample data
x = np.linspace(0, 10, 100)
y = x**3

# Create the plot
plt.figure(figsize=(10, 6))
plt.plot(x, y, label='Cubic function')
plt.title('How to Reverse Axes in Matplotlib - Reversing Both Axes with set_xlim() and set_ylim()')
plt.xlabel('X-axis (how2matplotlib.com)')
plt.ylabel('Y-axis (how2matplotlib.com)')
plt.legend()

# Reverse both axes using set_xlim() and set_ylim()
plt.xlim(plt.xlim()[::-1])
plt.ylim(plt.ylim()[::-1])

plt.show()
Output:
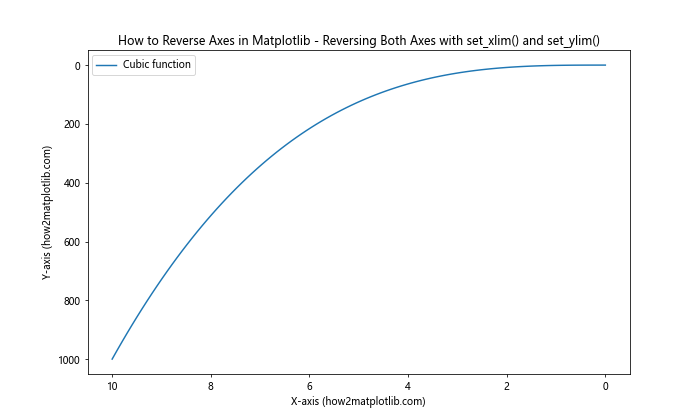
This method gives you more control over the exact limits of your axes while reversing them.
Reversing Axes in Different Plot Types
Now that we’ve covered the basics of how to reverse axes in Matplotlib, let’s explore how to apply these techniques to different types of plots.
Reversing Axes in Bar Plots
Bar plots are commonly used to compare quantities across different categories. Here’s how you can reverse axes in a bar plot:
import matplotlib.pyplot as plt
import numpy as np

# Generate sample data
categories = ['A', 'B', 'C', 'D', 'E']
values = [23, 45, 56, 78, 32]

# Create the bar plot
plt.figure(figsize=(10, 6))
plt.bar(categories, values)
plt.title('How to Reverse Axes in Matplotlib - Bar Plot')
plt.xlabel('Categories (how2matplotlib.com)')
plt.ylabel('Values (how2matplotlib.com)')

# Reverse the y-axis
plt.gca().invert_yaxis()

plt.show()
Output:
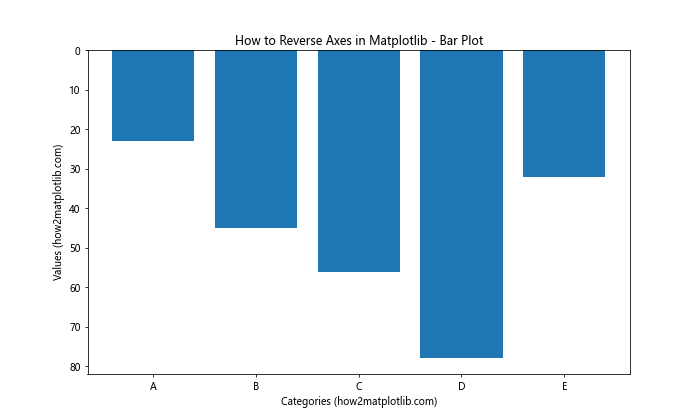
In this example, we’ve created a simple bar plot and reversed the y-axis. This can be useful when you want to emphasize lower values or when working with certain types of data where a reversed y-axis makes more sense.
Reversing Axes in Scatter Plots
Scatter plots are excellent for showing the relationship between two variables. Here’s how you can reverse axes in a scatter plot:
import matplotlib.pyplot as plt
import numpy as np

# Generate sample data
x = np.random.rand(50)
y = np.random.rand(50)

# Create the scatter plot
plt.figure(figsize=(10, 6))
plt.scatter(x, y)
plt.title('How to Reverse Axes in Matplotlib - Scatter Plot')
plt.xlabel('X-axis (how2matplotlib.com)')
plt.ylabel('Y-axis (how2matplotlib.com)')

# Reverse both axes
plt.gca().invert_xaxis()
plt.gca().invert_yaxis()

plt.show()
Output:
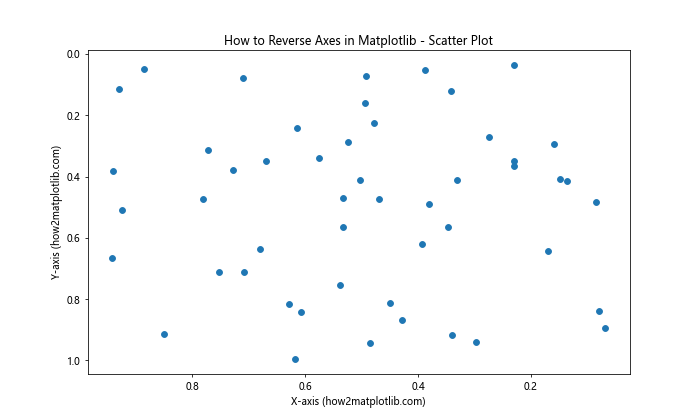
In this scatter plot example, we’ve reversed both the x-axis and y-axis. This can be useful when you want to change the perspective of your data or when working with coordinate systems that are naturally inverted.
Reversing Axes in Line Plots with Multiple Lines
When working with line plots that have multiple lines, reversing axes can help highlight certain trends or relationships. Here’s an example:
import matplotlib.pyplot as plt
import numpy as np

# Generate sample data
x = np.linspace(0, 10, 100)
y1 = np.sin(x)
y2 = np.cos(x)

# Create the line plot
plt.figure(figsize=(10, 6))
plt.plot(x, y1, label='Sine')
plt.plot(x, y2, label='Cosine')
plt.title('How to Reverse Axes in Matplotlib - Multiple Line Plot')
plt.xlabel('X-axis (how2matplotlib.com)')
plt.ylabel('Y-axis (how2matplotlib.com)')
plt.legend()

# Reverse the x-axis
plt.gca().invert_xaxis()

plt.show()
Output:
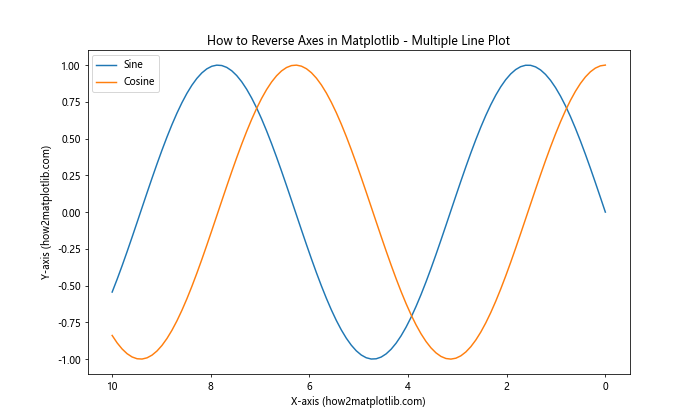
In this example, we’ve plotted sine and cosine functions and reversed the x-axis. This can be useful when you want to emphasize the relationship between multiple lines from a different perspective.
Advanced Techniques for Reversing Axes
Now that we’ve covered the basics of how to reverse axes in Matplotlib, let’s explore some more advanced techniques and scenarios.
Reversing Logarithmic Axes
When working with logarithmic scales, reversing axes requires a slightly different approach. Here’s how you can reverse a logarithmic axis:
import matplotlib.pyplot as plt
import numpy as np

# Generate sample data
x = np.logspace(0, 3, 100)
y = np.log10(x)

# Create the plot
fig, ax = plt.subplots(figsize=(10, 6))
ax.semilogx(x, y)
ax.set_title('How to Reverse Axes in Matplotlib - Logarithmic Axis')
ax.set_xlabel('X-axis (log scale) (how2matplotlib.com)')
ax.set_ylabel('Y-axis (how2matplotlib.com)')

# Reverse the logarithmic x-axis
ax.set_xlim(ax.get_xlim()[::-1])

plt.show()
Output:
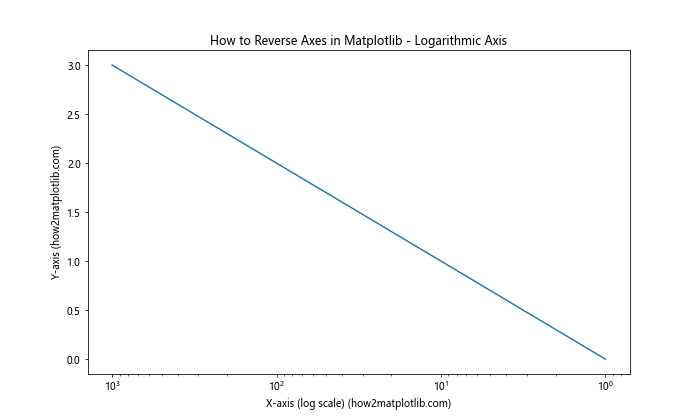
In this example, we’ve created a plot with a logarithmic x-axis and then reversed it. This can be particularly useful when working with data that spans multiple orders of magnitude.
Reversing Axes in 3D Plots
Matplotlib also supports 3D plotting, and you can reverse axes in these plots as well. Here’s an example:
import matplotlib.pyplot as plt
import numpy as np
from mpl_toolkits.mplot3d import Axes3D

# Generate sample data
x = np.linspace(-5, 5, 100)
y = np.linspace(-5, 5, 100)
X, Y = np.meshgrid(x, y)
Z = np.sin(np.sqrt(X**2 + Y**2))

# Create the 3D plot
fig = plt.figure(figsize=(10, 6))
ax = fig.add_subplot(111, projection='3d')
surf = ax.plot_surface(X, Y, Z, cmap='viridis')
ax.set_title('How to Reverse Axes in Matplotlib - 3D Plot')
ax.set_xlabel('X-axis (how2matplotlib.com)')
ax.set_ylabel('Y-axis (how2matplotlib.com)')
ax.set_zlabel('Z-axis (how2matplotlib.com)')

# Reverse the z-axis
ax.set_zlim(ax.get_zlim()[::-1])

plt.show()
Output:
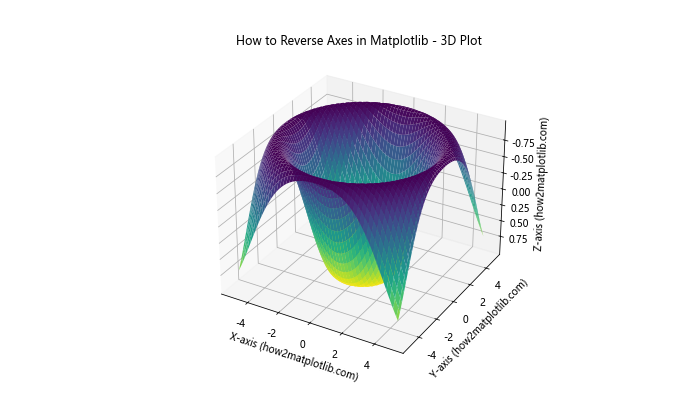
In this 3D plot example, we’ve reversed the z-axis. This can be useful when you want to view your 3D data from a different perspective or when working with certain types of 3D data where a reversed axis makes more sense.
Reversing Axes in Subplots
When working with multiple subplots, you might want to reverse axes in some plots but not others. Here’s how you can achieve this:
import matplotlib.pyplot as plt
import numpy as np

# Generate sample data
x = np.linspace(0, 10, 100)
y1 = np.sin(x)
y2 = np.cos(x)

# Create the subplots
fig, (ax1, ax2) = plt.subplots(1, 2, figsize=(15, 6))

# First subplot
ax1.plot(x, y1)
ax1.set_title('How to Reverse Axes in Matplotlib - Subplot 1')
ax1.set_xlabel('X-axis (how2matplotlib.com)')
ax1.set_ylabel('Y-axis (how2matplotlib.com)')

# Second subplot with reversed axes
ax2.plot(x, y2)
ax2.set_title('How to Reverse Axes in Matplotlib - Subplot 2 (Reversed)')
ax2.set_xlabel('X-axis (how2matplotlib.com)')
ax2.set_ylabel('Y-axis (how2matplotlib.com)')
ax2.invert_xaxis()
ax2.invert_yaxis()

plt.tight_layout()
plt.show()
Output:
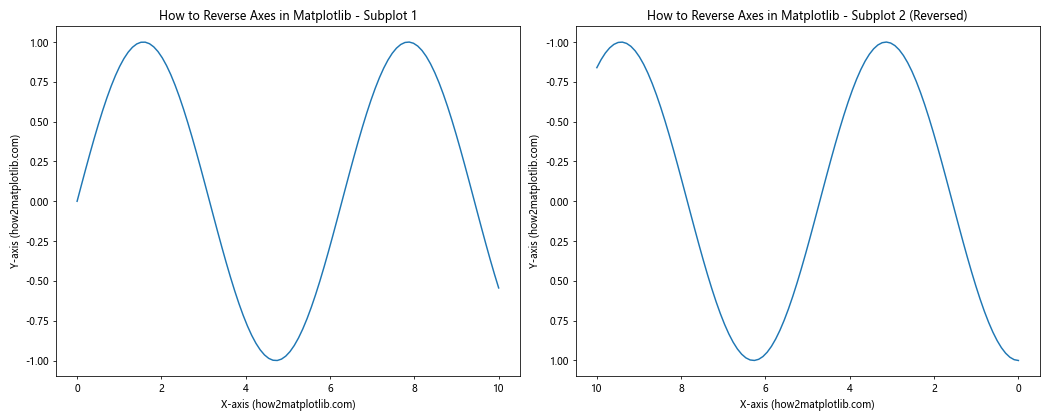
In this example, we’ve created two subplots side by side. The first subplot has normal axes, while the second subplot has both axes reversed. This can be useful when you want to compare different views of your data side by side.
Customizing Reversed Axes
When you reverse axes in Matplotlib, you might want to customize the appearance of the reversed axes. Let’s explore some ways to do this.
Customizing Tick Labels on Reversed Axes
When you reverse an axis, you might want to customize the tick labels to bettersuit your data. Here’s an example of how to customize tick labels on a reversed axis:
import matplotlib.pyplot as plt
import numpy as np

# Generate sample data
x = np.linspace(0, 10, 100)
y = np.exp(-x)

# Create the plot
fig, ax = plt.subplots(figsize=(10, 6))
ax.plot(x, y)
ax.set_title('How to Reverse Axes in Matplotlib - Customized Tick Labels')
ax.set_xlabel('X-axis (how2matplotlib.com)')
ax.set_ylabel('Y-axis (how2matplotlib.com)')

# Reverse the y-axis
ax.invert_yaxis()

# Customize tick labels
ax.set_yticks([0, 0.2, 0.4, 0.6, 0.8, 1.0])
ax.set_yticklabels(['Max', '80%', '60%', '40%', '20%', 'Min'])

plt.show()
Output:
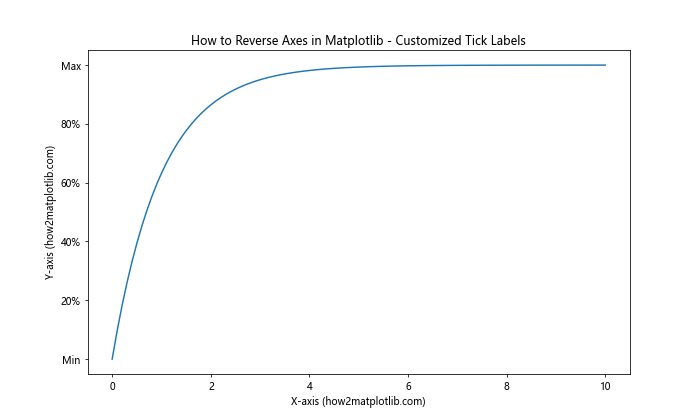
In this example, we’ve reversed the y-axis and customized the tick labels to show percentages instead of the actual values. This can be useful when you want to present your data in a more intuitive or domain-specific way.
Adding a Secondary Axis
Sometimes, you might want to add a secondary axis when reversing an axis. This can be particularly useful when you want to show two different scales for your data. Here’s how you can do this:
import matplotlib.pyplot as plt
import numpy as np

# Generate sample data
x = np.linspace(0, 10, 100)
y = np.sin(x)

# Create the plot
fig, ax1 = plt.subplots(figsize=(10, 6))

# Primary axis
ax1.plot(x, y, 'b-')
ax1.set_xlabel('X-axis (how2matplotlib.com)')
ax1.set_ylabel('Primary Y-axis (how2matplotlib.com)', color='b')
ax1.tick_params(axis='y', labelcolor='b')

# Secondary axis
ax2 = ax1.twinx()
ax2.plot(x, y**2, 'r-')
ax2.set_ylabel('Secondary Y-axis (how2matplotlib.com)', color='r')
ax2.tick_params(axis='y', labelcolor='r')

# Reverse both y-axes
ax1.invert_yaxis()
ax2.invert_yaxis()

plt.title('How to Reverse Axes in Matplotlib - Secondary Axis')
plt.show()
Output:
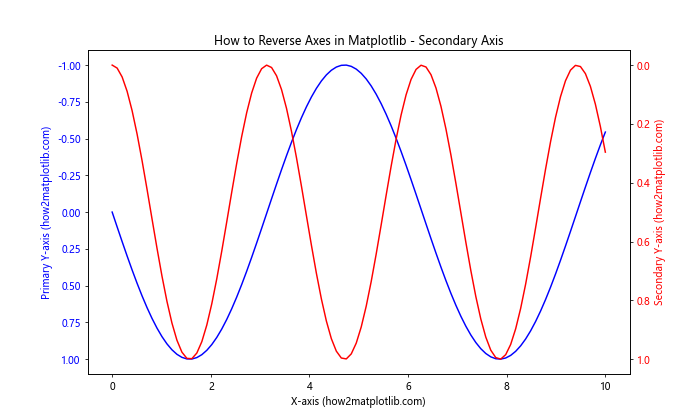
In this example, we’ve created a plot with two y-axes, both of which are reversed. This can be useful when you want to show two related but different scales on the same plot.
Common Pitfalls and How to Avoid Them
When learning how to reverse axes in Matplotlib, there are some common pitfalls that you might encounter. Let’s discuss these and how to avoid them.
Forgetting to Reverse Both Axes in Certain Plot Types
For some types of plots, like heatmaps or images, you might need to reverse both axes to get the desired effect. Here’s an example of how to correctly reverse axes in a heatmap:
import matplotlib.pyplot as plt
import numpy as np

# Generate sample data
data = np.random.rand(10, 10)

# Create the heatmap
fig, ax = plt.subplots(figsize=(10, 8))
im = ax.imshow(data, cmap='viridis')
ax.set_title('How to Reverse Axes in Matplotlib - Heatmap')
ax.set_xlabel('X-axis (how2matplotlib.com)')
ax.set_ylabel('Y-axis (how2matplotlib.com)')

# Add colorbar
cbar = plt.colorbar(im)
cbar.set_label('Values (how2matplotlib.com)')

# Reverse both axes
ax.invert_yaxis()
ax.invert_xaxis()

plt.show()
Output:
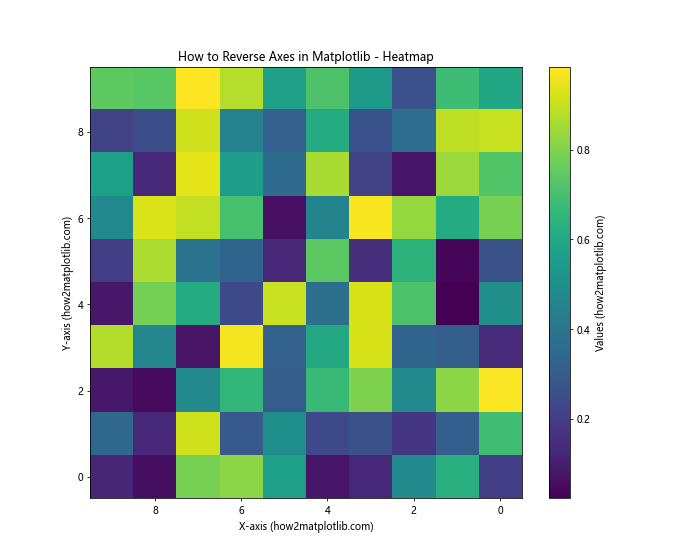
In this example, we’ve reversed both the x-axis and y-axis for the heatmap. This ensures that the orientation of the heatmap is correct after reversal.
Inconsistent Axis Reversal in Multiple Plots
When creating multiple plots or subplots, it’s important to be consistent with axis reversal. Inconsistent axis reversal can lead to confusion when interpreting the data. Here’s an example of how to maintain consistency:
import matplotlib.pyplot as plt
import numpy as np

# Generate sample data
x = np.linspace(0, 10, 100)
y1 = np.sin(x)
y2 = np.cos(x)

# Create subplots
fig, (ax1, ax2) = plt.subplots(2, 1, figsize=(10, 10))

# First subplot
ax1.plot(x, y1)
ax1.set_title('How to Reverse Axes in Matplotlib - Subplot 1')
ax1.set_xlabel('X-axis (how2matplotlib.com)')
ax1.set_ylabel('Y-axis (how2matplotlib.com)')
ax1.invert_xaxis()

# Second subplot
ax2.plot(x, y2)
ax2.set_title('How to Reverse Axes in Matplotlib - Subplot 2')
ax2.set_xlabel('X-axis (how2matplotlib.com)')
ax2.set_ylabel('Y-axis (how2matplotlib.com)')
ax2.invert_xaxis()

plt.tight_layout()
plt.show()
Output:
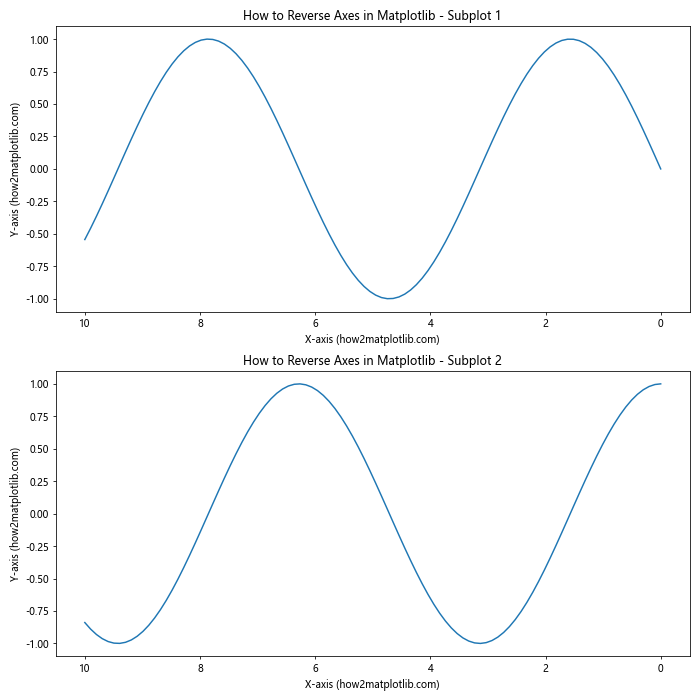
In this example, we’ve consistently reversed the x-axis in both subplots, maintaining a uniform presentation of the data.
Best Practices for Reversing Axes
When learning how to reverse axes in Matplotlib, it’s important to follow some best practices to ensure your plots are clear and effective.
Always Provide Clear Labels
When you reverse an axis, it’s crucial to provide clear labels that indicate the direction of the axis. Here’s an example:
import matplotlib.pyplot as plt
import numpy as np

# Generate sample data
x = np.linspace(0, 10, 100)
y = np.exp(-x)

# Create the plot
fig, ax = plt.subplots(figsize=(10, 6))
ax.plot(x, y)
ax.set_title('How to Reverse Axes in Matplotlib - Clear Labels')
ax.set_xlabel('X-axis (Decreasing →) (how2matplotlib.com)')
ax.set_ylabel('Y-axis (Increasing ↑) (how2matplotlib.com)')

# Reverse the x-axis
ax.invert_xaxis()

plt.show()
Output:
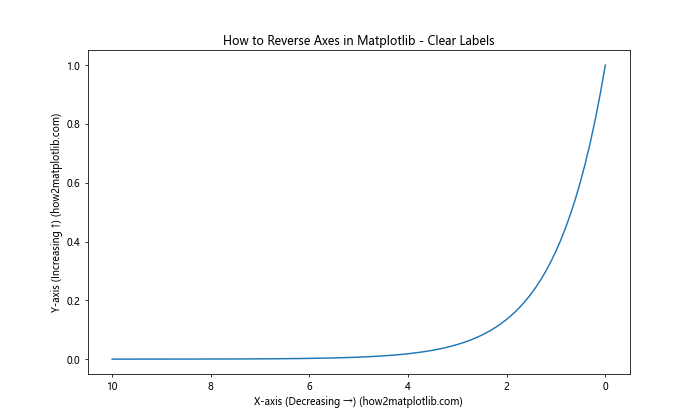
In this example, we’ve added directional indicators to the axis labels to make it clear that the x-axis is decreasing from left to right.
Use Appropriate Color Scales
When working with color-based plots like heatmaps, it’s important to choose an appropriate color scale when reversing axes. Here’s an example:
import matplotlib.pyplot as plt
import numpy as np

# Generate sample data
data = np.random.rand(10, 10)

# Create the heatmap
fig, ax = plt.subplots(figsize=(10, 8))
im = ax.imshow(data, cmap='coolwarm')
ax.set_title('How to Reverse Axes in Matplotlib - Appropriate Color Scale')
ax.set_xlabel('X-axis (how2matplotlib.com)')
ax.set_ylabel('Y-axis (how2matplotlib.com)')

# Add colorbar
cbar = plt.colorbar(im)
cbar.set_label('Values (how2matplotlib.com)')

# Reverse both axes
ax.invert_yaxis()
ax.invert_xaxis()

plt.show()
Output:
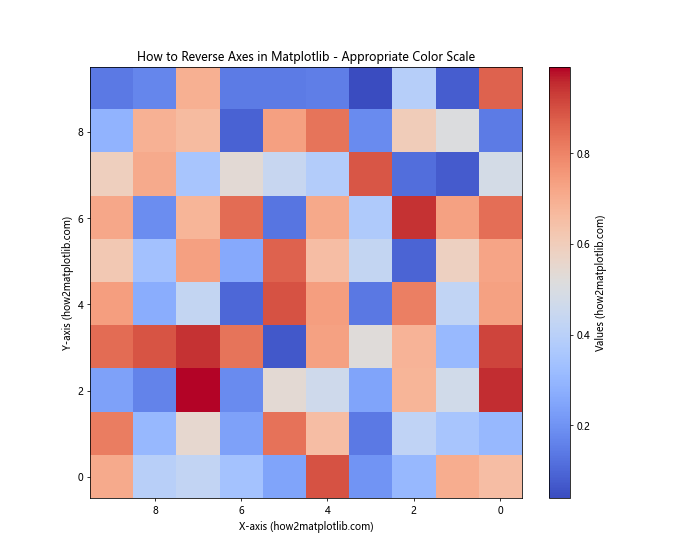
In this example, we’ve used the ‘coolwarm’ colormap, which works well with reversed axes as it has a natural progression from cool to warm colors.
Advanced Applications of Axis Reversal
Now that we’ve covered the basics and best practices of how to reverse axes in Matplotlib, let’s explore some advanced applications of this technique.
Creating Mirror Plots
Mirror plots can be useful for comparing two related datasets. Here’s how you can create a mirror plot using axis reversal:
import matplotlib.pyplot as plt
import numpy as np

# Generate sample data
x = np.linspace(0, 10, 100)
y1 = np.sin(x)
y2 = np.cos(x)

# Create the plot
fig, (ax1, ax2) = plt.subplots(1, 2, figsize=(15, 6), sharey=True)

# Left subplot
ax1.plot(y1, x)
ax1.set_title('How to Reverse Axes in Matplotlib - Mirror Plot (Left)')
ax1.set_xlabel('Values (how2matplotlib.com)')
ax1.set_ylabel('X-axis (how2matplotlib.com)')
ax1.invert_xaxis()

# Right subplot
ax2.plot(y2, x)
ax2.set_title('How to Reverse Axes in Matplotlib - Mirror Plot (Right)')
ax2.set_xlabel('Values (how2matplotlib.com)')
ax2.yaxis.tick_right()
ax2.yaxis.set_label_position("right")

plt.tight_layout()
plt.show()
Output:
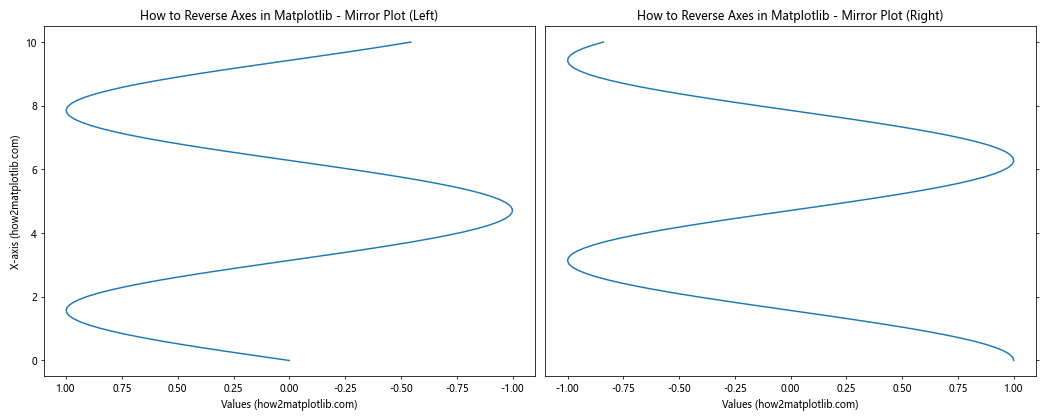
In this example, we’ve created a mirror plot by reversing the x-axis of the left subplot and placing the y-axis of the right subplot on the right side.
Creating Radial Plots
Radial plots can be created by reversing the y-axis in a polar plot. Here’s an example:
import matplotlib.pyplot as plt
import numpy as np

# Generate sample data
theta = np.linspace(0, 2*np.pi, 100)
r = np.abs(np.sin(2*theta) * np.cos(2*theta))

# Create the polar plot
fig, ax = plt.subplots(figsize=(10, 10), subplot_kw=dict(projection='polar'))
ax.plot(theta, r)
ax.set_title('How to Reverse Axes in Matplotlib - Radial Plot')
ax.set_xlabel('Angle (how2matplotlib.com)')
ax.set_ylabel('Radius (how2matplotlib.com)')

# Reverse the radial axis
ax.set_ylim(ax.get_ylim()[::-1])

plt.show()
Output:
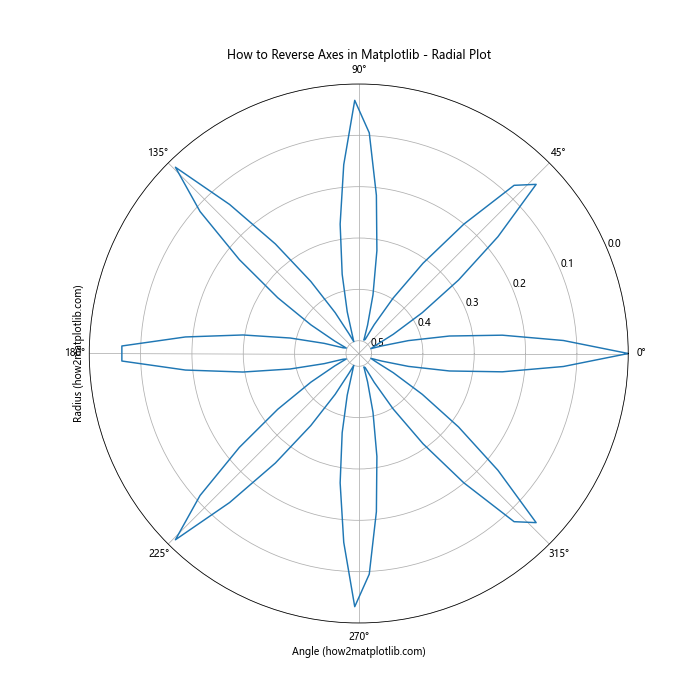
In this example, we’ve created a radial plot by reversing the radial axis (y-axis) in a polar plot.
Conclusion
Learning how to reverse axes in Matplotlib is a valuable skill that can greatly enhance your data visualization capabilities. Throughout this article, we’ve explored various methods and techniques for reversing axes, from simple line plots to more complex 3D and radial plots. We’ve also discussed best practices, common pitfalls, and advanced applications of axis reversal.
Remember, the key to effective data visualization is not just knowing how to create plots, but understanding when and why to apply certain techniques. Reversing axes can provide new perspectives on your data, highlight important trends, and make your visualizations more intuitive for specific audiences or domains.