How to Make a Square Plot With Equal Axes in Matplotlib
How to Make a Square Plot With Equal Axes in Matplotlib is an essential skill for data visualization enthusiasts and professionals alike. Matplotlib, a powerful plotting library in Python, offers various ways to create square plots with equal axes. This article will delve deep into the techniques, methods, and best practices for achieving this goal. We’ll explore different approaches, provide numerous examples, and offer insights to help you master the art of creating square plots with equal axes in Matplotlib.
Understanding the Importance of Square Plots with Equal Axes
Before we dive into the specifics of how to make a square plot with equal axes in Matplotlib, it’s crucial to understand why this type of plot is important. Square plots with equal axes are particularly useful when:
- Comparing two variables on the same scale
- Visualizing symmetrical data
- Creating scatter plots where the x and y axes represent the same units
- Generating heatmaps or image plots
- Ensuring that circular or spherical data appears undistorted
By learning how to make a square plot with equal axes in Matplotlib, you’ll be able to create more accurate and visually appealing representations of your data.
Basic Techniques for Creating Square Plots with Equal Axes
Let’s start with some fundamental techniques for how to make a square plot with equal axes in Matplotlib. These methods will serve as a foundation for more advanced approaches we’ll explore later.
Using plt.axis(‘equal’)
One of the simplest ways to create a square plot with equal axes in Matplotlib is by using the plt.axis('equal') command. This method ensures that the aspect ratio of the plot is 1:1, resulting in a square plot with equal axes.
Here’s a basic example:
import matplotlib.pyplot as plt
import numpy as np

# Generate some sample data
x = np.linspace(0, 10, 100)
y = np.sin(x)

# Create the plot
plt.figure(figsize=(8, 8))
plt.plot(x, y, label='how2matplotlib.com')
plt.title('How to Make a Square Plot With Equal Axes in Matplotlib')
plt.xlabel('X-axis')
plt.ylabel('Y-axis')
plt.legend()

# Set equal axes
plt.axis('equal')

plt.show()
Output:
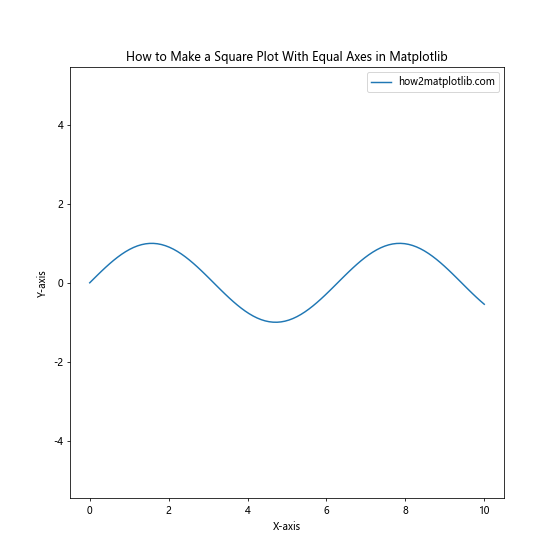
In this example, we create a simple sine wave plot and use plt.axis('equal') to ensure that the plot is square with equal axes. The figsize=(8, 8) parameter in plt.figure() also helps maintain the square shape of the overall figure.
Using plt.gca().set_aspect(‘equal’)
Another method to achieve a square plot with equal axes in Matplotlib is by using the set_aspect() function on the current axes. This approach offers more flexibility and control over the aspect ratio.
Here’s an example demonstrating how to make a square plot with equal axes using this technique:
import matplotlib.pyplot as plt
import numpy as np

# Generate some sample data
x = np.linspace(0, 10, 100)
y = np.cos(x)

# Create the plot
fig, ax = plt.subplots(figsize=(8, 8))
ax.plot(x, y, label='how2matplotlib.com')
ax.set_title('How to Make a Square Plot With Equal Axes in Matplotlib')
ax.set_xlabel('X-axis')
ax.set_ylabel('Y-axis')
ax.legend()

# Set equal axes
ax.set_aspect('equal')

plt.show()
Output:
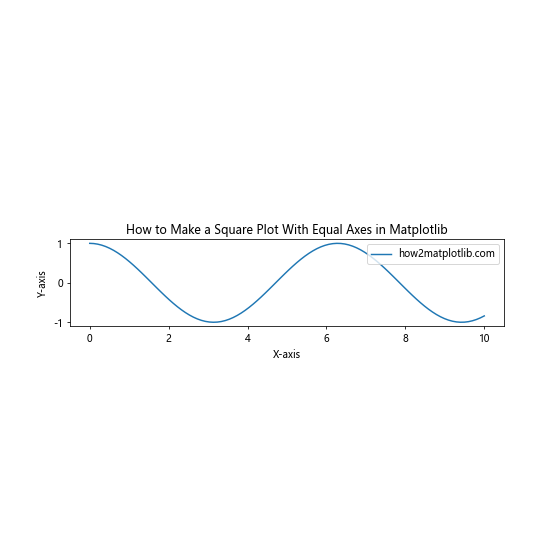
In this example, we use the set_aspect('equal') method on the axes object to create a square plot with equal axes. This approach gives you more control over individual subplots when working with multiple plots.
Advanced Techniques for Square Plots with Equal Axes
Now that we’ve covered the basics of how to make a square plot with equal axes in Matplotlib, let’s explore some more advanced techniques and scenarios.
Creating Square Scatter Plots
Scatter plots are a common use case for square plots with equal axes. Here’s an example of how to create a square scatter plot:
import matplotlib.pyplot as plt
import numpy as np

# Generate random data
np.random.seed(42)
x = np.random.rand(50)
y = np.random.rand(50)

# Create the scatter plot
fig, ax = plt.subplots(figsize=(8, 8))
ax.scatter(x, y, s=100, alpha=0.5, label='how2matplotlib.com')
ax.set_title('How to Make a Square Plot With Equal Axes in Matplotlib')
ax.set_xlabel('X-axis')
ax.set_ylabel('Y-axis')
ax.legend()

# Set equal axes
ax.set_aspect('equal')

# Set limits to ensure square plot
ax.set_xlim(0, 1)
ax.set_ylim(0, 1)

plt.show()
Output:
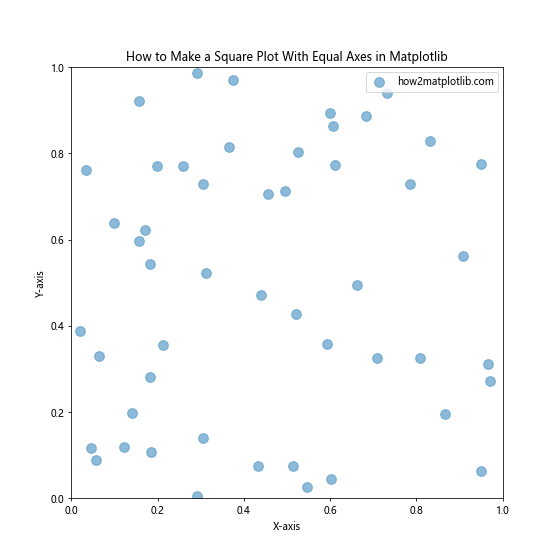
In this example, we create a scatter plot with random data points. We use ax.set_aspect('equal') to ensure equal axes, and we set the x and y limits to 0 and 1 to create a perfect square plot.
Square Plots with Unequal Data Ranges
Sometimes, you may need to create a square plot with equal axes even when your data ranges are different. Here’s how to achieve this:
import matplotlib.pyplot as plt
import numpy as np

# Generate data with different ranges
x = np.linspace(0, 10, 100)
y = np.linspace(0, 5, 100)

# Create the plot
fig, ax = plt.subplots(figsize=(8, 8))
ax.plot(x, y, label='how2matplotlib.com')
ax.set_title('How to Make a Square Plot With Equal Axes in Matplotlib')
ax.set_xlabel('X-axis')
ax.set_ylabel('Y-axis')
ax.legend()

# Set equal axes
ax.set_aspect('equal')

# Adjust limits to create a square plot
x_min, x_max = ax.get_xlim()
y_min, y_max = ax.get_ylim()
ax.set_xlim(min(x_min, y_min), max(x_max, y_max))
ax.set_ylim(min(x_min, y_min), max(x_max, y_max))

plt.show()
Output:
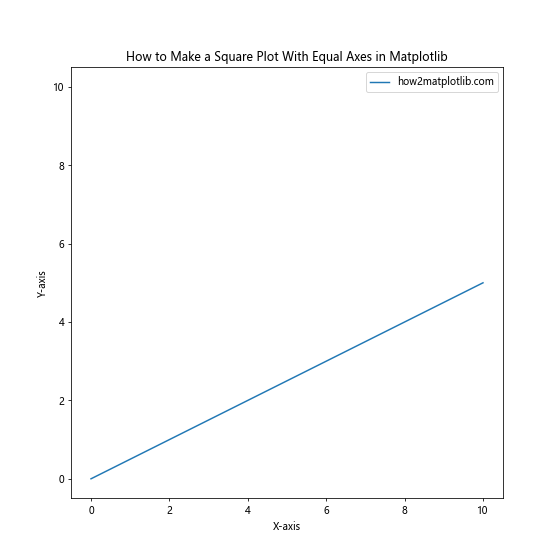
In this example, we have data with different ranges on the x and y axes. We use ax.set_aspect('equal') to ensure equal axes, and then we adjust the limits to create a square plot that encompasses all the data.
Creating Square Subplots with Equal Axes
When working with multiple subplots, you may want to ensure that each subplot is square with equal axes. Here’s how to achieve this:
import matplotlib.pyplot as plt
import numpy as np

# Generate sample data
x = np.linspace(0, 10, 100)
y1 = np.sin(x)
y2 = np.cos(x)
y3 = np.tan(x)
y4 = x**2

# Create subplots
fig, axs = plt.subplots(2, 2, figsize=(12, 12))
fig.suptitle('How to Make a Square Plot With Equal Axes in Matplotlib')

# Plot data in each subplot
axs[0, 0].plot(x, y1, label='how2matplotlib.com')
axs[0, 1].plot(x, y2, label='how2matplotlib.com')
axs[1, 0].plot(x, y3, label='how2matplotlib.com')
axs[1, 1].plot(x, y4, label='how2matplotlib.com')

# Set titles and labels for each subplot
for i in range(2):
    for j in range(2):
        axs[i, j].set_title(f'Subplot {i+1},{j+1}')
        axs[i, j].set_xlabel('X-axis')
        axs[i, j].set_ylabel('Y-axis')
        axs[i, j].legend()
        axs[i, j].set_aspect('equal')

plt.tight_layout()
plt.show()
Output:
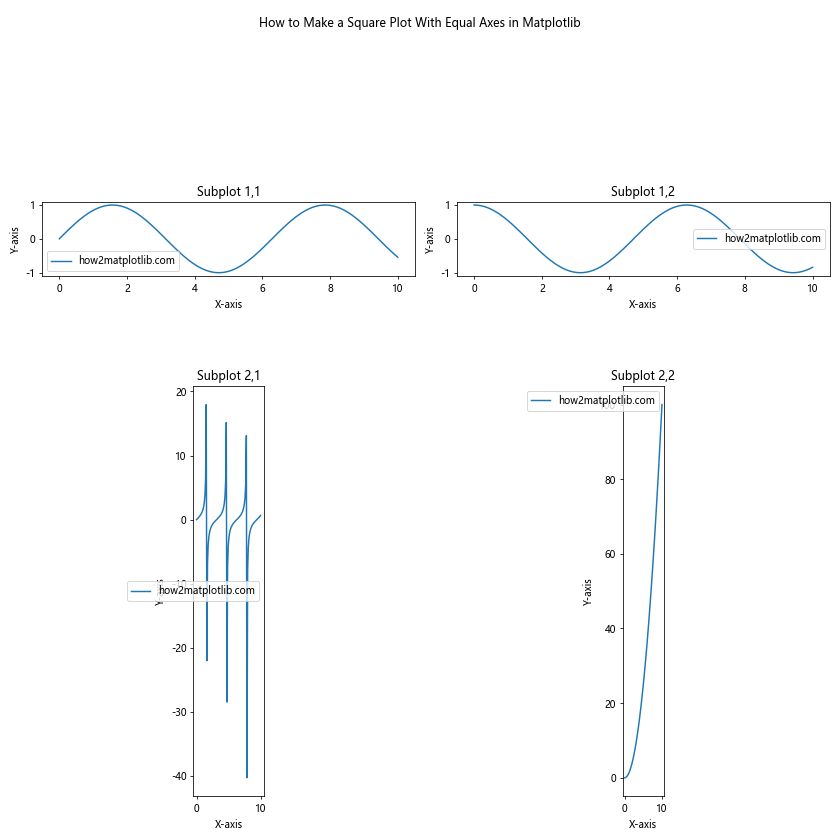
In this example, we create a 2×2 grid of subplots, each containing a different function. We use axs[i, j].set_aspect('equal') to ensure that each subplot has equal axes and is square.
Square Plots with Circular Data
When working with circular data, it’s crucial to have square plots with equal axes to avoid distortion. Here’s an example of how to create a square plot with a circle:
import matplotlib.pyplot as plt
import numpy as np

# Generate data for a circle
theta = np.linspace(0, 2*np.pi, 100)
r = 1
x = r * np.cos(theta)
y = r * np.sin(theta)

# Create the plot
fig, ax = plt.subplots(figsize=(8, 8))
ax.plot(x, y, label='how2matplotlib.com')
ax.set_title('How to Make a Square Plot With Equal Axes in Matplotlib')
ax.set_xlabel('X-axis')
ax.set_ylabel('Y-axis')
ax.legend()

# Set equal axes
ax.set_aspect('equal')

# Set limits to ensure square plot
ax.set_xlim(-1.5, 1.5)
ax.set_ylim(-1.5, 1.5)

plt.show()
Output:
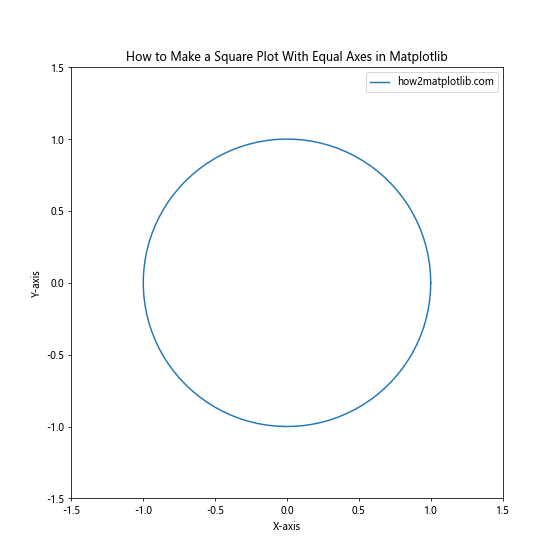
In this example, we plot a circle using parametric equations. By setting the aspect ratio to ‘equal’ and adjusting the limits, we ensure that the circle appears perfectly round in a square plot.
Square Heatmaps with Equal Axes
Heatmaps are another type of visualization that often benefit from square plots with equal axes. Here’s how to create a square heatmap:
import matplotlib.pyplot as plt
import numpy as np

# Generate sample data
data = np.random.rand(10, 10)

# Create the heatmap
fig, ax = plt.subplots(figsize=(8, 8))
im = ax.imshow(data, cmap='viridis')
ax.set_title('How to Make a Square Plot With Equal Axes in Matplotlib')
ax.set_xlabel('X-axis')
ax.set_ylabel('Y-axis')

# Add colorbar
cbar = fig.colorbar(im)
cbar.set_label('how2matplotlib.com')

# Set equal axes
ax.set_aspect('equal')

plt.show()
Output:
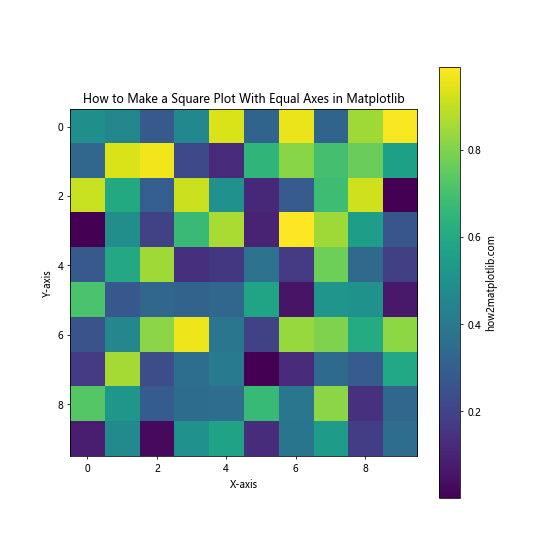
In this example, we create a heatmap using random data. The imshow() function automatically creates a square plot, but we still use ax.set_aspect('equal') to ensure equal axes.
Square Plots with Polar Coordinates
When working with polar coordinates, it’s important to maintain a square plot with equal axes to accurately represent the data. Here’s how to create a square polar plot:
import matplotlib.pyplot as plt
import numpy as np

# Generate data for a spiral
theta = np.linspace(0, 4*np.pi, 100)
r = theta

# Create the polar plot
fig, ax = plt.subplots(figsize=(8, 8), subplot_kw=dict(projection='polar'))
ax.plot(theta, r, label='how2matplotlib.com')
ax.set_title('How to Make a Square Plot With Equal Axes in Matplotlib')
ax.legend()

# Set equal axes
ax.set_aspect('equal')

plt.show()
Output:
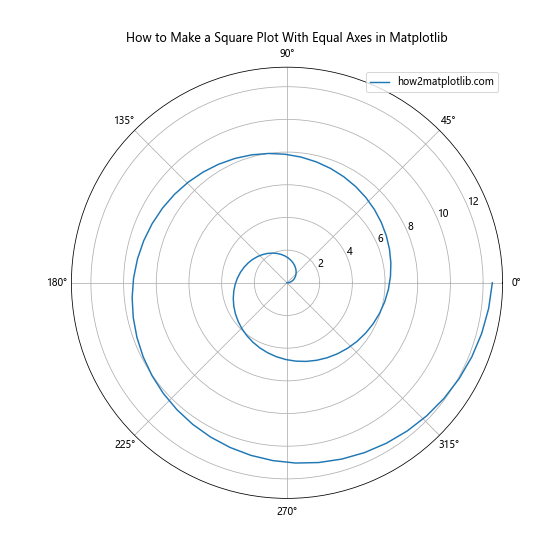
In this example, we create a spiral plot using polar coordinates. The subplot_kw=dict(projection='polar') parameter sets up the polar projection, and ax.set_aspect('equal') ensures that the plot remains square with equal axes.
Square Plots with Custom Aspect Ratios
While we’ve focused on creating perfect squares, sometimes you may need to create rectangular plots with a specific aspect ratio. Here’s how to achieve this:
import matplotlib.pyplot as plt
import numpy as np

# Generate sample data
x = np.linspace(0, 10, 100)
y = np.sin(x)

# Create the plot
fig, ax = plt.subplots(figsize=(10, 5))
ax.plot(x, y, label='how2matplotlib.com')
ax.set_title('How to Make a Plot With Custom Aspect Ratio in Matplotlib')
ax.set_xlabel('X-axis')
ax.set_ylabel('Y-axis')
ax.legend()

# Set custom aspect ratio (e.g., 2:1)
ax.set_aspect(0.5)

plt.show()
Output:
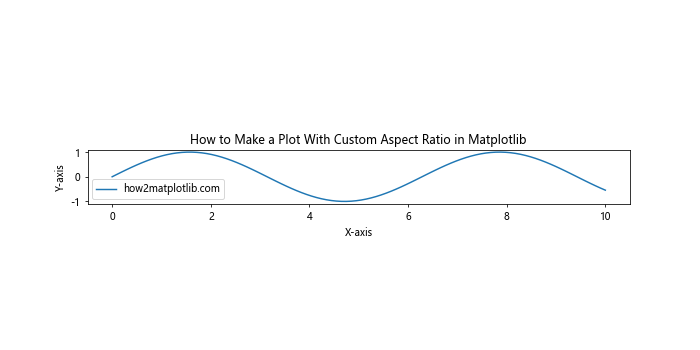
In this example, we use ax.set_aspect(0.5) to create a plot with a 2:1 aspect ratio. This technique can be useful when you need to create plots that fit specific dimensions while maintaining proportional axes.
Handling Edge Cases and Troubleshooting
When learning how to make a square plot with equal axes in Matplotlib, you may encounter some challenges. Here are some common issues and how to address them:
Dealing with Logarithmic Scales
Creating square plots with equal axes becomes more challenging when using logarithmic scales. Here’s how to handle this situation:
import matplotlib.pyplot as plt
import numpy as np

# Generate sample data
x = np.logspace(0, 2, 100)
y = x**2

# Create the plot
fig, ax = plt.subplots(figsize=(8, 8))
ax.loglog(x, y, label='how2matplotlib.com')
ax.set_title('How to Make a Square Plot With Equal Axes in Matplotlib (Log Scale)')
ax.set_xlabel('X-axis (log scale)')
ax.set_ylabel('Y-axis (log scale)')
ax.legend()

# Set equal axes for log scale
ax.set_aspect('equal', adjustable='box')

plt.show()
Output:
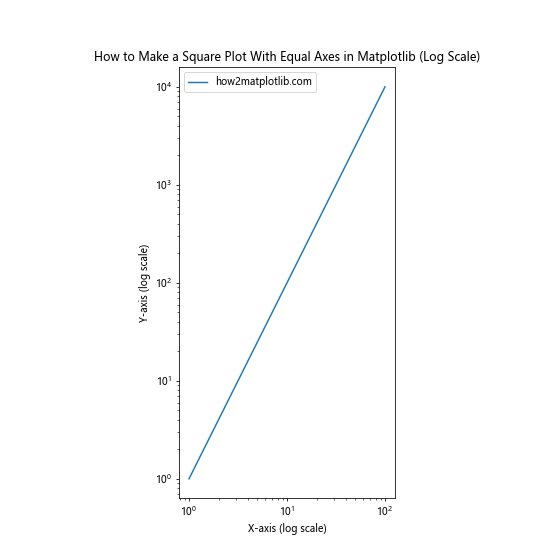
In this example, we use ax.set_aspect('equal', adjustable='box') to maintain equal axes in a logarithmic plot. The adjustable='box' parameter ensures that the plot adjusts its size to maintain the aspect ratio.
Handling Data with Extreme Outliers
When dealing with data that has extreme outliers, creating a square plot with equal axes can be challenging. Here’s a technique to address this issue:
import matplotlib.pyplot as plt
import numpy as np

# Generate sample data with outliers
np.random.seed(42)
x = np.random.rand(100)
y = np.random.rand(100)
x[0], y[0] = 100, 100  # Add an outlier

# Create the plot
fig, ax = plt.subplots(figsize=(8, 8))
ax.scatter(x, y, label='how2matplotlib.com')
ax.set_title('How to Make a Square Plot With Equal Axes in Matplotlib (With Outliers)')
ax.set_xlabel('X-axis')
ax.set_ylabel('Y-axis')
ax.legend()

# Set equal axes
ax.set_aspect('equal')

# Zoom in on the main cluster of data
ax.set_xlim(0, 1)
ax.set_ylim(0, 1)

# Add an inset axes for the outlier
axins = ax.inset_axes([0.65, 0.65, 0.3, 0.3])
axins.scatter(x, y)
axins.set_xlim(0, 110)
axins.set_ylim(0, 110)
axins.set_aspect('equal')

ax.indicate_inset_zoom(axins)

plt.show()
Output:
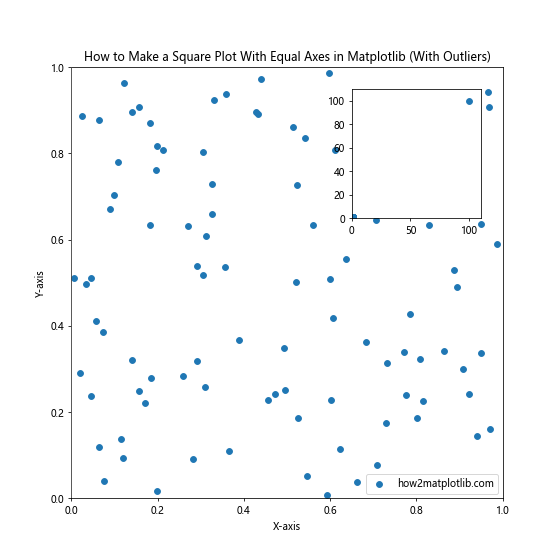
In this example, we create a main plot that focuses on the bulk of the data, and an inset axes that shows the full range including the outlier. Both plots maintain equal axes using set_aspect('equal').
Best Practices for Square Plots with Equal Axes
As we conclude our exploration of how to make a square plot with equal axes in Matplotlib, let’s review some best practices:
- Always use
ax.set_aspect('equal')orplt.axis('equal')to ensure equal axes. - Consider the
figsizeparameter when creating your figure to maintain overall squareness. - Adjust axis limits manually when necessary to create a perfect square.
- Use
tight_layout()to prevent overlapping elements in your plot. - When working with subplots, apply the equal aspect ratioto each subplot individually.
- For logarithmic scales, use
ax.set_aspect('equal', adjustable='box'). - Consider using inset axes for handling outliers while maintaining a square plot.
- Always label your axes and include a title to provide context for your square plot.
- Use appropriate color schemes and markers to enhance the readability of your square plots.
- Experiment with different Matplotlib styles to find the one that best suits your square plot needs.
Advanced Applications of Square Plots with Equal Axes
Now that we’ve covered the fundamentals and best practices of how to make a square plot with equal axes in Matplotlib, let’s explore some advanced applications and techniques.
Creating Animated Square Plots
Animated plots can be a powerful way to visualize changing data over time while maintaining a square aspect ratio. Here’s an example of how to create an animated square plot:
import matplotlib.pyplot as plt
import matplotlib.animation as animation
import numpy as np

# Generate initial data
x = np.linspace(0, 2*np.pi, 100)
y = np.sin(x)

# Create the figure and axis
fig, ax = plt.subplots(figsize=(8, 8))
line, = ax.plot(x, y, label='how2matplotlib.com')
ax.set_title('How to Make an Animated Square Plot With Equal Axes in Matplotlib')
ax.set_xlabel('X-axis')
ax.set_ylabel('Y-axis')
ax.legend()

# Set equal axes
ax.set_aspect('equal')
ax.set_xlim(0, 2*np.pi)
ax.set_ylim(-1.5, 1.5)

# Animation update function
def update(frame):
    line.set_ydata(np.sin(x + frame/10))
    return line,

# Create the animation
ani = animation.FuncAnimation(fig, update, frames=100, interval=50, blit=True)

plt.show()
Output:
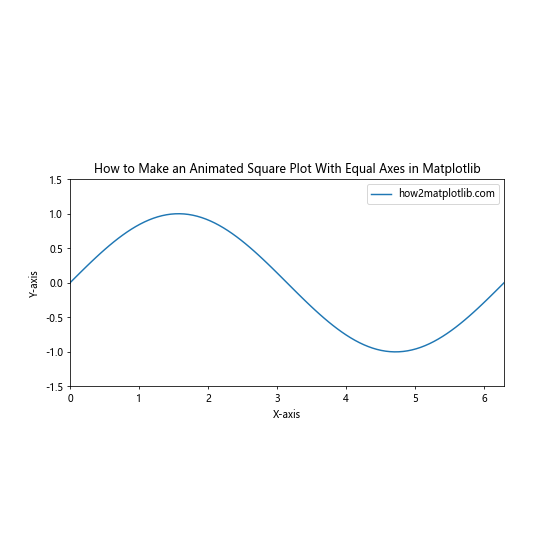
In this example, we create an animated sine wave that maintains a square aspect ratio throughout the animation. The set_aspect('equal') ensures that the plot remains square as the data changes.
Creating Square Plots with Custom Projections
Matplotlib supports various map projections, which can be useful for geographical data visualization. Here’s an example of how to create a square plot with a custom projection:
import matplotlib.pyplot as plt
import cartopy.crs as ccrs
import cartopy.feature as cfeature

# Create the figure and axis with a specific projection
fig, ax = plt.subplots(figsize=(8, 8), subplot_kw={'projection': ccrs.Orthographic(0, 0)})

# Add map features
ax.add_feature(cfeature.OCEAN)
ax.add_feature(cfeature.LAND)
ax.add_feature(cfeature.COASTLINE)

# Set the title and add a label for how2matplotlib.com
ax.set_title('How to Make a Square Plot With Equal Axes in Matplotlib (Map Projection)')
ax.text(-0.1, -0.1, 'how2matplotlib.com', transform=ax.transAxes)

# Set global view
ax.set_global()

plt.show()
Output:

In this example, we use the Cartopy library to create a square plot with an Orthographic projection of the Earth. The set_global() method ensures that we see the entire globe in our square plot.
Troubleshooting Common Issues
When learning how to make a square plot with equal axes in Matplotlib, you might encounter some common issues. Let’s address a few of these and provide solutions:
Issue 1: Distorted Circular Data
Sometimes, even after setting equal axes, circular data may appear distorted. Here’s how to fix this:
import matplotlib.pyplot as plt
import numpy as np

# Generate data for a circle
theta = np.linspace(0, 2*np.pi, 100)
r = 1
x = r * np.cos(theta)
y = r * np.sin(theta)

# Create the plot
fig, ax = plt.subplots(figsize=(8, 8))
ax.plot(x, y, label='how2matplotlib.com')
ax.set_title('How to Make a Square Plot With Equal Axes in Matplotlib (Fixing Distorted Circles)')
ax.set_xlabel('X-axis')
ax.set_ylabel('Y-axis')
ax.legend()

# Set equal axes
ax.set_aspect('equal', adjustable='datalim')

# Adjust limits to ensure square plot
ax.set_xlim(-1.1, 1.1)
ax.set_ylim(-1.1, 1.1)

plt.show()
Output:
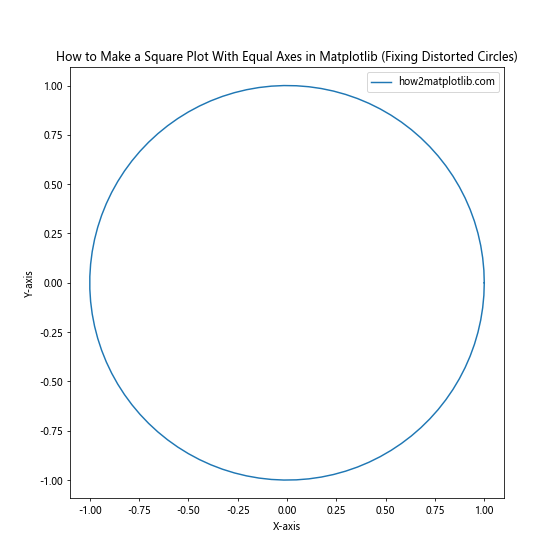
In this example, we use ax.set_aspect('equal', adjustable='datalim') to ensure that the data limits are adjusted to maintain the aspect ratio, rather than the plot box.
Issue 2: Unequal Tick Spacing
Sometimes, setting equal axes can result in unequal tick spacing. Here’s how to address this:
import matplotlib.pyplot as plt
import numpy as np

# Generate sample data
x = np.linspace(0, 10, 100)
y = x**2

# Create the plot
fig, ax = plt.subplots(figsize=(8, 8))
ax.plot(x, y, label='how2matplotlib.com')
ax.set_title('How to Make a Square Plot With Equal Axes in Matplotlib (Fixing Tick Spacing)')
ax.set_xlabel('X-axis')
ax.set_ylabel('Y-axis')
ax.legend()

# Set equal axes
ax.set_aspect('equal', adjustable='box')

# Set equal number of ticks on both axes
ax.set_xticks(np.linspace(ax.get_xlim()[0], ax.get_xlim()[1], 6))
ax.set_yticks(np.linspace(ax.get_ylim()[0], ax.get_ylim()[1], 6))

plt.show()
Output:
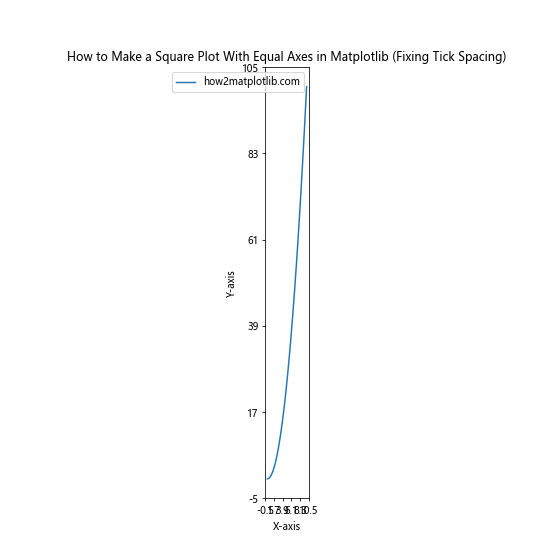
In this example, we manually set the tick locations using set_xticks() and set_yticks() to ensure equal spacing on both axes.
Conclusion
Mastering how to make a square plot with equal axes in Matplotlib is a valuable skill for any data scientist or visualization expert. Throughout this comprehensive guide, we’ve explored various techniques, from basic methods to advanced applications, to create square plots with equal axes.
We’ve covered:
- Basic techniques using
plt.axis('equal')andax.set_aspect('equal') - Advanced methods for scatter plots, heatmaps, and polar coordinates
- Handling subplots and custom aspect ratios
- Dealing with logarithmic scales and outliers
- Best practices for creating effective square plots
- Advanced applications like animated plots and custom projections
- Troubleshooting common issues
By applying these techniques and best practices, you’ll be able to create accurate, visually appealing square plots with equal axes in Matplotlib for a wide range of data visualization scenarios.
Remember, the key to mastering how to make a square plot with equal axes in Matplotlib is practice and experimentation. Don’t be afraid to try different approaches and combine techniques to achieve the perfect square plot for your specific data and visualization needs.